Powerpoint Templates and Google slides for Dashboard Using
Save Your Time and attract your audience with our fully editable PPT Templates and Slides.
-
 Digital Currency User Performance Dashboard
This slide depicts a dashboard highlighting registered users, investment amount, sales, profit or loss etc to analyze digital currency assets performance. Presenting our well structured Digital Currency User Performance Dashboard. The topics discussed in this slide are Digital Currency, User Performance Dashboard, Assets Performance. This is an instantly available PowerPoint presentation that can be edited conveniently. Download it right away and captivate your audience.
-
 SaaS Executive Dashboard For Reporting User Experience
This slide highlights SaaS executive dashboard for evaluating client satisfaction. The purpose of this template is to help organizations in facilitating data driven decision making for enhancing customer satisfaction and engagement. It includes elements such as total accounts, open tickets, sign up funnel, etc. Introducing our SaaS Executive Dashboard For Reporting User Experience set of slides. The topics discussed in these slides are Total Accounts, Open Tickets, Hourly Dashboard Views. This is an immediately available PowerPoint presentation that can be conveniently customized. Download it and convince your audience.
-
 SaaS KPI Dashboard Highlighting Product Usage
This slide highlights dashboard with SaaS KPIs showing product utilization. The purpose of this template is to empower teams for monitoring and improving features based on user engagement and utility. It includes elements such as actions, new users, net promoter score, etc. Introducing our SaaS KPI Dashboard Highlighting Product Usage set of slides. The topics discussed in these slides are New Document Uploads, Net Promoter Score, Product Usage. This is an immediately available PowerPoint presentation that can be conveniently customized. Download it and convince your audience.
-
 RPA Centre Of Excellence Total Usage Tracking Dashboard
This slide showcases dashboard tracking usage of robotic process automation. The main purpose of this template is highlighting per day usage of robotic automation in business. This includes total usage, robot usage, types of robots, etc. Introducing our RPA Centre Of Excellence Total Usage Tracking Dashboard set of slides. The topics discussed in these slides are Busiest Robots, Process, Types Of Robot This is an immediately available PowerPoint presentation that can be conveniently customized. Download it and convince your audience.
-
 Tracking Purchase Insights Using Hyper Personalization Dashboard
This slide illustrates KPI dashboard of hyper- personalization to track audience purchase insights including projected user interaction, origins, equipment type, and countries. Introducing our Tracking Purchase Insights Using Hyper Personalization Dashboard set of slides. The topics discussed in these slides are Personalization, Dashboard, Interaction. This is an immediately available PowerPoint presentation that can be conveniently customized. Download it and convince your audience.
-
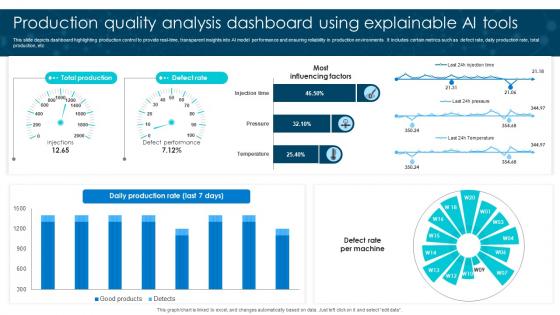 Production Quality Analysis Dashboard Using Explainable AI Tools
This slide depicts dashboard highlighting production control to provide real-time, transparent insights into AI model performance and ensuring reliability in production environments . It includes certain metrics such as defect rate, daily production rate, total production, etc Presenting our well structured Production Quality Analysis Dashboard Using Explainable AI Tools The topics discussed in this slide are Daily Production Rate, Defect Rate, Most Influencing FactorsThis is an instantly available PowerPoint presentation that can be edited conveniently. Download it right away and captivate your audience.
-
 User Experience And Satisfaction Monitoring Dashboard User Experience UX
This slide outlines the dashboard for monitoring and tracking user experience and satisfaction levels, including customer satisfaction scores, CES, NPS, and more. Deliver an outstanding presentation on the topic using this User Experience And Satisfaction Monitoring Dashboard User Experience UX Dispense information and present a thorough explanation of Equal Accessibility, Error Tolerance, Minimal Physical Exertion using the slides given. This template can be altered and personalized to fit your needs. It is also available for immediate download. So grab it now.
-
 E Commerce Dashboard To Enhance Engagement Using Virtual Reality
This slide covers e-commerce KPI or Dashboard into virtual reality by offering immersive experiences including shopping cart abandonment rate, subscription rate, average order value, etc. Introducing our E Commerce Dashboard To Enhance Engagement Using Virtual Reality set of slides. The topics discussed in these slides are Dashboard, Engagement, Marketing. This is an immediately available PowerPoint presentation that can be conveniently customized. Download it and convince your audience.
-
 Impact Analysis By Technology Usage Dashboard
The purpose of this slide is to assess the influence of technology adoption using a comprehensive dashboard, guiding strategic decisions for enhanced operational efficiency and competitive advantage. Introducing our Impact Analysis By Technology Usage Dashboard set of slides. The topics discussed in these slides are Category Allocation, Productivity, Analytics. This is an immediately available PowerPoint presentation that can be conveniently customized. Download it and convince your audience.
-
 Feedback Management Dashboard For User Interface Testing
This slide illustrates a feedback assessment dashboard for user interface testing by evaluating the positive and negative responses. It provides information such as current response, monthly feedback, potential reasons of negative feedback, etc. Presenting our well structured Feedback Management Dashboard For User Interface Testing The topics discussed in this slide are Current Responses, Monthly FeedbacksThis is an instantly available PowerPoint presentation that can be edited conveniently. Download it right away and captivate your audience.
-
 Monitoring Personal Development Using Gamification Dashboard
This slide illustrates gamification dashboard to monitor personal growth including overview, recent achievements, statistics, and best content. Introducing our Monitoring Personal Development Using Gamification Dashboard set of slides. The topics discussed in these slides are Exploration Skills, Contribution Skills, Engager. This is an immediately available PowerPoint presentation that can be conveniently customized. Download it and convince your audience.
-
 Wireless Access Points WAP Data Usage Tracking And Monitoring Dashboard
This slide showcases the data usage tracking and monitoring dashboard. The purpose of this slide is to track the data usage in a company through a dashboard, and the main components are upload and download data usage, free users, plan subscribers, and so on. Deliver an outstanding presentation on the topic using this Wireless Access Points WAP Data Usage Tracking And Monitoring Dashboard. Dispense information and present a thorough explanation of Deployment Status, Online User By Hour, Top Hotspots By Revenue using the slides given. This template can be altered and personalized to fit your needs. It is also available for immediate download. So grab it now.
-
 Patient Healthcare Monitoring Using Machine Vision Dashboard
The purpose of this slide is to showcase patient healthcare monitoring using computer vision dashboard, illustrating how these technologies can be employed to monitor and analyze patient data in real-time, leading to improved healthcare decision-making. Presenting our well structured Patient Healthcare Monitoring Using Machine Vision Dashboard. The topics discussed in this slide are Average Blood Pressure, Medication Tracking, Body Temperature. This is an instantly available PowerPoint presentation that can be edited conveniently. Download it right away and captivate your audience.
-
 Industrial Waste Management Dashboard Using Smart Technology
This slide assist in providing real time visibility or bins, minimize collection costs, and ultimately enhance the overall effectiveness of waste management processes. The KPIs are recycled items, card boards, paper, metal,plastic,etc. Presenting our well structured Industrial Waste Management Dashboard Using Smart Technology. The topics discussed in this slide are Management, Dashboard, Technology. This is an instantly available PowerPoint presentation that can be edited conveniently. Download it right away and captivate your audience.
-
 Network Security Dashboard For User Activity Monitoring
This slide illustrates KPI dashboard of network security to monitor activity including load balancer, network security group, application gateway, protection plan, etc. Presenting our well structured Network Security Dashboard For User Activity Monitoring. The topics discussed in this slide are Load Balancer, Protection Plan, Firewall Policy, Application Gateway. This is an instantly available PowerPoint presentation that can be edited conveniently. Download it right away and captivate your audience.
-
 Hybrid Using Gantt Chart Dashboard Strategic Guide For Hybrid Project Management
The following slide presents a dashboard that can be used by team to plan work deadlines properly and allocate resources accordingly. Major elements covered in the dashboard are project timeline, active projects, completed projects, etc. Deliver an outstanding presentation on the topic using this Hybrid Using Gantt Chart Dashboard Strategic Guide For Hybrid Project Management. Dispense information and present a thorough explanation of Management, Dashboard, Timeline using the slides given. This template can be altered and personalized to fit your needs. It is also available for immediate download. So grab it now.
-
 Saas Growth Plan Dashboard To Track Users
This slide showcases SaaS user leads growth dashboard plan. Its objective is to monitor user base and check the traffic. This slide includes lead velocity, churn rate, average revenue and customer lifetime value. Presenting our set of slides with Saas Growth Plan Dashboard To Track Users This exhibits information on One stages of the process. This is an easy to edit and innovatively designed PowerPoint template. So download immediately and highlight information on Current Lead Velocity, Referral Traffic, Customer Lifetime Value.
-
 Guidelines For Using Cybersecurity Kpis Dashboard
This slide showcases the guidelines for using cybersecurity KPIs dashboard which helps an organization to monitor real time analysis and helps making data driven decisions. It include details such as set goals, choose relevant KPIs, etc. Introducing our Guidelines For Using Cybersecurity Kpis Dashboard set of slides. The topics discussed in these slides are Set Goals, Techniques. This is an immediately available PowerPoint presentation that can be conveniently customized. Download it and convince your audience.
-
 Dashboard For Tracking Logistics Vehicle Using Impact Of IoT Technology In Revolutionizing IoT SS
This slide showcases a dashboard for tracking the performance of logistic vehicles utilizing IoT technology. It incorporates parameters such as location, vehicle name and details, container temperature, compressor details, humidity level, door lock, etc.Deliver an outstanding presentation on the topic using this Dashboard For Tracking Logistics Vehicle Using Impact Of IoT Technology In Revolutionizing IoT SS. Dispense information and present a thorough explanation of Container Temperature, Compressor Details, Humidity Level using the slides given. This template can be altered and personalized to fit your needs. It is also available for immediate download. So grab it now.
-
 Using Audit Dashboard For Resolving IT Issues
This slide demonstrates IT audit data dashboard for identifying and taking remedial actions against risk mitigation. It includes metrics such as coverage, file path, end users and teams, etc. Presenting our well structured Using Audit Dashboard For Resolving IT Issues. The topics discussed in this slide are Coverage, Effective Directory, Ineffective Accounts. This is an instantly available PowerPoint presentation that can be edited conveniently. Download it right away and captivate your audience.
-
 Dashboard To Track Users Wallet Comprehensive Guide To Blockchain Wallets And Applications BCT SS
This slide covers dashboard to evaluate users transactions using crypto wallets. The purpose of this template is to provide an overview on crypto balance, market scenario, latest transactions, trends, etc. Deliver an outstanding presentation on the topic using this Dashboard To Track Users Wallet Comprehensive Guide To Blockchain Wallets And Applications BCT SS. Dispense information and present a thorough explanation of Dashboard, Transactions, Overview using the slides given. This template can be altered and personalized to fit your needs. It is also available for immediate download. So grab it now.
-
 Manage Anti Virus Dashboard Using EDR Solutions
Presenting our set of slides with name Manage Anti Virus Dashboard Using EDR Solutions. This exhibits information on three stages of the process. This is an easy to edit and innovatively designed PowerPoint template. So download immediately and highlight information on Manage Anti Virus Dashboard, Device Status, Attention Required, Security Risks.
-
 Gamification Elements And User Experience Dashboard
This slide illustrates KPIDashboard of gamification elements including achievements and leaderboard. Introducing our Gamification Elements And User Experience Dashboard set of slides. The topics discussed in these slides are Achievements, Leaderboard. This is an immediately available PowerPoint presentation that can be conveniently customized. Download it and convince your audience.
-
 Cross Skilling Training Dashboard For Blockchain Users
This slide illustrates KPI or dashboard for cross- skilling training and includes enrolled trainings, ongoing trainings, completed trainings, etc. Presenting our well structured Cross Skilling Training Dashboard For Blockchain Users. The topics discussed in this slide are Enrolled Trainings, Ongoing Trainings, Completed Trainings. This is an instantly available PowerPoint presentation that can be edited conveniently. Download it right away and captivate your audience.
-
 Cash Flow Dashboard Measuring Business Performance Using Kpis
Following slide covers cash flow dashboard covering details like beginning cash on hand, cash going in, cash going out, profit or loss and ending cash on hand. It also includes detail of accounts receivable and payable. Present the topic in a bit more detail with this Cash Flow Dashboard Measuring Business Performance Using Kpis. Use it as a tool for discussion and navigation on Dashboard, Accounts, Receivable. This template is free to edit as deemed fit for your organization. Therefore download it now.
-
 Customer Satisfaction Dashboard Measuring Business Performance Using Kpis
Mentioned slide covers customer satisfaction dashboard with a 12-month format. It includes customer satisfaction details by region and by district. Deliver an outstanding presentation on the topic using this Customer Satisfaction Dashboard Measuring Business Performance Using Kpis. Dispense information and present a thorough explanation of Customer, Satisfaction, Dashboard using the slides given. This template can be altered and personalized to fit your needs. It is also available for immediate download. So grab it now.
-
 Customer Service Dashboard Snapshot Measuring Business Performance Using Kpis
Following slide illustrates customer service dashboard covering details such as request answered, total requests, total revenue and support cost revenue. It also includes customer satisfaction score, customer retention in a 12 months format. Present the topic in a bit more detail with this Customer Service Dashboard Snapshot Measuring Business Performance Using Kpis. Use it as a tool for discussion and navigation on Customer, Service, Dashboard. This template is free to edit as deemed fit for your organization. Therefore download it now.
-
 Use dashboard tool web dashboards good ppt example
Presenting use dashboard tool web dashboards good ppt example. This is a dashboard tool web dashboards good ppt example. This is a two stage process. The stages in this process are productivity ranking, district, offline, sales score and closing ratio, current sales score, initial fees avg, closing ratio.
-
 Strategic plan for strengthening end user intimacy business revenue dashboard
This slide highlights business dashboard with multiple statistics to estimate the revenue and profitability of company as a result of new customer intimacy strategy. Present the topic in a bit more detail with this Strategic Plan For Strengthening End User Intimacy Business Revenue Dashboard. Use it as a tool for discussion and navigation on Customers, Average, Target Revenue, Cost. This template is free to edit as deemed fit for your organization. Therefore download it now.
-
 Strategic plan for strengthening end user intimacy customer experience dashboard
Mentioned slide provides comprehensive statistics for measuring and evaluating customer experience level with respect to brand persona. It covers customer satisfaction index, rewards member index etc. Present the topic in a bit more detail with this Strategic Plan For Strengthening End User Intimacy Customer Experience Dashboard. Use it as a tool for discussion and navigation on Customer Experience Dashboard. This template is free to edit as deemed fit for your organization. Therefore download it now.
-
 Strategic plan for strengthening end user intimacy dashboard
Deliver an outstanding presentation on the topic using this Strategic Plan For Strengthening End User Intimacy Dashboard. Dispense information and present a thorough explanation of Low, Medium, High using the slides given. This template can be altered and personalized to fit your needs. It is also available for immediate download. So grab it now.
-
 Strategic plan for strengthening end user intimacy customer service dashboard
This slide majorly aims to provide insights about the impact of customer intimacy strategy on customer service quality. It shows complaint ticket status, customer happiness ratings, and average traffic analysis etc. Deliver an outstanding presentation on the topic using this Strategic Plan For Strengthening End User Intimacy Customer Service Dashboard. Dispense information and present a thorough explanation of Analysis, Average using the slides given. This template can be altered and personalized to fit your needs. It is also available for immediate download. So grab it now.
-
 Agile sprint dashboard with engaged users
Introducing our Agile Sprint Dashboard With Engaged Users set of slides. The topics discussed in these slides are Agile Sprint Dashboard With Engaged Users. This is an immediately available PowerPoint presentation that can be conveniently customized. Download it and convince your audience.
-
 Agile sprint dashboard with user workload
Presenting our well structured Agile Sprint Dashboard With User Workload. The topics discussed in this slide are Agile Sprint Dashboard With User Workload. This is an instantly available PowerPoint presentation that can be edited conveniently. Download it right away and captivate your audience.
-
 Building messaging canva identifying product usp product performance dashboard
The following slide displays a brand awareness dashboard as it highlights the key metrics for measuring brand awareness such as, brand search, social media searches, links, brand and mentions. Deliver an outstanding presentation on the topic using this Building Messaging Canva Identifying Product USP Product Performance Dashboard. Dispense information and present a thorough explanation of Inbound Traffic, Visits From, Authority, Attention Traffic using the slides given. This template can be altered and personalized to fit your needs. It is also available for immediate download. So grab it now.
-
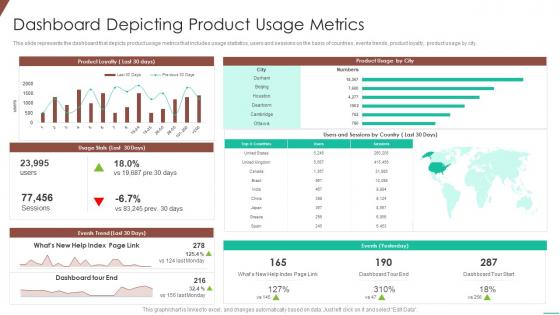 Dashboard depicting product usage metrics optimizing product development system
This slide represents the dashboard that depicts product usage metrics that includes usage statistics, users and sessions on the basis of countries, events trends, product loyalty, product usage by city. Deliver an outstanding presentation on the topic using this Dashboard Depicting Product Usage Metrics Optimizing Product Development System. Dispense information and present a thorough explanation of Dashboard Depicting Product Usage Metrics using the slides given. This template can be altered and personalized to fit your needs. It is also available for immediate download. So grab it now.
-
 Information Technology Dashboard Depicting User Activity
This slide shows information technology dashboard depicting user activity which can be referred by IT managers to track leads and make decisions. It includes information about sessions, signups, position, size, industry, customers, quality leads, etc. Introducing our Information Technology Dashboard Depicting User Activity set of slides. The topics discussed in these slides are Customers, Monthly Recurring Revenue, Quality Leads. This is an immediately available PowerPoint presentation that can be conveniently customized. Download it and convince your audience.
-
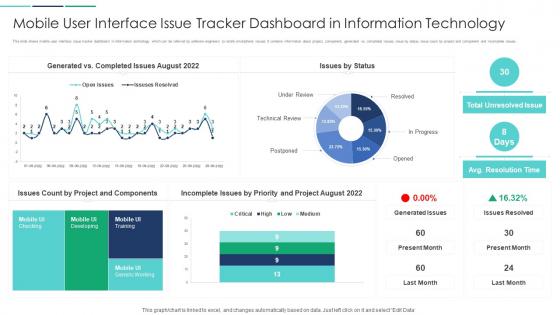 Mobile User Interface Issue Tracker Dashboard In Information Technology
This slide shows mobile user interface issue tracker dashboard in information technology which can be referred by software engineers to rectify smartphone issues. It contains information about project, component, generated vs completed issues, issue by status, issue count by project and component and incomplete issues. Presenting our well structured Mobile User Interface Issue Tracker Dashboard In Information Technology. The topics discussed in this slide are Mobile User Interface Issue Tracker Dashboard In Information Technology. This is an instantly available PowerPoint presentation that can be edited conveniently. Download it right away and captivate your audience.
-
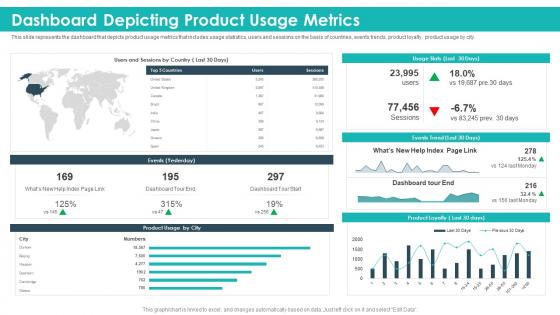 Dashboard depicting product usage metrics strategic product planning
This slide represents the dashboard that depicts product usage metrics that includes usage statistics, users and sessions on the basis of countries, events trends, product loyalty, product usage by city. Deliver an outstanding presentation on the topic using this Dashboard Depicting Product Usage Metrics Strategic Product Planning. Dispense information and present a thorough explanation of Dashboard Depicting Product Usage Metrics using the slides given. This template can be altered and personalized to fit your needs. It is also available for immediate download. So grab it now.
-
 Mobile Application Analytics Dashboard With Average Daily Users
This slide showcases dashboard that can help organization to analyse the daily active users and traffic generated from mobile application. Its key components daily users trend, installs by country, installs by source and daily active users by device Introducing our Mobile Application Analytics Dashboard With Average Daily Users set of slides. The topics discussed in these slides are Application, Analytics, Dashboard. This is an immediately available PowerPoint presentation that can be conveniently customized. Download it and convince your audience.
-
 Mobile Application Installation Metrics Dashboard With User Sessions
This slide showcases dashboard that can help organization to identify the installation trend of mobile application and formulate strategies in case of declining downloads. Its key components are installs trend, total installs, total sessions and total media source breakdown by revenue Presenting our well-structured Mobile Application Installation Metrics Dashboard With User Sessions. The topics discussed in this slide are Application, Installation, Dashboard. This is an instantly available PowerPoint presentation that can be edited conveniently. Download it right away and captivate your audience.
-
 Using Agile In Data Transformation Project It Kpi Dashboard Monitoring Project Progress
Mentioned slide portrays KPI dashboard for monitoring project progress. KPIS covered here are planned versus actual hours, risks and issues. Present the topic in a bit more detail with this Using Agile In Data Transformation Project It Kpi Dashboard Monitoring Project Progress. Use it as a tool for discussion and navigation on KPI Dashboard For Monitoring Project Progress This template is free to edit as deemed fit for your organization. Therefore download it now.
-
 F37 Using Agile Software Development Project Team Performance Monitoring Dashboard
Following slide portrays performance monitoring dashboard that can be used by organization to track its project team efficiency. It also covers details about billable and non-billable hours with task completion status. Present the topic in a bit more detail with this F37 Using Agile Software Development Project Team Performance Monitoring Dashboard. Use it as a tool for discussion and navigation on Project Title, Task Completion, Hours Spent By Employees, Project Manager. This template is free to edit as deemed fit for your organization. Therefore download it now.
-
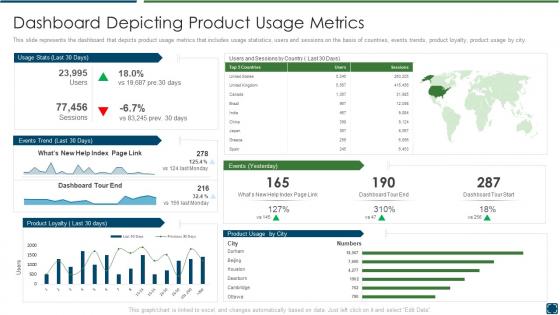 Best practices improve product development dashboard snapshot depicting usage
This slide represents the dashboard that depicts product usage metrics that includes usage statistics, users and sessions on the basis of countries, events trends, product loyalty, product usage by city. Present the topic in a bit more detail with this Best Practices Improve Product Development Dashboard Snapshot Depicting Usage. Use it as a tool for discussion and navigation on Events Trend, Product Loyalty, Product Usage City, Dashboard Tour End. This template is free to edit as deemed fit for your organization. Therefore download it now.
-
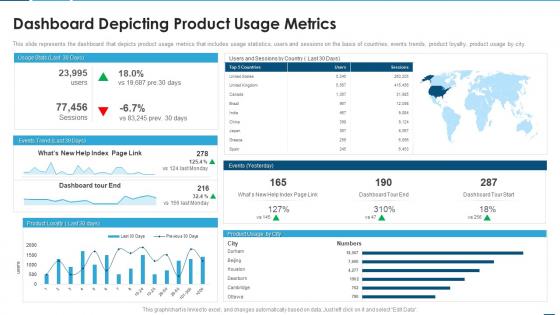 Creating product development strategy dashboard depicting product usage metrics
This slide represents the dashboard that depicts product usage metrics that includes usage statistics,users and sessions on the basis of countries,events trends,product loyalty,product usage by city. Deliver an outstanding presentation on the topic using this Creating Product Development Strategy Dashboard Depicting Product Usage Metrics. Dispense information and present a thorough explanation of Dashboard Depicting Product Usage Metrics using the slides given. This template can be altered and personalized to fit your needs. It is also available for immediate download. So grab it now.
-
 Measuring Sprint Progress Using Agile Dashboard Guide For Web Developers
Mentioned slide showcases agile dashboard that can be used by project manager to track sprint progress. KPIs covered in the slide are overall sprint progress, statistics by priority and statistics by status. Present the topic in a bit more detail with this Measuring Sprint Progress Using Agile Dashboard Guide For Web Developers. Use it as a tool for discussion and navigation on Measuring Sprint Progress Using Agile Dashboard. This template is free to edit as deemed fit for your organization. Therefore download it now.
-
 Corporate KPI Dashboard Showing Bounce Rate With New Users Data
This graph or chart is linked to excel, and changes automatically based on data. Just left click on it and select Edit Data. Presenting our well structured Corporate KPI Dashboard Showing Bounce Rate With New Users Data. The topics discussed in this slide are New Sessions, Unique Pageviews, Time on Page, Bounce Rate, User Demographics, Visitor Statistics. This is an instantly available PowerPoint presentation that can be edited conveniently. Download it right away and captivate your audience.
-
 Tracking User Stories Across Agile Project Development Dashboard Agile Playbook
This slide provides information regarding dashboard for tracking user stories across agile project development including work items, etc. Deliver an outstanding presentation on the topic using this Tracking User Stories Across Agile Project Development Dashboard Agile Playbook. Dispense information and present a thorough explanation of Customer, Marketing, Stories Remaining, Total Scope Increase using the slides given. This template can be altered and personalized to fit your needs. It is also available for immediate download. So grab it now.
-
 Customer Painpoints Dashboard Snapshot With User Experience Performance
This slide illustrates customer painpoints dashboard snapshot with user experience performance benefiting companies in taking decisions according to customer trends. It also includes information about website net promoter score, customer relationship drivers, customer satisfaction CSAT, customer support and orders. Presenting our well structured Customer Painpoints Dashboard With User Experience Performance. The topics discussed in this slide are Customer Painpoints Dashboard With User Experience Performance. This is an instantly available PowerPoint presentation that can be edited conveniently. Download it right away and captivate your audience.
-
 Digital Marketing Promotion Dashboard With Sessions And Users
Presenting our well structured Digital Marketing Promotion Dashboard With Sessions And Users. The topics discussed in this slide are Leads, Lead Conversion, Users. This is an instantly available PowerPoint presentation that can be edited conveniently. Download it right away and captivate your audience.
-
 Telemarketing Promotion Dashboard With Inbound And Outbound Users
Introducing our Telemarketing Promotion Dashboard With Inbound And Outbound Users set of slides. The topics discussed in these slides are Inbound Users, Outbound Users, Inbound Calls. This is an immediately available PowerPoint presentation that can be conveniently customized. Download it and convince your audience.
-
 KPI Dashboard Showing Web Traffic Results Using Analytics Tool
Mentioned slide outlines a comprehensive KPI dashboard highlighting web page results using XYZ analytics tool. The key performance indicators kpis mentioned in the slide are visits, page views, average visit duration, bounce rate, etc. Presenting our well structured KPI Dashboard Showing Web Traffic Results Using Analytics Tool. The topics discussed in this slide are Page Views, Average Visit Duration, Bounce Rate. This is an instantly available PowerPoint presentation that can be edited conveniently. Download it right away and captivate your audience.
-
 KPI Dashboard To Monitor Project Quality Assurance Using Agile Methodology IT
Mentioned slide shows software development project management dashboard. KPIs covered in the dashboard are status of project budget, overdue tasks, workload and upcoming deadlines.Deliver an outstanding presentation on the topic using this KPI Dashboard To Monitor Project Quality Assurance Using Agile Methodology IT Dispense information and present a thorough explanation of Projected Launch Date, Project Budget, Upcoming Deadlines using the slides given. This template can be altered and personalized to fit your needs. It is also available for immediate download. So grab it now.
-
 Project Quality Assurance Using Agile Methodology IT Kpi Dashboard To Monitor Software
Following slide displays software development project status monitoring dashboard with KPIS namely overall task status, actual Vs planned budget, pending items.Present the topic in a bit more detail with this Project Quality Assurance Using Agile Methodology IT Kpi Dashboard To Monitor Software Use it as a tool for discussion and navigation on Dissatisfied Customers, Poor Risk Management, Poor Employee Performance This template is free to edit as deemed fit for your organization. Therefore download it now.
-
 Qa transformation dashboard qa transformation improved product quality user satisfaction
This slide shows the QA Transformation Dashboard with Test Cases and other Variables such as Total Test Cases Passed, Test Cases Failed, Test Cases in Progress, Project Name, Project Stage, Test Type, Test Status etc. Deliver an outstanding presentation on the topic using this QA Transformation Dashboard QA Transformation Improved Product Quality User Satisfaction. Dispense information and present a thorough explanation of QA Transformation Dashboard With Test Cases And Other Variables using the slides given. This template can be altered and personalized to fit your needs. It is also available for immediate download. So grab it now.
-
 Security Dashboard To Manage User Access
Presenting our well structured Security Dashboard To Manage User Access. The topics discussed in this slide are Migration, Security Dashboard, Manage User Access. This is an instantly available PowerPoint presentation that can be edited conveniently. Download it right away and captivate your audience.
-
 Social Media Monitoring Dashboard With User Engagement
Presenting our well structured Social Media Monitoring Dashboard With User Engagement. The topics discussed in this slide are Social Media, Major Metrics, Customer. This is an instantly available PowerPoint presentation that can be edited conveniently. Download it right away and captivate your audience.
-
 Data Center Dashboard Snapshot To Monitor Active Power Usage
Introducing our Data Center Dashboard Snapshot To Monitor Active Power Usage set of slides. The topics discussed in these slides are Budget Power Capacity, Locations Actual Power, Actual And Planned Power. This is an immediately available PowerPoint presentation that can be conveniently customized. Download it and convince your audience.
-
 Data Center Dashboard Snapshot With Security And User Assessment
Introducing our Data Center Dashboard Snapshot With Security And User Assessment set of slides. The topics discussed in these slides are Security Assessment, User Assessment, Data Discovery. This is an immediately available PowerPoint presentation that can be conveniently customized. Download it and convince your audience.
-
 Dashboard For Data Storage And Server Usage Monitoring Optimization Of Cloud Computing
Below dashboard depicts major statistics based on data storage and server usage of cloud for better optimizing cloud components in order to reduce overall cost.Present the topic in a bit more detail with this Dashboard For Data Storage And Server Usage Monitoring Optimization Of Cloud Computing Use it as a tool for discussion and navigation on Storage Utilization, Key Takeaway, Virtual Memory This template is free to edit as deemed fit for your organization. Therefore download it now.


