Powerpoint Templates and Google slides for Dashboard Showing Construction
Save Your Time and attract your audience with our fully editable PPT Templates and Slides.
-
 Dashboard Showing Construction Project Management
This slide shows the dashboard which depicts the construction project management performance such as billing date, working profit, total cost, billed percentage, budget spent, completed projects and comparison of two companies about revenues earned from project. Introducing our Dashboard Showing Construction Project Management set of slides. The topics discussed in these slides are Dashboard Showing Construction, Project Management This is an immediately available PowerPoint presentation that can be conveniently customized. Download it and convince your audience.
-
 Engineering procurement and construction kpi dashboard showing cost of purchase order and cost reduction
You can use this PPT slideshow very easily as it is fully customizable. You can effortlessly insert or remove any diagrammatic representation from the given template. The font size, font color and font style can be easily edited. This graph PPT is linked to excel and changes automatically based on the data you enter. You can save the deck in either PDF or JPG format. To make any changes in the PPT slideshow, simply follow the instructions given in the sample slides. The size, color and orientation of all shapes are 100% customizable, so don’t waste any further time and download this presentation.
-
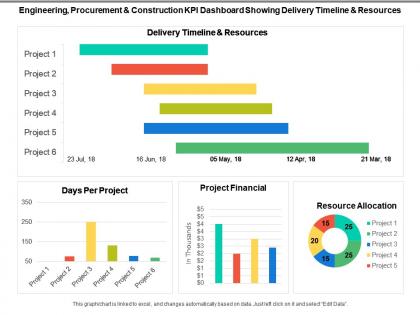
 Engineering procurement and construction kpi dashboard showing delivery timeline and resources
Presenting this set of slides with name - Engineering Procurement And Construction Kpi Dashboard Showing Delivery Timeline And Resources. This is a four stage process. The stages in this process are Engineering, Procurement And Construction, Construction Management, Engineering, Purchasing And Construction .
-
 Engineering procurement and construction kpi dashboard showing net project revenue per employee
Presenting this set of slides with name - Engineering Procurement And Construction Kpi Dashboard Showing Net Project Revenue Per Employee. This is a two stage process. The stages in this process are Engineering, Procurement And Construction, Construction Management, Engineering, Purchasing And Construction .
-
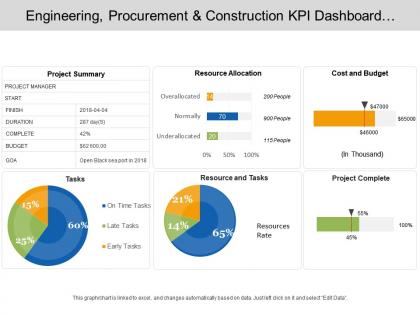
 Engineering procurement and construction kpi dashboard showing project summary cost and budget
Presenting this set of slides with name - Engineering Procurement And Construction Kpi Dashboard Showing Project Summary Cost And Budget. This is a four stage process. The stages in this process are Engineering, Procurement And Construction, Construction Management, Engineering, Purchasing And Construction .
-
 Construction Project Management Dashboard Showing Resource Allocation
This slide shows the project management dashboard which covers the allocation of resources among workers including their job profiles such as resource manager, consultant, director consulting services, etc. with actions like finding project for worker, searching candidates. Introducing our Construction Project Management Dashboard Showing Resource Allocation set of slides. The topics discussed in these slides are Construction Project Management, Dashboard Showing Resource Allocation This is an immediately available PowerPoint presentation that can be conveniently customized. Download it and convince your audience.
-
 Infrastructure kpi dashboard showing project revenue civil infrastructure construction management ppt icon
Deliver an outstanding presentation on the topic using this Infrastructure KPI Dashboard Showing Project Revenue Civil Infrastructure Construction Management Ppt Icon. Dispense information and present a thorough explanation of Construction And Demolition West Recycled, Net Project Revenue Per Employee, Dollars Per Employee using the slides given. This template can be altered and personalized to fit your needs. It is also available for immediate download. So grab it now.
-
 Infrastructure kpi dashboard showing resource allocation civil infrastructure construction management ppt grid
Deliver an outstanding presentation on the topic using this Infrastructure KPI Dashboard Showing Resource Allocation Civil Infrastructure Construction Management Ppt Grid. Dispense information and present a thorough explanation of Days Per Project, Project Financial, Resource Allocation using the slides given. This template can be altered and personalized to fit your needs. It is also available for immediate download. So grab it now.


