Powerpoint Templates and Google slides for Company Profitability Report
Save Your Time and attract your audience with our fully editable PPT Templates and Slides.
-
 Four Quadrant Status Report Of Company Sales And Profit
This slide showcases four quadrant reports of company sales and profit. The main purpose of this slide is showcasing completing of targets in different quarters and net profit gain in various quarters. Introducing our Four Quadrant Status Report Of Company Sales And Profit set of slides. The topics discussed in these slides are Quarterly Sales, Budget Incurred. This is an immediately available PowerPoint presentation that can be conveniently customized. Download it and convince your audience.
-
 Gross Profit And Margin Engineering Company Financial Summary Report
This slide illustrates a graph of gross profit in US dollar and gross margin in percentage for engineering company illustrating growth trend in last five years from 2019 to 2023. Deliver an outstanding presentation on the topic using this Gross Profit And Margin Engineering Company Financial Summary Report. Dispense information and present a thorough explanation of Gross Profit, Engineering Company, Illustrating Growth using the slides given. This template can be altered and personalized to fit your needs. It is also available for immediate download. So grab it now.
-
 Net Profit And Margin Engineering Company Financial Summary Report
This slide illustrates a graph of net profit in US dollar and gross margin in percentage for engineering company illustrating growth in last five years from 2019 to 2023. Present the topic in a bit more detail with this Net Profit And Margin Engineering Company Financial Summary Report. Use it as a tool for discussion and navigation on Profit And Margin, Engineering Company, Illustrating Growth. This template is free to edit as deemed fit for your organization. Therefore download it now.
-
 Operating Profit And Margin Engineering Company Financial Summary Report
This slide illustrates a graph of operating profit in US dollar and gross margin in percentage for engineering company illustrating key insights and changes in last five years from 2019 to 2023. Deliver an outstanding presentation on the topic using this Operating Profit And Margin Engineering Company Financial Summary Report. Dispense information and present a thorough explanation of Operating, Profit And Margin, Material Prices using the slides given. This template can be altered and personalized to fit your needs. It is also available for immediate download. So grab it now.
-
 Gross Profit And Margin Software Company Financial Summary Report Ppt Diagrams
This slide illustrates a graph of gross profit in US doller and gross margin in percentage for software company illustrating growth trend in last five years from 2019 to 2023. It also showcases gross profit contribution by services and solutions. Deliver an outstanding presentation on the topic using this Gross Profit And Margin Software Company Financial Summary Report Ppt Diagrams. Dispense information and present a thorough explanation of Total Gross Profit, Services Gross Profit, Solutions Gross Profit using the slides given. This template can be altered and personalized to fit your needs. It is also available for immediate download. So grab it now.
-
 Net Profit And Margin Software Company Financial Summary Report Ppt Professional
This slide illustrates a graph of net profit in US doller and net margin in percentage for software company illustrating growth trend in last five years from 2019 to 2023. It also showcases net profit contribution by services and solutions. Present the topic in a bit more detail with this Net Profit And Margin Software Company Financial Summary Report Ppt Professional. Use it as a tool for discussion and navigation on Net Profit, Services Net Profit, Solutions Net Profit. This template is free to edit as deemed fit for your organization. Therefore download it now.
-
 Operating Profit And Margin Software Company Financial Summary Report Ppt Summary
This slide illustrates a graph of operating profit in US doller and operating margin in percentage for software company illustrating growth trend in last five years from 2019 to 2023. It also showcases operating profit contribution by services and solutions. Deliver an outstanding presentation on the topic using this Operating Profit And Margin Software Company Financial Summary Report Ppt Summary. Dispense information and present a thorough explanation of Operating Profit, Services Operating Profit, Solutions Operating Profit using the slides given. This template can be altered and personalized to fit your needs. It is also available for immediate download. So grab it now.
-
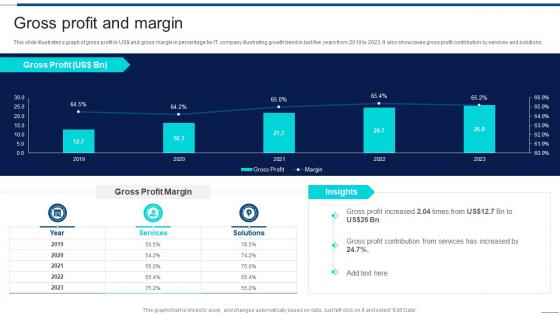 Gross Profit And Margin Information Technology Company Financial Report
This slide illustrates a graph of gross profit in US dollar and gross margin in percentage for IT company illustrating growth trend in last five years from 2019 to 2023. It also showcases gross profit contribution by services and solutions. Deliver an outstanding presentation on the topic using this Gross Profit And Margin Information Technology Company Financial Report. Dispense information and present a thorough explanation of Contribution, Services, Solutions using the slides given. This template can be altered and personalized to fit your needs. It is also available for immediate download. So grab it now.
-
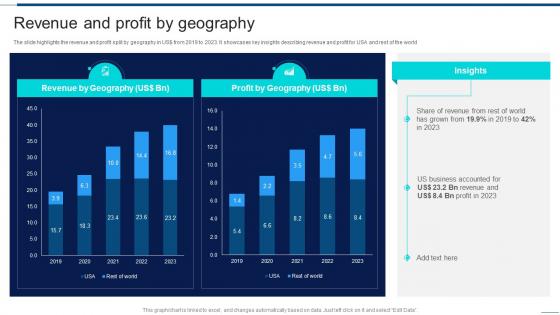 Information Technology Company Financial Report Revenue And Profit By Geography
The slide highlights the revenue and profit split by geography in US dollar from 2019 to 2023. It showcases key insights describing revenue and profit for USA and rest of the world Deliver an outstanding presentation on the topic using this Information Technology Company Financial Report Revenue And Profit By Geography. Dispense information and present a thorough explanation of Revenue, Geography, Business using the slides given. This template can be altered and personalized to fit your needs. It is also available for immediate download. So grab it now.
-
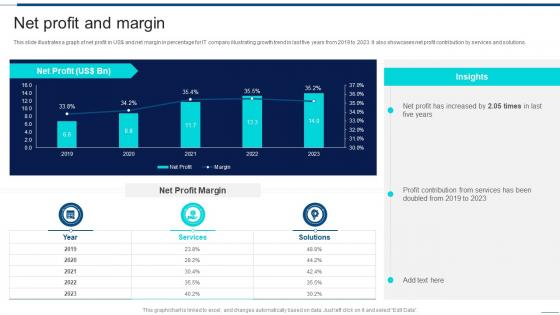 Net Profit And Margin Information Technology Company Financial Report
This slide illustrates a graph of net profit in US dollar and net margin in percentage for IT company illustrating growth trend in last five years from 2019 to 2023. It also showcases net profit contribution by services and solutions. Present the topic in a bit more detail with this Net Profit And Margin Information Technology Company Financial Report. Use it as a tool for discussion and navigation on Contribution, Services, Solutions. This template is free to edit as deemed fit for your organization. Therefore download it now.
-
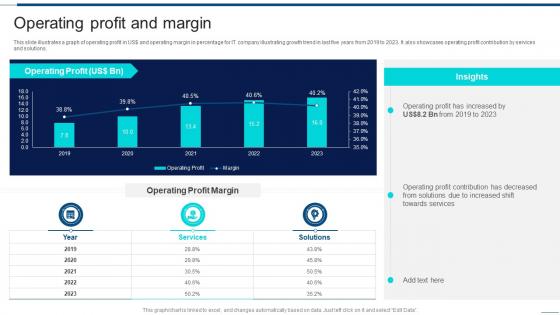 Operating Profit And Margin Information Technology Company Financial Report
This slide illustrates a graph of operating profit in US dollar and operating margin in percentage for IT company illustrating growth trend in last five years from 2019 to 2023. It also showcases operating profit contribution by services and solutions. Deliver an outstanding presentation on the topic using this Operating Profit And Margin Information Technology Company Financial Report. Dispense information and present a thorough explanation of Contribution, Solutions, Services using the slides given. This template can be altered and personalized to fit your needs. It is also available for immediate download. So grab it now.
-
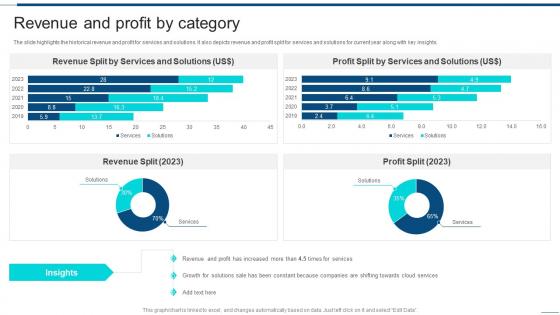 Revenue And Profit By Category Information Technology Company Financial Report
The slide highlights the historical revenue and profit for services and solutions. It also depicts revenue and profit split for services and solutions for current year along with key insights. Present the topic in a bit more detail with this Revenue And Profit By Category Information Technology Company Financial Report. Use it as a tool for discussion and navigation on Revenue, Services, Solutions. This template is free to edit as deemed fit for your organization. Therefore download it now.
-
 Comparative Analysis Of Revenue And Profit Distribution Healthcare Company Financial Report
The slide showcases the comparative analysis of revenue and profit distribution from six global regions. The regions included are south America, north America, Asia, Africa, Oceania, and Europe.Deliver an outstanding presentation on the topic using this Comparative Analysis Of Revenue And Profit Distribution Healthcare Company Financial Report. Dispense information and present a thorough explanation of Revenue Distribution, Profit Distribution, Region Contributes using the slides given. This template can be altered and personalized to fit your needs. It is also available for immediate download. So grab it now.
-
 Gross Profit And Margin Healthcare Company Financial Report
The slide describes gross profit share for FY23 from pharmacy, hospital and research business verticals and historical gross profit growth and margin along with description of statistical data.Present the topic in a bit more detail with this Gross Profit And Margin Healthcare Company Financial Report. Use it as a tool for discussion and navigation on Gross Profit, Business Units, Management Decision. This template is free to edit as deemed fit for your organization. Therefore download it now.
-
 Hospital Business Annual Profit And Revenue Growth Healthcare Company Financial Report
The slide highlights the comparison of annual revenue and profit growth of the hospital business. It compares yearly profit and revenue change in percentage over the period of five years.Present the topic in a bit more detail with this Hospital Business Annual Profit And Revenue Growth Healthcare Company Financial Report. Use it as a tool for discussion and navigation on Revenue Growth, Profit Growth, Business Annual. This template is free to edit as deemed fit for your organization. Therefore download it now.
-
 Hospital Business Profit Generation By Regions Healthcare Company Financial Report
The slide showcases the revenue earned by healthcare companies from different geographical regions. It shows south America, north America, Asia, Africa, Oceania, and Europe.Present the topic in a bit more detail with this Hospital Business Profit Generation By Regions Healthcare Company Financial Report. Use it as a tool for discussion and navigation on Historical Revenue, Hospital Business, Generation Regions. This template is free to edit as deemed fit for your organization. Therefore download it now.
-
 Net Profit And Margin Healthcare Company Financial Report
The slide showcases the bottom line for healthcare group along with net profit margin for last five financial year. It also depict net profit share for FY22 from pharmacy, hospital and research business verticals.Present the topic in a bit more detail with this Net Profit And Margin Healthcare Company Financial Report. Use it as a tool for discussion and navigation on Profit Increased, Pharmacy Business, Major Contributor. This template is free to edit as deemed fit for your organization. Therefore download it now.
-
 Operating Profit And Margin Healthcare Company Financial Report
The slide showcases operating profit trend last five financial years along with profitability margin. It also showcases operating profit share for FY23 from pharmacy, hospital and research business verticals.Deliver an outstanding presentation on the topic using this Operating Profit And Margin Healthcare Company Financial Report. Dispense information and present a thorough explanation of Operating Profit, Increased Cost, Business Units using the slides given. This template can be altered and personalized to fit your needs. It is also available for immediate download. So grab it now.
-
 Business Profit Generation By Global Regions Food Company Financial Report
The slide highlights the profit by geography in USdoller from 2019 to 2023. It showcases key insights describing profit for USA and rest of the world Present the topic in a bit more detail with this Business Profit Generation By Global Regions Food Company Financial Report Use it as a tool for discussion and navigation on Business Profit Generation, Global Regions This template is free to edit as deemed fit for your organization. Therefore download it now.
-
 Food Product Annual Profit By Category Food Company Financial Report
The following slide shows the annual profit generated from product categories sold by company. The categories included are dairy, baked goods, processed meat, seafood, edible oils, baby foods and ready meals. Present the topic in a bit more detail with this Food Product Annual Profit By Category Food Company Financial Report Use it as a tool for discussion and navigation on Food Product, Annual Profit Category This template is free to edit as deemed fit for your organization. Therefore download it now.
-
 Gross Profit And Margin Food Company Financial Report
This slide illustrates a graph of gross profit and gross margin in percentage for food company. Additionally, it shows gross profit of all business lines of the company food, beverage and dairy products Deliver an outstanding presentation on the topic using this Gross Profit And Margin Food Company Financial Report Dispense information and present a thorough explanation of Gross Profit And Margin using the slides given. This template can be altered and personalized to fit your needs. It is also available for immediate download. So grab it now.
-
 Net Profit And Margin Food Company Financial Report
This slide illustrates a graph of net profit in USdoller and gross margin in percentage for food company. Additionally, it shows net profit of all business lines of the company food, beverage and dairy products Present the topic in a bit more detail with this Net Profit And Margin Food Company Financial Report Use it as a tool for discussion and navigation on Net Profit And Margin This template is free to edit as deemed fit for your organization. Therefore download it now.
-
 Operating Profit And Margin Food Company Financial Report
This slide illustrates a graph of operating profit in USdoller and gross margin in percentage for food company. Additionally, it shows operating profit of all business lines of the company food, beverage and dairy products Deliver an outstanding presentation on the topic using this Operating Profit And Margin Food Company Financial Report Dispense information and present a thorough explanation of Operating Profit And Margin using the slides given. This template can be altered and personalized to fit your needs. It is also available for immediate download. So grab it now.
-
 Engineering Services Company Profitability Ratios Engineering Company Financial Summary Report
The following slide highlights the profitability ratio of the Engineering company to assess the organizations capability to earn compared to its revenue. Key ratios included are EBDIT margin, EBIT margin, PBT margin, Net profit margin, and asset turnover percentage. Present the topic in a bit more detail with this Engineering Services Company Profitability Ratios Engineering Company Financial Summary Report. Use it as a tool for discussion and navigation on Engineering, Services Company, Profitability Ratios. This template is free to edit as deemed fit for your organization. Therefore download it now.
-
 Software Company Quarterly Profitability Ratios Software Company Financial Summary Report
The following slide highlights the profitability ratio of the software company to assess the organizations capability to earn compared to its revenue. Key ratios included are EBDIT margin, EBIT margin, PBT margin, Net profit margin, and asset turnover percentage. Deliver an outstanding presentation on the topic using this Software Company Quarterly Profitability Ratios Software Company Financial Summary Report. Dispense information and present a thorough explanation of Net Profit Margin, Software Company, Quarterly Profitability Ratios using the slides given. This template can be altered and personalized to fit your needs. It is also available for immediate download. So grab it now.
-
 Information Technology Company Profitability Ratios Information Technology Company Financial Report
The following slide highlights the profitability ratio of the Information technology company to assess the organizations capability to earn compared to its revenue. Key ratios included are EBDIT margin, EBIT margin, PBT margin, Net profit margin, and asset turnover percentage Present the topic in a bit more detail with this Information Technology Company Profitability Ratios Information Technology Company Financial Report. Use it as a tool for discussion and navigation on Information, Technology, Profitability Ratios. This template is free to edit as deemed fit for your organization. Therefore download it now.
-
 Healthcare And Research Business Profitability Ratios Healthcare Company Financial Report
The following slide highlights the profitability ratio of the healthcare and research business to assess the organizations capability to earn compared to its revenue. Key ratios included are EBDIT margin, EBIT margin, PBT margin, Net profit margin, and asset turnover percentage.Deliver an outstanding presentation on the topic using this Healthcare And Research Business Profitability Ratios Healthcare Company Financial Report. Dispense information and present a thorough explanation of Asset Turnover, Profit Margin, Business Profitability using the slides given. This template can be altered and personalized to fit your needs. It is also available for immediate download. So grab it now.
-
 Food Business Firm Profitability Ratios Food Company Financial Report
The following slide highlights the profitability ratio of the Food company to assess the organizations capability to earn compared to its revenue. Key ratios included are EBDIT margin, EBIT margin, PBT margin, Net profit margin, and asset turnover percentage Present the topic in a bit more detail with this Food Business Firm Profitability Ratios Food Company Financial Report Use it as a tool for discussion and navigation on Food Business Firm, Profitability Ratios This template is free to edit as deemed fit for your organization. Therefore download it now.
-
 Food Company Financial Report Revenue Profit Illustration
This PowerPoint Illustration depicts a colorful pie chart with a dollar sign in the center, representing a financial report from a food company. It is perfect for presentations on financial management, budgeting, and investments.
-
 One page for profitable financing in clothing company report ppt presentation pdf document
Here we present One Page For Profitable Financing In Clothing Company Report PPT Presentation PDF Document one pager PowerPoint template. This is a one pager PowerPoint template depicting the investment opportunities in an apparel company shares. The customizable fashion investment company PowerPoint template comes with a vision and mission statement that can be altered as per your organizations. Present the key highlights of your company taking the assistance of this professionally curated business investment opportunities one pager PowerPoint slide design. Talk about the money spent in marketing campaign and showcase the same by utilizing the marketing expenditure column in this one pager PowerPoint template. Throw some light over the companys country wise marketing expenditure and the financial highlights. Not only this, you can raise funds to expand your business by showcasing the benefits of investing taking the assistance of this investment opportunity one pager PowerPoint template. Customize it as per your requirements and save it in various file formats. Grab this One Page For Profitable Financing In Clothing Company Report PPT PDF Document one pager template now.
-
 One page company name contact us page firm in non profit industry report infographic ppt pdf document
You can survive and sail through cut throat competition, if you have the right skills and products at hand. If a one pager is your upcoming agenda, then it will not be wise of you to proceed in absence of our well designed One Page Company Name Contact Us Page Firm In Non Profit Industry Report Infographic PPT PDF Document template. Our template swears by in depth detailing and thus answers every question that may hit you or your audience at any point of time. Whatever function you may be belonging to, be it marketing, sales, advertising or distribution, our one for all, personalized template is sure to come to your aid every time. Whats more are the multi fold benefits that our one pager layout offers. We make our slides available to you keeping in mind the competitive edge.


