Powerpoint Templates and Google slides for Bivariate
Save Your Time and attract your audience with our fully editable PPT Templates and Slides.
-
 Statistical Analysis Techniques Univariate Vs Bivariate Descriptive Statistical Analysis
The purpose of this slide is to differentiate between univariate and bivariate descriptive statistics. The key factors discussed in this slide are dispersion, central tendency, correlations, number of dependent and independent variables, etc. Present the topic in a bit more detail with this Statistical Analysis Techniques Univariate Vs Bivariate Descriptive Statistical Analysis. Use it as a tool for discussion and navigation on Univariate, Bivariate, Objective, Central Tendency. This template is free to edit as deemed fit for your organization. Therefore download it now.
-
 Visualization research it bivariate analysis techniques for data visualization
This slide describes the second analysis technique, bivariate analysis for data visualization, which includes three plots line, bar, and scatter. Present the topic in a bit more detail with this Visualization Research IT Bivariate Analysis Techniques For Data Visualization. Use it as a tool for discussion and navigation on Line Plot, Bar Plot, Scatter Plot, Evaluating Data. This template is free to edit as deemed fit for your organization. Therefore download it now.
-
 Visualization Research Branches Bivariate Analysis Techniques For Data Visualization
This slide describes the second analysis technique, bivariate analysis for data visualization, which includes three plots line, bar, and scatter. Introducing Visualization Research Branches Bivariate Analysis Techniques For Data Visualization to increase your presentation threshold. Encompassed with three stages, this template is a great option to educate and entice your audience. Dispence information on Line Plot, Bar Plot, Scatter Plot, Data Points, Evaluating Data, using this template. Grab it now to reap its full benefits.
-
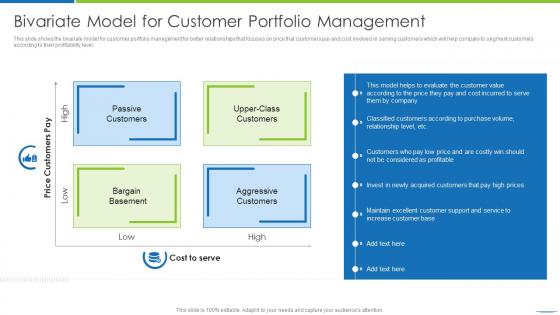
 Bivariate Model For Customer Portfolio Management
This slide shows the bivariate model for customer portfolio management for better relationships that focuses on price that customers pay and cost involved in serving customers which will help company to segment customers according to their profitability level. Presenting our set of slides with Bivariate Model For Customer Portfolio Management. This exhibits information on four stages of the process. This is an easy to edit and innovatively designed PowerPoint template. So download immediately and highlight information on Aggressive Customers, Cost To Serve, Passive Customers.
-
 Bivariate Analysis Techniques For Data Visualization Ppt Powerpoint Presentation File Slide
This slide describes the second analysis technique, bivariate analysis for data visualization, which includes three plots line, bar, and scatter. Present the topic in a bit more detail with this Bivariate Analysis Techniques For Data Visualization Ppt Powerpoint Presentation File Slide. Use it as a tool for discussion and navigation on Line Plot, Bar Plot, Scatter Plot. This template is free to edit as deemed fit for your organization. Therefore download it now.


