Powerpoint Templates and Google slides for Back Order
Save Your Time and attract your audience with our fully editable PPT Templates and Slides.
-
 Achieving Operational Excellence In Retail Determining Back Order Rate And ROR
Following slide illustrates information stats about back order rate and rate of return in the year 2020. Here the graph indicates that back order rate get exceeded to 4.8 percent from the target value in 2020. Deliver an outstanding presentation on the topic using this Achieving Operational Excellence In Retail Determining Back Order Rate And ROR. Dispense information and present a thorough explanation of Back Order Rate, Target Value, Order Return Rate using the slides given. This template can be altered and personalized to fit your needs. It is also available for immediate download. So grab it now.
-
 Determining Back Order Rate And Ror Efficient Management Retail Store Operations
Following slide illustrates information stats about back order rate and rate of return in the year 2023. Here the graph indicates that back order rate get exceeded to 4 8 percent from the target value in 2023. Deliver an outstanding presentation on the topic using this Determining Back Order Rate And Ror Efficient Management Retail Store Operations. Dispense information and present a thorough explanation of Determining Back, Product, Return Rate using the slides given. This template can be altered and personalized to fit your needs. It is also available for immediate download. So grab it now.
-
 Determining Back Order Rate And Ror Managing Retail Business Operations
Following slide illustrates information stats about back order rate and rate of return in the year 2023. Here the graph indicates that back order rate get exceeded to 4 8 percent from the target value in 2023. Present the topic in a bit more detail with this Determining Back Order Rate And Ror Managing Retail Business Operations. Use it as a tool for discussion and navigation on Product, Determining Back, Order Rate. This template is free to edit as deemed fit for your organization. Therefore download it now.
-
 Determining Back Order Rate And Optimizing Retail Operations By Efficiently Handling Inventories
Following slide illustrates information stats about back order rate and rate of return in the year 2023. Here the graph indicates that back order rate get exceeded to 4.8 percentage from the target value in 2023 Deliver an outstanding presentation on the topic using this Determining Back Order Rate And Optimizing Retail Operations By Efficiently Handling Inventories. Dispense information and present a thorough explanation of Order, Return, Product using the slides given. This template can be altered and personalized to fit your needs. It is also available for immediate download. So grab it now.
-
 Percentage value kpi for edi transactions back orders time presentation slide
Presenting percentage value kpi for edi transactions back orders time presentation slide. This presentation slide shows two Key Performance Indicators or KPIs in a Dashboard style design. The first KPI that can be shown is percentage of EDI transactions. The second KPI is percentage of Time Spent Picking Back Orders. These KPI Powerpoint graphics are all data driven, and the shape automatically adjusts according to your data. Just right click on the KPI graphic, enter the right value and the shape will adjust automatically. Make a visual impact with our KPI slides.
-
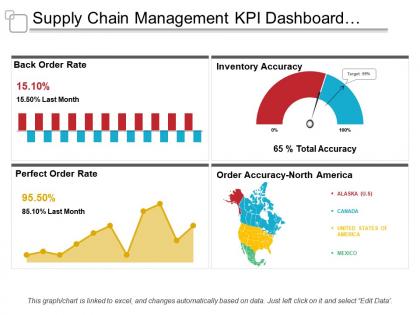
 Supply chain management kpi dashboard showing back order rate and order accuracy
Presenting this set of slides with name - Supply Chain Management Kpi Dashboard Showing Back Order Rate And Order Accuracy. This is a four stage process. The stages in this process are Demand Forecasting, Predicting Future Demand, Supply Chain Management.
-
 Retailer dashboard showing back order rate
Presenting this set of slides with name Retailer Dashboard Showing Back Order Rate. The topics discussed in these slides are Retailer Dashboard Showing Back Order Rate. This is a completely editable PowerPoint presentation and is available for immediate download. Download now and impress your audience.
-
 Supply chain inventory kpi dashboard with return and back order rate
Introducing our Inventory Carrying Rate, Inventory Turn Over, Inventory To Sales Ratio set of slides. The topics discussed in these slides are Inventory Carrying Rate, Inventory Turn Over, Inventory To Sales Ratio. This is an immediately available PowerPoint presentation that can be conveniently customized. Download it and convince your audience.
-
 Warehouse stock dashboard with carrying cost and back order rate
Presenting our well-structured Warehouse Stock Dashboard With Carrying Cost And Back Order Rate. The topics discussed in this slide are Warehouse Turnover, Percentage Of Out Of Stock, Return Rate. This is an instantly available PowerPoint presentation that can be edited conveniently. Download it right away and captivate your audience.


