Powerpoint Templates and Google slides for Average Workforce
Save Your Time and attract your audience with our fully editable PPT Templates and Slides.
-
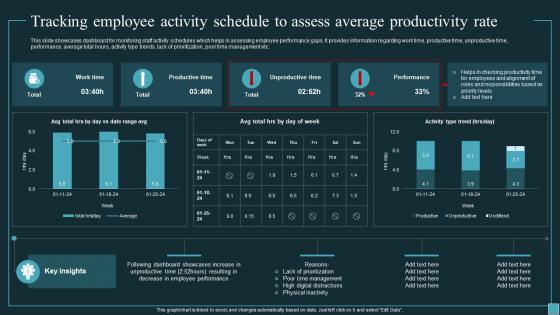
 Implementing Workforce Analytics Tracking Employee Activity Schedule To Assess Average Data Analytics SS
This slide showcases dashboard for monitoring staff activity schedules which helps in assessing employee performance gaps. It provides information regarding work time, productive time, unproductive time, performance, average total hours, activity type trends, lack of prioritization, poor time management etc. Present the topic in a bit more detail with this Implementing Workforce Analytics Tracking Employee Activity Schedule To Assess Average Data Analytics SS. Use it as a tool for discussion and navigation on Tracking Employee Activity Schedule, Assess Average Productivity Rate, Lack Of Prioritization, Poor Time Management. This template is free to edit as deemed fit for your organization. Therefore download it now.
-
 Average Employee Turnover Rate Balanced Scorecard Based On Workforce Age Ppt Infographics
Present the topic in a bit more detail with this Average Employee Turnover Rate Balanced Scorecard Based On Workforce Age Ppt Infographics. Use it as a tool for discussion and navigation on Employee Turnover. This template is free to edit as deemed fit for your organization. Therefore download it now.
-
 Workforce kpi dashboard showing average age female percentage and average tenure
Presenting this set of slides with name - Workforce Kpi Dashboard Showing Average Age Female Percentage And Average Tenure. This is a four stage process. The stages in this process are Staff, Personnel, Workforce.
-
 Workforce kpi dashboard showing staff split by gender and average tenure by department
Presenting this set of slides with name - Workforce Kpi Dashboard Showing Staff Split By Gender And Average Tenure By Department. This is a six stage process. The stages in this process are Staff, Personnel, Workforce.


