Powerpoint Templates and Google slides for Average Quality
Save Your Time and attract your audience with our fully editable PPT Templates and Slides.
-
 Average product delivery effective qa transformation strategies improve product quality
This slide shows details about the increasing Final Product Delivery Time in the past 5 years. The average delivery time is constantly increasing due to absence of advanced software testing techniques leading to increased bug rate in the product. Hence, leading to increased time in delivering the final product. Present the topic in a bit more detail with this Average Product Delivery Effective Qa Transformation Strategies Improve Product Quality Delivery. Use it as a tool for discussion and navigation on Average Product Delivery Time In Absence Of Effective Qa Transformation Techniques. This template is free to edit as deemed fit for your organization. Therefore download it now.
-
 Vendor scorecard kpi dashboard with average delivery and quality score ppt file
Deliver an outstanding presentation on the topic using this Vendor Scorecard KPI Dashboard With Average Delivery And Quality Score Ppt File. Dispense information and present a thorough explanation of Quality Score, Cost Purchase Price, Quality Trend using the slides given. This template can be altered and personalized to fit your needs. It is also available for immediate download. So grab it now.
-
 Implementing Quality Assurance Transformation Average Product Delivery Absence
This slide shows details about the increasing Final Product Delivery Time in the past 5 years. The average delivery time is constantly increasing due to absence of advanced software testing techniques leading to increased bug rate in the product. Hence, leading to increased time in delivering the final product. Deliver an outstanding presentation on the topic using this Implementing Quality Assurance Transformation Average Product Delivery Absence. Dispense information and present a thorough explanation of Transformation, Techniques, Product using the slides given. This template can be altered and personalized to fit your needs. It is also available for immediate download. So grab it now.
-
 Estimated average product qa transformation improved product quality user satisfaction
This slide shows details about the Estimated Average Product Delivery Time in the coming 5 years. Average Product Delivery Time will decline due to application of advanced software testing techniques that speeds up the entire process, remove bugs quickly and delivers the final product in short span of time. Deliver an outstanding presentation on the topic using this Estimated Average Product QA Transformation Improved Product Quality User Satisfaction. Dispense information and present a thorough explanation of Techniques, Software, Average using the slides given. This template can be altered and personalized to fit your needs. It is also available for immediate download. So grab it now.
-
 Qa transformation improved product quality user satisfaction average product delivery
This slide shows details about the increasing Final Product Delivery Time in the past 5 years. The average delivery time is constantly increasing due to absence of advanced software testing techniques leading to increased bug rate in the product. Hence, leading to increased time in delivering the final product. Present the topic in a bit more detail with this QA Transformation Improved Product Quality User Satisfaction Average Product Delivery. Use it as a tool for discussion and navigation on Increase, Average, Product. This template is free to edit as deemed fit for your organization. Therefore download it now.
-
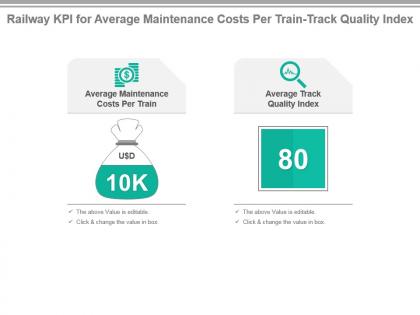
 Railway kpi for average maintenance costs per train track quality index powerpoint slide
Presenting railway kpi for average maintenance costs per train track quality index powerpoint slide. This presentation slide shows Two Key Performance Indicators or KPIs in a Dashboard style design. The first KPI that can be shown is Average Maintenance Costs Per Train. The second KPI is Average Track Quality Index. These KPI Powerpoint graphics are all data driven, and the shape automatically adjusts according to your data. Just right click on the KPI graphic, enter the right value and the shape will adjust automatically. Make a visual impact with our KPI slides.
-
 Average Quality In Powerpoint And Google Slides Cpb
Presenting Average Quality In Powerpoint And Google Slides Cpb slide which is completely adaptable. The graphics in this PowerPoint slide showcase four stages that will help you succinctly convey the information. In addition, you can alternate the color, font size, font type, and shapes of this PPT layout according to your content. This PPT presentation can be accessed with Google Slides and is available in both standard screen and widescreen aspect ratios. It is also a useful set to elucidate topics like Average Quality. This well-structured design can be downloaded in different formats like PDF, JPG, and PNG. So, without any delay, click on the download button now.


