Powerpoint Templates and Google slides for Analyze Analytics
Save Your Time and attract your audience with our fully editable PPT Templates and Slides.
-
 Marketing Analytics Guide To Measure Analyze And Manage Data Complete Deck
Deliver this complete deck to your team members and other collaborators. Encompassed with stylized slides presenting various concepts, this Marketing Analytics Guide To Measure Analyze And Manage Data Complete Deck is the best tool you can utilize. Personalize its content and graphics to make it unique and thought-provoking. All the sixty five slides are editable and modifiable, so feel free to adjust them to your business setting. The font, color, and other components also come in an editable format making this PPT design the best choice for your next presentation. So, download now.
-
 Analyzing And Implementing HR Analytics In Enterprise Powerpoint Ppt Template Bundles DK MD
If you require a professional template with great design, then this Analyzing And Implementing HR Analytics In Enterprise Powerpoint Ppt Template Bundles DK MD is an ideal fit for you. Deploy it to enthrall your audience and increase your presentation threshold with the right graphics, images, and structure. Portray your ideas and vision using fifteen slides included in this complete deck. This template is suitable for expert discussion meetings presenting your views on the topic. With a variety of slides having the same thematic representation, this template can be regarded as a complete package. It employs some of the best design practices, so everything is well structured. Not only this, it responds to all your needs and requirements by quickly adapting itself to the changes you make. This PPT slideshow is available for immediate download in PNG, JPG, and PDF formats, further enhancing its usability. Grab it by clicking the download button.
-
 Major SEO Metrics Analyzed By Google Analytics Edu Ppt
Presenting Major SEO Metrics analyzed by Google Analytics. These slides are 100 percent made in PowerPoint and are compatible with all screen types and monitors. They also support Google Slides. Premium Customer Support available. Suitable for use by managers, employees, and organizations. These slides are easily customizable. You can edit the color, text, icon, and font size to suit your requirements.
-
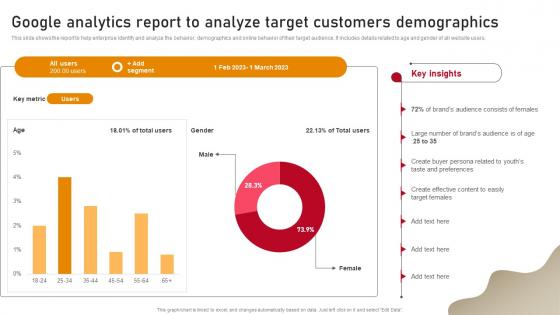 Content Nurturing Strategies Google Analytics Report To Analyze Target Customers Demographics MKT SS
This slide shows the report to help enterprise identify and analyze the behavior, demographics and online behavior of their target audience. It includes details related to age and gender of all website users. Deliver an outstanding presentation on the topic using this Content Nurturing Strategies Google Analytics Report To Analyze Target Customers Demographics MKT SS Dispense information and present a thorough explanation of Content Marketing Manager, Brand Marketing Manager, Senior Designer using the slides given. This template can be altered and personalized to fit your needs. It is also available for immediate download. So grab it now.
-
 Analyzing Dynamics Of Linkedin Update Analytics
This slide highlights the assessment of LinkedIn update analytics. The purpose of this template is to assist managers in optimizing their LinkedIn updates for generating higher engagement rates over a period of time. It includes elements such as post date, impressions along with use case. Introducing our Analyzing Dynamics Of Linkedin Update Analytics set of slides. The topics discussed in these slides are Competitor Benchmarking, Impressions, Update Analytics This is an immediately available PowerPoint presentation that can be conveniently customized. Download it and convince your audience.
-
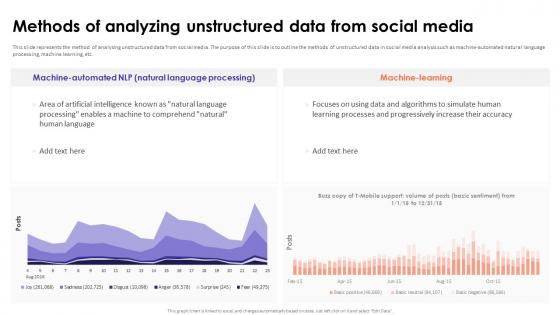 Social Media Analytics With Tools Methods Of Analyzing Unstructured Data From Social Media
This slide represents the method of analysing unstructured data from social media. The purpose of this slide is to outline the methods of unstructured data in social media analysis such as machine-automated natural language processing, machine learning, etc. Present the topic in a bit more detail with this Social Media Analytics With Tools Methods Of Analyzing Unstructured Data From Social Media. Use it as a tool for discussion and navigation on Analyzing Unstructured Data, Social Media, Natural Language Processing. This template is free to edit as deemed fit for your organization. Therefore download it now.
-
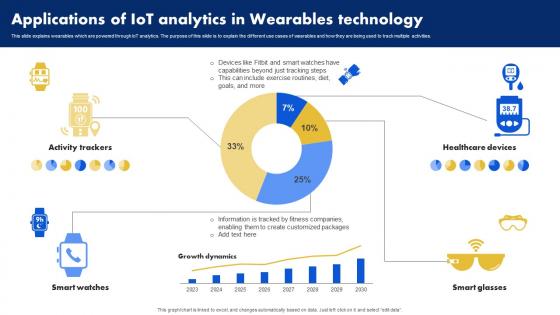 Applications Of IoT Analytics In Wearables Technology Analyzing Data Generated By IoT Devices
This slide explains wearables which are powered through IoT analytics. The purpose of this slide is to explain the different use cases of wearables and how they are being used to track multiple activities. Present the topic in a bit more detail with this Applications Of IoT Analytics In Wearables Technology Analyzing Data Generated By IoT Devices. Use it as a tool for discussion and navigation on Activity Trackers, Smart Watches, Healthcare Devices. This template is free to edit as deemed fit for your organization. Therefore download it now.
-
 IoT Analytics Decision Making System Analyzing Data Generated By IoT Devices
This slide gives an overview of internet of things decision making system. The purpose of this slide is to explain how the incoming data is analyze and goes through decision making system to control and optimize the result. Deliver an outstanding presentation on the topic using this IoT Analytics Decision Making System Analyzing Data Generated By IoT Devices. Dispense information and present a thorough explanation of Analyze, Decision System using the slides given. This template can be altered and personalized to fit your needs. It is also available for immediate download. So grab it now.
-
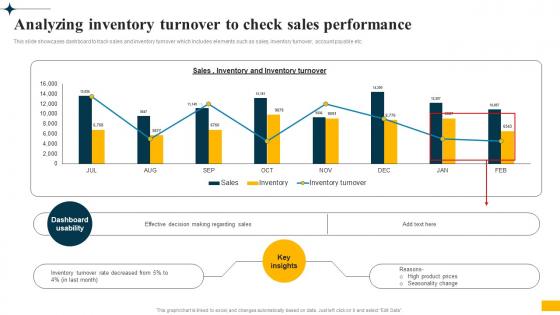 Implementing Big Data Analytics Analyzing Inventory Turnover To Check Sales Performance CRP DK SS
This slide showcases dashboard to track sales and inventory turnover which includes elements such as sales, inventory turnover, account payable etc. Deliver an outstanding presentation on the topic using this Implementing Big Data Analytics Analyzing Inventory Turnover To Check Sales Performance CRP DK SS. Dispense information and present a thorough explanation of Dashboard To Track Sales, Inventory Turnover, Sales Performance, Inventory Turnover Rate using the slides given. This template can be altered and personalized to fit your needs. It is also available for immediate download. So grab it now.
-
 Implementing Big Data Analytics Analyzing Stockout Rate To Identify Loss In Sales CRP DK SS
This slide showcases dashboard to monitor product stockout levels and identify reasons such as ineffective forecasting, late delivery, product quality issues etc. Present the topic in a bit more detail with this Implementing Big Data Analytics Analyzing Stockout Rate To Identify Loss In Sales CRP DK SS. Use it as a tool for discussion and navigation on Dashboard To Monitor Product, Stockout Levels And Identify Reasons, Ineffective Forecasting. This template is free to edit as deemed fit for your organization. Therefore download it now.
-
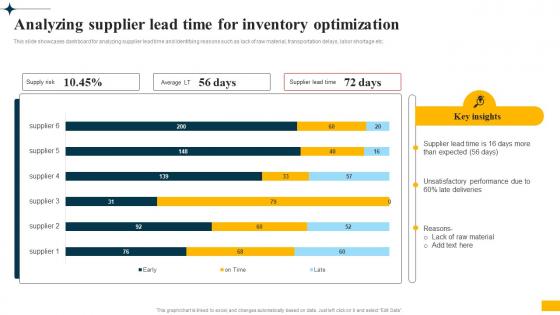 Implementing Big Data Analytics Analyzing Supplier Lead Time For Inventory Optimization CRP DK SS
This slide showcases dashboard for analyzing supplier lead time and identifying reasons such as lack of raw material, transportation delays, labor shortage etc. Deliver an outstanding presentation on the topic using this Implementing Big Data Analytics Analyzing Supplier Lead Time For Inventory Optimization CRP DK SS. Dispense information and present a thorough explanation of Dashboard For Analyzing Supplier, Lack Of Raw Material, Transportation Delays, Labor Shortage using the slides given. This template can be altered and personalized to fit your needs. It is also available for immediate download. So grab it now.
-
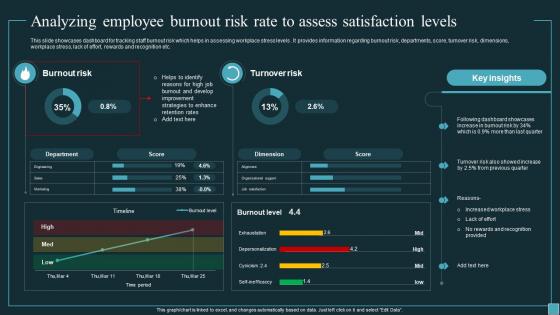 Analyzing Employee Burnout Risk Rate To Assess Implementing Workforce Analytics Data Analytics SS
This slide showcases dashboard for tracking staff burnout risk which helps in assessing workplace stress levels . It provides information regarding burnout risk, departments, score, turnover risk, dimensions, workplace stress, lack of effort, rewards and recognition etc. Present the topic in a bit more detail with this Analyzing Employee Burnout Risk Rate To Assess Implementing Workforce Analytics Data Analytics SS. Use it as a tool for discussion and navigation on Analyzing Employee Burnout Risk Rate, Assess Satisfaction Levels, Rewards And Recognition, Turnover Risk. This template is free to edit as deemed fit for your organization. Therefore download it now.
-
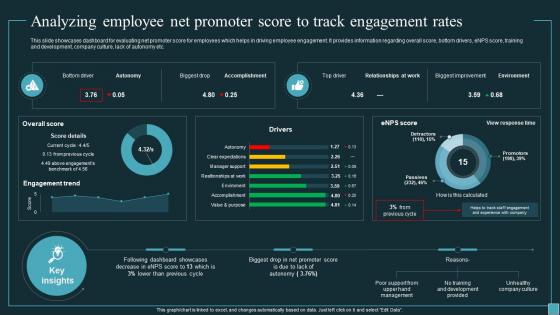 Analyzing Employee Net Promoter Score To Track Implementing Workforce Analytics Data Analytics SS
This slide showcases dashboard for evaluating net promoter score for employees which helps in driving employee engagement. It provides information regarding overall score, bottom drivers, eNPS score, training and development, company culture, lack of autonomy etc. Deliver an outstanding presentation on the topic using this Analyzing Employee Net Promoter Score To Track Implementing Workforce Analytics Data Analytics SS. Dispense information and present a thorough explanation of Analyzing Employee, Net Promoter Score, Track Engagement Rates, Company Culture, Lack Of Autonomy using the slides given. This template can be altered and personalized to fit your needs. It is also available for immediate download. So grab it now.
-
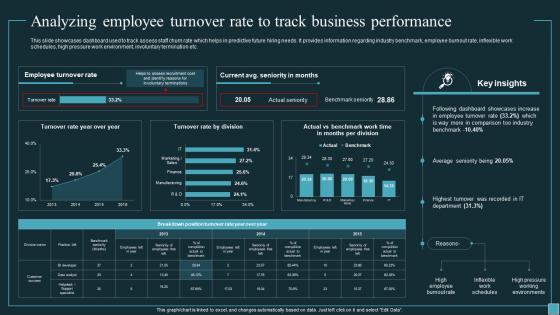 Analyzing Employee Turnover Rate To Track Business Implementing Workforce Analytics Data Analytics SS
This slide showcases dashboard used to track assess staff churn rate which helps in predictive future hiring needs. It provides information regarding industry benchmark, employee burnout rate, inflexible work schedules, high pressure work environment, involuntary termination etc. Present the topic in a bit more detail with this Analyzing Employee Turnover Rate To Track Business Implementing Workforce Analytics Data Analytics SS. Use it as a tool for discussion and navigation on Analyzing Employee Turnover Rate, Track Business Performance, Work Environment, Involuntary Termination. This template is free to edit as deemed fit for your organization. Therefore download it now.
-
 Implementing Workforce Analytics Analyzing Employee Workload For Accurate Data Analytics SS
This slide showcases dashboard which help in tracking employee capacity and utilization levels for staff that helps in assessing workload. It provides information regarding average days overutilized, employee activity, productivity, forecasted billable utilization, productive hours by location etc. Present the topic in a bit more detail with this Implementing Workforce Analytics Analyzing Employee Workload For Accurate Data Analytics SS. Use it as a tool for discussion and navigation on Analyzing Employee Workload, Accurate Resource Allocation, Productivity, Forecasted Billable Utilization. This template is free to edit as deemed fit for your organization. Therefore download it now.
-
 Implementing Workforce Analytics Analyzing Staff Absenteeism Rate To Evaluate Quality Data Analytics SS
This slide showcases dashboard for assessing workplace absenteeism rate which helps in reducing cost of absence and improve business productivity. It provides information regarding absenteeism rate, total unproductive hours, sick days, cost of sick leaves etc. Deliver an outstanding presentation on the topic using this Implementing Workforce Analytics Analyzing Staff Absenteeism Rate To Evaluate Quality Data Analytics SS. Dispense information and present a thorough explanation of Analyzing Staff Absenteeism Rate, Evaluate Quality Of Work, Sick Days, Cost Of Sick Leaves using the slides given. This template can be altered and personalized to fit your needs. It is also available for immediate download. So grab it now.
-
 Implementing Workforce Analytics Analyzing Staff Capacity For Improve Headcount Data Analytics SS
This slide showcases dashboard for tracking employee utilization capacity which helps in effective workforce planning and headcount allocation. It provides information regarding average productive hours, employee work habits, teams, targeted goal, under staffing, employee turnover etc. Present the topic in a bit more detail with this Implementing Workforce Analytics Analyzing Staff Capacity For Improve Headcount Data Analytics SS. Use it as a tool for discussion and navigation on Analyzing Staff Capacity, Improve Headcount Planning, Employee Turnover. This template is free to edit as deemed fit for your organization. Therefore download it now.
-
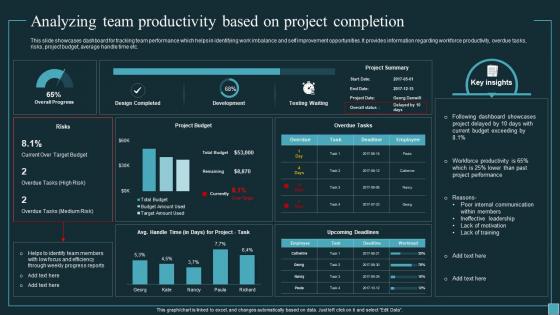 Implementing Workforce Analytics Analyzing Team Productivity Based On Project Data Analytics SS
This slide showcases dashboard for tracking team performance which helps in identifying work imbalance and self improvement opportunities. It provides information regarding workforce productivity, overdue tasks, risks, project budget, average handle time etc. Deliver an outstanding presentation on the topic using this Implementing Workforce Analytics Analyzing Team Productivity Based On Project Data Analytics SS. Dispense information and present a thorough explanation of Analyzing Team Productivity, Project Completion, Risks, Project Budget using the slides given. This template can be altered and personalized to fit your needs. It is also available for immediate download. So grab it now.
-
 Implementing Workforce Analytics Analyzing Workforce Productivity To Identify Data Analytics SS
This slide provides dashboard for tracking employee productivity hours which helps in effective identification of performance gaps and improve problem solving. It provides information regarding lack of staff training, toxic work culture, work overload, uninterrupted work, efficiency etc. Present the topic in a bit more detail with this Implementing Workforce Analytics Analyzing Workforce Productivity To Identify Data Analytics SS. Use it as a tool for discussion and navigation on Tracking Employee Productivity, Performance Gaps, Lack Of Staff Training, Toxic Work Culture. This template is free to edit as deemed fit for your organization. Therefore download it now.
-
 Analyzing Patient Churn Rate To Track Definitive Guide To Implement Data Analytics SS
This slide showcases dashboard for assessing patient turnover rate which helps in improving patient engagement. It provides information regarding bed occupancy rate, average cost per patient, staff to patient ratio, existing patients, number of beds etc. Present the topic in a bit more detail with this Analyzing Patient Churn Rate To Track Definitive Guide To Implement Data Analytics SS. Use it as a tool for discussion and navigation on Occupancy, Opportunity, Organizations, Dashboard. This template is free to edit as deemed fit for your organization. Therefore download it now.
-
 Analyzing Patient Satisfaction Score To Track Definitive Guide To Implement Data Analytics SS
This slide showcases dashboard to track patient engagement rates during treatment and follow up care sessions. It includes elements such as average length of stay, lab tests, patient satisfaction, long wait times, treatment instructions etc. Present the topic in a bit more detail with this Analyzing Patient Satisfaction Score To Track Definitive Guide To Implement Data Analytics SS. Use it as a tool for discussion and navigation on Patients Metrics, Ineffective Communication, Dashboard. This template is free to edit as deemed fit for your organization. Therefore download it now.
-
 Analyzing Patient Survey Response Rate Definitive Guide To Implement Data Analytics SS
This slide showcases dashboard for tracking survey completion rate in hospitals which helps in analyzing patient satisfaction . It includes elements such as poor physician care, low health literacy, complex survey questions etc. Present the topic in a bit more detail with this Analyzing Patient Survey Response Rate Definitive Guide To Implement Data Analytics SS. Use it as a tool for discussion and navigation on Surveys Conducted, Incomplete Responses, Questionnaire Collectors, Responses Collected. This template is free to edit as deemed fit for your organization. Therefore download it now.
-
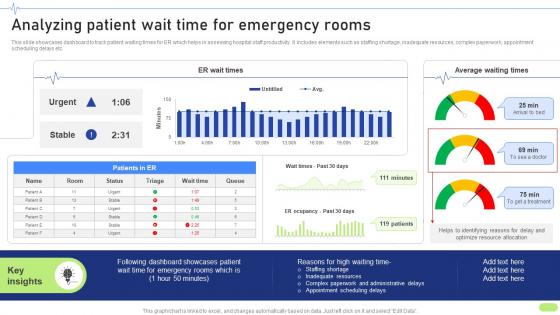 Analyzing Patient Wait Time For Definitive Guide To Implement Data Analytics SS
This slide showcases dashboard to track patient waiting times for ER which helps in assessing hospital staff productivity. It includes elements such as staffing shortage, inadequate resources, complex paperwork, appointment scheduling delays etc. Present the topic in a bit more detail with this Analyzing Patient Wait Time For Definitive Guide To Implement Data Analytics SS. Use it as a tool for discussion and navigation on Dashboard Showcases, Inadequate Resources, Administrative Delays. This template is free to edit as deemed fit for your organization. Therefore download it now.
-
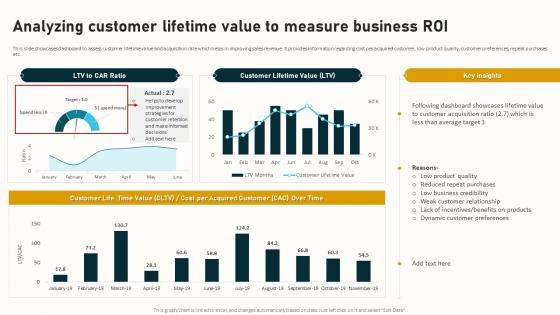 Analyzing Customer Lifetime Value To Measure Complete Guide To Business Analytics Data Analytics SS
This slide showcases dashboard to assess customer lifetime value and acquisition rate which helps in improving sales revenue. It provides information regarding cost per acquired customer, low product quality, customer preferences, repeat purchases etc. Present the topic in a bit more detail with this Analyzing Customer Lifetime Value To Measure Complete Guide To Business Analytics Data Analytics SS. Use it as a tool for discussion and navigation on Analyzing Customer Lifetime, Value To Measure Business, Customer Preferences, Repeat Purchases. This template is free to edit as deemed fit for your organization. Therefore download it now.
-
 Analyzing Business Reach On Various Social Leveraging Digital Analytics To Develop Data Analytics SS
This slide showcases assessment of business reach on Facebook and Instagram channels which helps in tracking customer engagement and brand awareness. It provides information regarding profit visits, reach, lack of connection, marketing campaign, active users etc. Present the topic in a bit more detail with this Analyzing Business Reach On Various Social Leveraging Digital Analytics To Develop Data Analytics SS. Use it as a tool for discussion and navigation on Instagram Profile Visits, Page And Profile Visits, Instagram Reach. This template is free to edit as deemed fit for your organization. Therefore download it now.
-
 Analyzing Current Visibility Of SEO Keywords Leveraging Digital Analytics To Develop Data Analytics SS
This slide showcases dashboard illustrating search visibility of SEO keywords used on website which helps in identifying performance gaps. It provides information regarding keyword visibility, estimated traffic, purchase conversion rates, average positions, improved vs declined keywords etc. Deliver an outstanding presentation on the topic using this Analyzing Current Visibility Of SEO Keywords Leveraging Digital Analytics To Develop Data Analytics SS. Dispense information and present a thorough explanation of Ranking Distribution, Purchase Rate Conversions, Average Position using the slides given. This template can be altered and personalized to fit your needs. It is also available for immediate download. So grab it now.
-
 Analyzing Customer Bounce Rate For Business Leveraging Digital Analytics To Develop Data Analytics SS
This slide showcases dashboard used to track visitor bounce rate on website which helps in identifying non profitable traffic sources. It provides information regarding KPI metrics such as channels, sessions, new users, bounce rate, pageviews, average session duration etc. Present the topic in a bit more detail with this Analyzing Customer Bounce Rate For Business Leveraging Digital Analytics To Develop Data Analytics SS. Use it as a tool for discussion and navigation on Analyzing Customer Bounce Rate, Business Website. This template is free to edit as deemed fit for your organization. Therefore download it now.
-
 Analyzing Organic Search Traffic And Website Leveraging Digital Analytics To Develop Data Analytics SS
This slide showcases assessment of business website health and estimating visitors from organic search which helps in identifying improvement areas. It provides information sessions, total users, site health, errors, notices, warnings, crawled pages etc. Deliver an outstanding presentation on the topic using this Analyzing Organic Search Traffic And Website Leveraging Digital Analytics To Develop Data Analytics SS. Dispense information and present a thorough explanation of Analyzing Organic Search Traffic, Website Health using the slides given. This template can be altered and personalized to fit your needs. It is also available for immediate download. So grab it now.
-
 Analyzing Social Media Posts Impressions Leveraging Digital Analytics To Develop Data Analytics SS
This slide showcases dashboard which helps in analyzing post impressions of various social media channels. It provides a information regarding KPI metrics such as impressions, engagement, post clicks, audience growth rate, conversions value etc. Present the topic in a bit more detail with this Analyzing Social Media Posts Impressions Leveraging Digital Analytics To Develop Data Analytics SS. Use it as a tool for discussion and navigation on Audience Growth, Conversion Value, Cost Per Click. This template is free to edit as deemed fit for your organization. Therefore download it now.
-
 Analyzing Total Pages Per Session For Media Leveraging Digital Analytics To Develop Data Analytics SS
This slide showcases dashboard which is used by business to assess pages viewed by customer per visit . It provides information regarding KPI metrics such as sessions, users, pageviews, bounce rate, website content, website loading time, low quality traffic etc. Deliver an outstanding presentation on the topic using this Analyzing Total Pages Per Session For Media Leveraging Digital Analytics To Develop Data Analytics SS. Dispense information and present a thorough explanation of Analyzing Total Pages, Session For Media Website using the slides given. This template can be altered and personalized to fit your needs. It is also available for immediate download. So grab it now.
-
 Dashboard To Analyze Customer Churn In Implementing Data Analytics To Enhance Telecom Data Analytics SS
This slide showcases dashboard for tracking customer attrition rate in telecom business and identify reasons for high churn. It provides information regarding dashboard usability, churn rate by gender, by city, phone vs internet service, business revenue, customer journey etc. Deliver an outstanding presentation on the topic using this Dashboard To Analyze Customer Churn In Implementing Data Analytics To Enhance Telecom Data Analytics SS. Dispense information and present a thorough explanation of Key Insights, Dashboard Usability, Churn Customers using the slides given. This template can be altered and personalized to fit your needs. It is also available for immediate download. So grab it now.
-
 Analyzing Marketing Attribution Marketing Analytics Software For Effective Data Tracking
This slide showcases comparison of marketing data analytics and dashboard software tools which helps in effective data reporting. It provides information regarding software, features, price, free trail and user ratings. Present the topic in a bit more detail with this Analyzing Marketing Attribution Marketing Analytics Software For Effective Data Tracking Use it as a tool for discussion and navigation on Data Platform Inputs, Consumer Attributes, Marketing Touchpoints This template is free to edit as deemed fit for your organization. Therefore download it now.
-
 Analyzing Marketing Attribution Marketing Attribution Software For Accurate Reporting And Analytics
This slide highlights comparison between various tools used for marketing attribution which helps in analyzing customer journey and accurate reporting. It provides information regarding software, features, price, market segment, free trial and user ratings. Present the topic in a bit more detail with this Analyzing Marketing Attribution Marketing Attribution Software For Accurate Reporting And Analytics Use it as a tool for discussion and navigation on Tracked Organic Visits, All Organic Visits, Top 3 Keywords This template is free to edit as deemed fit for your organization. Therefore download it now.
-
 Applications Of IOT Working Of Aws IOT Analytics To Analyze Data Volume IOT SS
This slide provides an overview of the IoT analytics working to evaluate the amount of data collected. The architecture includes data collection, processing, storage, analysis and building. Deliver an outstanding presentation on the topic using this Applications Of IOT Working Of Aws IOT Analytics To Analyze Data Volume IOT SS Dispense information and present a thorough explanation of Collect, Process, Analyze, Build using the slides given. This template can be altered and personalized to fit your needs. It is also available for immediate download. So grab it now.
-
 Comparative Analysis Of Software For Analyzing Text Analytics
This slide showcases different software for text analysis. The main purpose of this slide is analysing text using different software for driving insights. This includes Software1, software-2,etc.Introducing our Comparative Analysis Of Software For Analyzing Text Analytics set of slides. The topics discussed in these slides are Programme Combines, Rules Based, Reasoning Learning Technique. This is an immediately available PowerPoint presentation that can be conveniently customized. Download it and convince your audience.
-
 Linkedin Analytics Icon For Analyzing Company Page Performance
Introducing our premium set of slides with Linkedin Analytics Icon For Analyzing Company Page Performance Ellicudate the Three stages and present information using this PPT slide. This is a completely adaptable PowerPoint template design that can be used to interpret topics like Linkedin Analytics Icon For Analyzing, Company Page Performance. So download instantly and tailor it with your information.
-
 About Descriptive Data Analytics Technique Analyzing Data Generated By IoT Devices
This slide gives an overview of descriptive data analytics and how it can be used to analyze data. The purpose of this slide is to include information on various techniques used in descriptive analytics, such as data visualization, data aggregation, and data mining. Introducing About Descriptive Data Analytics Technique Analyzing Data Generated By IoT Devices to increase your presentation threshold. Encompassed with two stages, this template is a great option to educate and entice your audience. Dispence information on Descriptive, Working, using this template. Grab it now to reap its full benefits.
-
 Applications Of IoT Analytics In Agriculture Sector Analyzing Data Generated By IoT Devices
This slide shows application of IoT data analytics in agriculture sector. The purpose of this slide is to explain how IoT analytics will manage soil, livestock, etc. It also elaborates the use of drones and precision farming. Increase audience engagement and knowledge by dispensing information using Applications Of IoT Analytics In Agriculture Sector Analyzing Data Generated By IoT Devices. This template helps you present information on five stages. You can also present information on Drones, Soil Management, Livestock Management using this PPT design. This layout is completely editable so personaize it now to meet your audiences expectations.
-
 Applications Of IoT Analytics In Healthcare Industry Analyzing Data Generated By IoT Devices
This slide shows how healthcare industry is powered through IoT analytics. The purpose of this slide is to elaborate the uses of smart devices such as smart preventive medicine, smart visibility, etc. in healthcare. Introducing Applications Of IoT Analytics In Healthcare Industry Analyzing Data Generated By IoT Devices to increase your presentation threshold. Encompassed with four stages, this template is a great option to educate and entice your audience. Dispence information on Smart Preventative Medicine, Smart Hospital Management, Smart Visibility, using this template. Grab it now to reap its full benefits.
-
 Applications Of IoT Analytics In Industry 40 Analyzing Data Generated By IoT Devices
This slide shows application of IoT data analytics in industry 4.0 sector. The purpose of this slide is to give an idea about how IoT data analytics can improve industrial machinery control and monitoring and optimize data driven production line. Increase audience engagement and knowledge by dispensing information using Applications Of IoT Analytics In Industry 40 Analyzing Data Generated By IoT Devices. This template helps you present information on three stages. You can also present information on Industrial Machinery, Data Driven Production using this PPT design. This layout is completely editable so personaize it now to meet your audiences expectations.
-
 Applications Of IoT Analytics In Real Estate Analyzing Data Generated By IoT Devices
This slide shows application of IoT data analytics in real-estate sector. The purpose of this slide is to show how IoT devices can help in controlling smart devices and increase effectiveness of smart buildings. Introducing Applications Of IoT Analytics In Real Estate Analyzing Data Generated By IoT Devices to increase your presentation threshold. Encompassed with three stages, this template is a great option to educate and entice your audience. Dispence information on Controlling Smart Devices, Increasing Effectiveness, using this template. Grab it now to reap its full benefits.
-
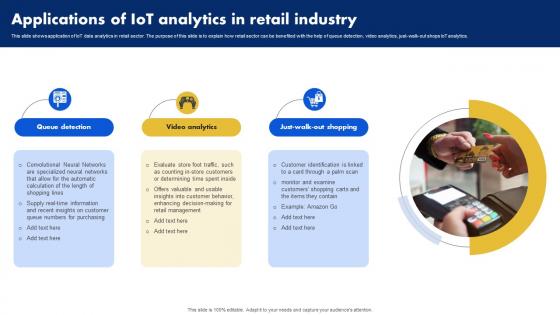 Applications Of IoT Analytics In Retail Industry Analyzing Data Generated By IoT Devices
This slide shows application of IoT data analytics in retail sector. The purpose of this slide is to explain how retail sector can be benefited with the help of queue detection, video analytics, just-walk-out shops IoT analytics. Increase audience engagement and knowledge by dispensing information using Applications Of IoT Analytics In Retail Industry Analyzing Data Generated By IoT Devices. This template helps you present information on three stages. You can also present information on Queue Detection, Video Analytics, Just Walk Out Shopping using this PPT design. This layout is completely editable so personaize it now to meet your audiences expectations.
-
 Applications Of IoT Analytics In Smart Cities Analyzing Data Generated By IoT Devices
This slide shows application of IoT data analytics in Smart cities sector. The purpose of this slide is to gives an idea about the solution that can be provided via IoT analytics such as traffic management, smart parking, etc. Introducing Applications Of IoT Analytics In Smart Cities Analyzing Data Generated By IoT Devices to increase your presentation threshold. Encompassed with three stages, this template is a great option to educate and entice your audience. Dispence information on Smart Solutions, Traffic And Energy Management, Energy Management, using this template. Grab it now to reap its full benefits.
-
 Applications Of IoT Analytics In Smart Home Analyzing Data Generated By IoT Devices
This slide explains smart home which are powered through IoT analytics. The purpose of this slide is to give a basic idea about how IoT analytics helps the appliances, gadgets, switches, etc. to behave smartly. Present the topic in a bit more detail with this Applications Of IoT Analytics In Smart Home Analyzing Data Generated By IoT Devices. Use it as a tool for discussion and navigation on Controlled Appliances, Controlled Irrigations, Lighting Control. This template is free to edit as deemed fit for your organization. Therefore download it now.
-
 Applications Of IoT Analytics In Voice Activated Everything Analyzing Data Generated By IoT Devices
This slide tells how voice-activated devices uses IoT analytics to assist in variety of tasks. The purpose of this slide is to give an idea about the activities that are performed by voice-activated devices like siri, alexa, etc. Deliver an outstanding presentation on the topic using this Applications Of IoT Analytics In Voice Activated Everything Analyzing Data Generated By IoT Devices. Dispense information and present a thorough explanation of Applications Of Iot Analytics, Voice Activated Everything using the slides given. This template can be altered and personalized to fit your needs. It is also available for immediate download. So grab it now.
-
 Business Benefits Of IoT Analytics Analyzing Data Generated By IoT Devices
This slide gives benefits of using IoT analytics in business. The purpose of this slide is to explain how IoT analytics can help in optimizing operational efficiency, reducing cost, enhancing customer experience, improving safety, etc. Introducing Business Benefits Of IoT Analytics Analyzing Data Generated By IoT Devices to increase your presentation threshold. Encompassed with five stages, this template is a great option to educate and entice your audience. Dispence information on Optimizing Operational Efficiency, Reducing Costs, Enhancing Customer Experience, using this template. Grab it now to reap its full benefits.
-
 Business Use Cases Of IoT Analytics Analyzing Data Generated By IoT Devices
This slide gives business use cases of IoT analytics. The purpose of this slide is to explain how IoT analytics can improve business by regular restocking, predictive maintenance, process efficiency, etc. Increase audience engagement and knowledge by dispensing information using Business Use Cases Of IoT Analytics Analyzing Data Generated By IoT Devices. This template helps you present information on four stages. You can also present information on Regular Restocking Of Supplies, Predictive Maintenance, Process Efficiency Scoring using this PPT design. This layout is completely editable so personaize it now to meet your audiences expectations.
-
 Checklist For Implementing IoT Analytics Analyzing Data Generated By IoT Devices
This slide describes the checklist for implementing IoT analytics into an organization efficiently. The purpose of this slide is to give step by step instruction there outcomes and the person in charge of the process. Present the topic in a bit more detail with this Checklist For Implementing IoT Analytics Analyzing Data Generated By IoT Devices. Use it as a tool for discussion and navigation on Outcomes, Person In Charge, Status. This template is free to edit as deemed fit for your organization. Therefore download it now.
-
 Data Flow Diagram Of IoT Analytics In Healthcare Industry Analyzing Data Generated By IoT Devices
This slide shows application of IoT data analytics in healthcare sector. The purpose of this slide is to explain how IoT devices such as wearable can be used to analyze the data and provide useful suggestion. Deliver an outstanding presentation on the topic using this Data Flow Diagram Of IoT Analytics In Healthcare Industry Analyzing Data Generated By IoT Devices. Dispense information and present a thorough explanation of Smart Phone, Suggestion By Doctor, Doctor using the slides given. This template can be altered and personalized to fit your needs. It is also available for immediate download. So grab it now.
-
 Different Types Of IoT Data Analytics Analyzing Data Generated By IoT Devices
This slide highlight different types of IoT data analytics. The purpose of this slide is to graphically differentiate between four types of analytics which are descriptive, diagnostic, predictive and prescriptive. Present the topic in a bit more detail with this Different Types Of IoT Data Analytics Analyzing Data Generated By IoT Devices. Use it as a tool for discussion and navigation on Prescriptive, Predictive, Diagnostic. This template is free to edit as deemed fit for your organization. Therefore download it now.
-
 Effective 30 60 90 Day Plan For IoT Data Analytics Analyzing Data Generated By IoT Devices
This slide represents the 30-60-90 day plan for integrating data analytics. Purpose of this slide is to include plans of first 90 days from the start of the project, including the steps to be followed at interval of one month. Introducing Effective 30 60 90 Day Plan For IoT Data Analytics Analyzing Data Generated By IoT Devices to increase your presentation threshold. Encompassed with three stages, this template is a great option to educate and entice your audience. Dispence information on Determine The Use Cases, Data Storage, Data Visualization, using this template. Grab it now to reap its full benefits.
-
 How IoT Analytics Is Different Form Others Analyzing Data Generated By IoT Devices
This slide describe distinguishing features of IoT analytics compared to other types of analytics. The purpose of this slide is to differentiate IoT analytics from other type of analytics on the basics of data, complexity and automation. Increase audience engagement and knowledge by dispensing information using How IoT Analytics Is Different Form Others Analyzing Data Generated By IoT Devices. This template helps you present information on six stages. You can also present information on More Data, More Complexity, More Automation using this PPT design. This layout is completely editable so personaize it now to meet your audiences expectations.
-
 Internet Of Things Analytics Key Requirements Analyzing Data Generated By IoT Devices
This slide gives an overview of different key requirements for IoT analytics. The purpose of this slide is to show how different hardware make noticeable changes in time taken by IoT data analytics. Increase audience engagement and knowledge by dispensing information using Internet Of Things Analytics Key Requirements Analyzing Data Generated By IoT Devices. This template helps you present information on four stages. You can also present information on Speed, Storage, Processing using this PPT design. This layout is completely editable so personaize it now to meet your audiences expectations.
-
 Introduction To Predictive Data Analytics Technique Analyzing Data Generated By IoT Devices
This slide provides an overview and explanation of how predictive data analytics works, including the use of statistical modeling and analysis of historical and current data to make predictions about future outcomes. Present the topic in a bit more detail with this Introduction To Predictive Data Analytics Technique Analyzing Data Generated By IoT Devices. Use it as a tool for discussion and navigation on Introduction To Predictive, Data Analytics Technique Analyzing. This template is free to edit as deemed fit for your organization. Therefore download it now.
-
 IoT Analytics Hindsight Insight And Foresight Analyzing Data Generated By IoT Devices
This slide outlines Hindsight, Insight, and Foresight of internet of things data analytics. The purpose of this slide is to answer the three questions to know what happened, to understand what happened, and to predict what will happen. Introducing IoT Analytics Hindsight Insight And Foresight Analyzing Data Generated By IoT Devices to increase your presentation threshold. Encompassed with two stages, this template is a great option to educate and entice your audience. Dispence information on Hindsight, Insight And Foresight, using this template. Grab it now to reap its full benefits.
-
 Key Requirements For IoT Analytics Speed Analyzing Data Generated By IoT Devices
This slide outlines one of the key requirement of IoT analytics which is speed. The purpose of this slide is to give an idea about how data can be processed in few hours, few seconds and few milliseconds. Present the topic in a bit more detail with this Key Requirements For IoT Analytics Speed Analyzing Data Generated By IoT Devices. Use it as a tool for discussion and navigation on Few Hours, Few Seconds, Few Milliseconds. This template is free to edit as deemed fit for your organization. Therefore download it now.
-
 Key Requirements For IoT Analytics Storage Analyzing Data Generated By IoT Devices
This slide outlines two of the key requirement of IoT analytics which are storage and processing. The purpose of this slide is to explains where data is stored and how processing is conducted over servers. Introducing Key Requirements For IoT Analytics Storage Analyzing Data Generated By IoT Devices to increase your presentation threshold. Encompassed with four stages, this template is a great option to educate and entice your audience. Dispence information on Data Lake, Discard Data, Retain A Processed, using this template. Grab it now to reap its full benefits.
-
 Overview Of Diagnostic Data Analytics Technique Analyzing Data Generated By IoT Devices
This slide discusses an overview of diagnostic data analytics technique. The purpose of this slide is to provide an explanation of the diagnostic data analytics technique and its general approach for analyzing data to identify the root causes of problems or issues. Increase audience engagement and knowledge by dispensing information using Overview Of Diagnostic Data Analytics Technique Analyzing Data Generated By IoT Devices. This template helps you present information on three stages. You can also present information on Data Drilling, Data Mining, Correlation Analysis using this PPT design. This layout is completely editable so personaize it now to meet your audiences expectations.
-
 Overview Of Internet Of Things Data Analytics Analyzing Data Generated By IoT Devices
This slide gives an overview of internet of things data analytics. The purpose of this slide is to give an detailed explanation about the sensors, cloud event server, how vast amount of data is processed in real time, etc. Present the topic in a bit more detail with this Overview Of Internet Of Things Data Analytics Analyzing Data Generated By IoT Devices. Use it as a tool for discussion and navigation on External Data, Social Data, Message Bus. This template is free to edit as deemed fit for your organization. Therefore download it now.
-
 Overview Of The Prescriptive Data Analytics Approach Analyzing Data Generated By IoT Devices
This slide provides an explanation and summary of how the prescriptive data analytics technique operates and functions. It offers an overview of the approach and its working methodology. Increase audience engagement and knowledge by dispensing information using Overview Of The Prescriptive Data Analytics Approach Analyzing Data Generated By IoT Devices. This template helps you present information on four stages. You can also present information on Current And Historical Data, Additional Data, Predictive Analytics using this PPT design. This layout is completely editable so personaize it now to meet your audiences expectations.


