Powerpoint Templates and Google slides for Analytical Data
Save Your Time and attract your audience with our fully editable PPT Templates and Slides.
-
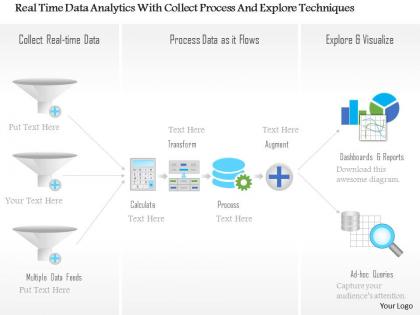 Real time data analytics with collect process and explore techniques ppt slides
They are capable of providing up-to-date information about the enterprise. Better and quicker business decisions can be made using these layouts. Helps in forming a well organised business system. Compatible with Google slides. Modifiable by following simple instructions that come pre-defined with these PPT presentation Patterns.The stages in this process are networking, storage, big data analytics.
-
 Data processing analytics environment sensing ppt example
Presenting data processing analytics environment sensing ppt example. This is a data processing analytics environment sensing ppt example. This is a five stage process. The stages in this process are data processing analytics, environment sensing, process monitoring analytics, process analytics, process composition enactment update.
-
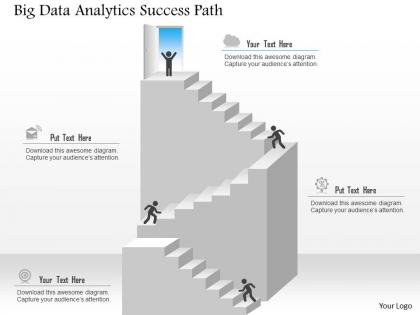 Big data analytics success path ppt slides
Presenting big data analytics success path ppt slides. This is a big data analytics success path ppt slides. This is a four stage process. The stages in this process are big data analytics.
-
 Data analytics data search technology ppt slides
PPT slides are entirely compatible with Google slides. Standard and widescreen view display options available. 100% editable PowerPoint template design to enable customization. Simple to convert into JPEG and PDF document. Downloading is easy and can be insert in your presentation. Useful for every small and large scale organization. The stages in this process are big data analytics.
-
 Business data analytics process presentation graphics
Presenting business data analytics process presentation graphics. This is a business data analytics process presentation graphics. This is a four stage process. The stages in this process are decision, insight, data, info.
-
 Small data vs big data analytics ppt examples professional
Presenting small data vs big data analytics ppt examples professional. This is a small data vs big data analytics ppt examples professional. This is a two stage process. The stages in this process are small data, low volumes, batch velocities, structured varieties, big data, into petabyte volumes, real time velocities, multistructured varieties, vs.
-
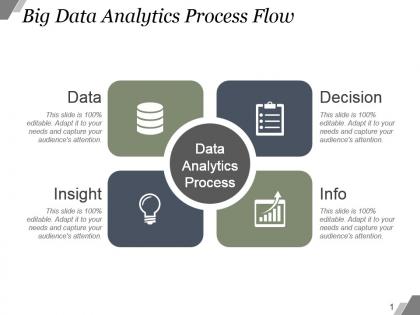 Big data analytics process flow example of ppt presentation
Presenting big data analytics process flow example of ppt presentation. This is a big data analytics process flow example of ppt presentation. This is a four stage process. The stages in this process are data, insight, data analytics process, decision.
-
 Data analytics lifecycle phases powerpoint slide background designs
Presenting data analytics lifecycle phases powerpoint slide background designs. This is a data analytics lifecycle phases powerpoint slide background designs. This is a four stage process. The stages in this process are deposit, discover, design, decide.
-
 Social media analytics market data powerpoint slide images
Presenting social media analytics market data powerpoint slide images. This is a social media analytics market data powerpoint slide images. This is a eight stage process. The stages in this process are million, megabytes, hours, petabytes, items, exabytes.
-
 Data analytics and planning powerpoint slide ideas
Presenting data analytics and planning powerpoint slide ideas. This is a data analytics and planning powerpoint slide ideas. This is a one stage process. The stages in this process are analytics driven continuous risk assessment, dynamic audit planning, audit scoping and planning, audit execution, enhanced reporting, challenges.
-
 Data analytics application powerpoint presentation examples
Presenting data analytics application powerpoint presentation examples. This is a data analytics application powerpoint presentation examples. This is a one stage process. The stages in this process are build data pipeline, data integration, communicate results, data analytics application.
-
 Big data analytics marketing impact ppt examples
Presenting big data analytics marketing impact ppt examples. This is a big data analytics marketing impact ppt examples. This is a four stage process. The stages in this process are healthcare, science, security, business.
-
 Data analytics process circular diagrams ppt slides
Presenting data analytics process circular diagrams ppt slides. This is a data analytics process circular diagrams ppt slides. This is a four stage process. The stages in this process are data analytics process, data, insight, decision, info.
-
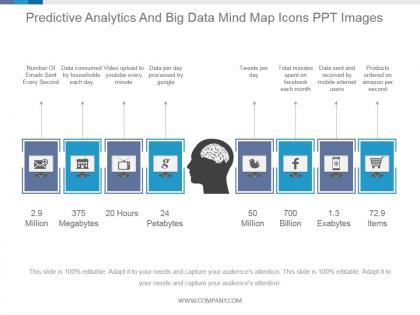 Predictive analytics and big data mind map icons ppt images
Presenting predictive analytics and big data mind map icons ppt images. This is a predictive analytics and big data mind map icons ppt images. This is a eight stage process. The stages in this process are million, megabytes, hours, petabytes, billion, exabytes, items.
-
 Social impact of data analytics powerpoint images
Presenting social impact of data analytics powerpoint images. This is a social impact of data analytics powerpoint images. This is a six stage process. The stages in this process are how is big data, sports predictions, easier commutes, smartphones, personalized advertising, presidential campaigns, advanced healthcare.
-
 Big data analytics market research powerpoint presentation
Presenting big data analytics market research powerpoint presentation. This is a big data analytics market research powerpoint presentation. This is a five stage process. The stages in this process are analyzing customer behavior, combining multiple data sources, improving customer service, generate additional revenue, be more responsive to the market.
-
 Big data analytics workflow funnel powerpoint shapes
Presenting big data analytics workflow funnel powerpoint shapes. This is a big data analytics workflow funnel powerpoint shapes. This is a one stage process. The stages in this process are database, location, social, images, sensor data, email, click stream, html, big data, actionable intelligence.
-
 Big data and social media analytics powerpoint layout
Presenting big data and social media analytics powerpoint layout. This is a big data and social media analytics powerpoint layout. This is a eight stage process. The stages in this process are million, megabytes, hours, petabytes, billion, exabytes, items.
-
 Four data analytics processing functions powerpoint slides
Presenting four data analytics processing functions powerpoint slides. This is a four data analytics processing functions powerpoint slides. This is a four stage process. The stages in this process are data, info, insight, decision.
-
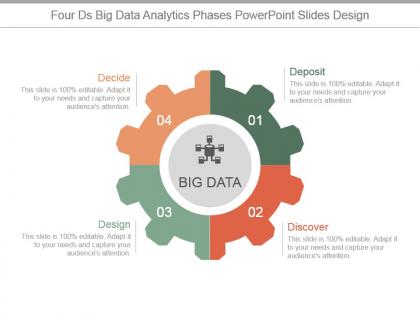 Four ds big data analytics phases powerpoint slides design
Presenting four ds big data analytics phases powerpoint slides design. This is a four ds big data analytics phases powerpoint slides design. This is a four stage process. The stages in this process are deposit, discover, design, decide.
-
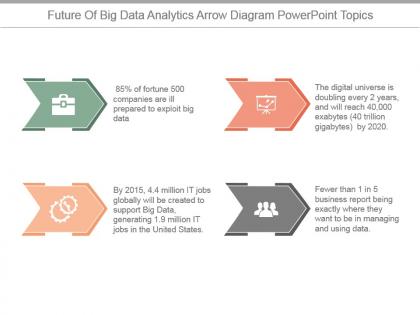 Future of big data analytics arrow diagram powerpoint topics
Presenting future of big data analytics arrow diagram powerpoint topics. This is a future of big data analytics arrow diagram powerpoint topics. This is a four stage process. The stages in this process are arrow, icons, marketing, strategy, business, success.
-
 Big data analytics sample of ppt
Presenting big data analytics sample of PPT slideshow. This presentation slide offers you plenty of space to put in titles and subtitles. High resolution based presentation layout, does not change the image even after resizing. This presentation slide is fully compatible with Google Slides. Quick downloading speed and simple editing options in color text and fonts.PPT template can easily be changed into JPEG and PDF applications. This diagram has been designed for entrepreneurs, corporate and business managers.
-
 Big data analytics maturity model example of ppt
Presenting big data analytics maturity model PPT design. This is the high resolution PPT template giving an astounding Presentation experience to its audiences. The Presentation design, contents, themes, symbols can be customized according to your presentation requirement. The PPT graphic can be diversified into divergent file configurations like PDF or JPG etc. These are quite handy for the business experts, managers, and also for the management students. This is also compatible with the Google Slides.
-
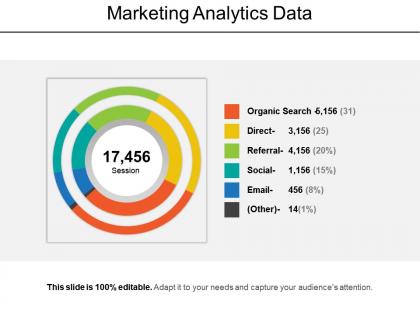 Marketing analytics data powerpoint slide deck samples
Presenting Marketing Analytics Data Powerpoint Slide Deck Samples. Get this fully customizable slide in which you are free to make any changes. You can change the colors, the font type, and the font size as well. Reshape the icon as per your requirement and save this in various formats including JPG and PDF. This is compatible with Google Slides and can be linked to an Excel sheet. Download this now in standard screen and widescreen.
-
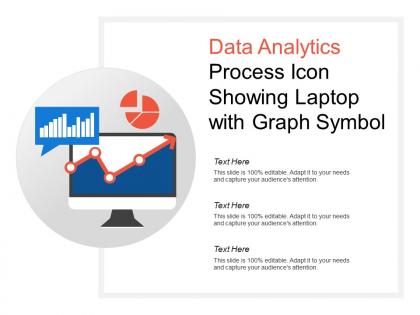 Data analytics process icon showing laptop with graph symbol
Presenting this set of slides with name - Data Analytics Process Icon Showing Laptop With Graph Symbol. This is a three stage process. The stages in this process are Data Analytics Process, Data Analysis Cycle, Data Visualization Process.
-
 Data analytics process icon showing magnifying glass with graphs
Presenting this set of slides with name - Data Analytics Process Icon Showing Magnifying Glass With Graphs. This is a two stage process. The stages in this process are Data Analytics Process, Data Analysis Cycle, Data Visualization Process.
-
 Data analytics process icon showing magnifying glass with pie chart
Presenting this set of slides with name - Data Analytics Process Icon Showing Magnifying Glass With Pie Chart. This is a two stage process. The stages in this process are Data Analytics Process, Data Analysis Cycle, Data Visualization Process.
-
 Data analytics process showing 5 steps define measure improve control
Presenting this set of slides with name - Data Analytics Process Showing 5 Steps Define Measure Improve Control. This is a five stage process. The stages in this process are Data Analytics Process, Data Analysis Cycle, Data Visualization Process.
-
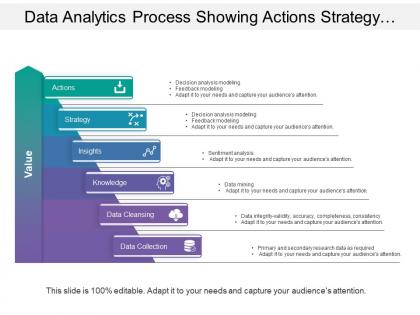 Data analytics process showing actions strategy insights and data collection
Presenting this set of slides with name - Data Analytics Process Showing Actions Strategy Insights And Data Collection. This is a six stage process. The stages in this process are Data Analytics Process, Data Analysis Cycle, Data Visualization Process.
-
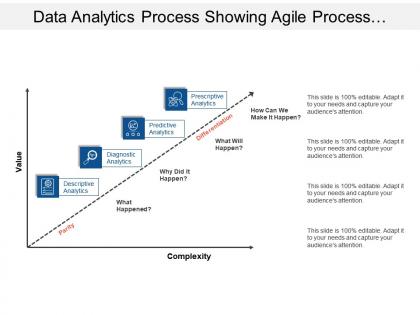 Data analytics process showing agile process with value and complexity
Presenting this set of slides with name - Data Analytics Process Showing Agile Process With Value And Complexity. This is a four stage process. The stages in this process are Data Analytics Process, Data Analysis Cycle, Data Visualization Process.
-
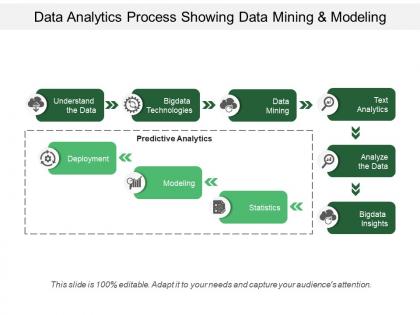 Data analytics process showing data mining and modeling
Presenting this set of slides with name - Data Analytics Process Showing Data Mining And Modeling. This is a nine stage process. The stages in this process are Data Analytics Process, Data Analysis Cycle, Data Visualization Process.
-
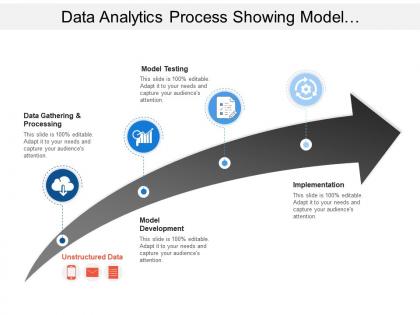 Data analytics process showing model development and implementation
Presenting this set of slides with name - Data Analytics Process Showing Model Development And Implementation. This is a four stage process. The stages in this process are Data Analytics Process, Data Analysis Cycle, Data Visualization Process.
-
 Data analytics process with data collection and report
Presenting this set of slides with name - Data Analytics Process With Data Collection And Report. This is a seven stage process. The stages in this process are Data Analytics Process, Data Analysis Cycle, Data Visualization Process.
-
 Data analytics process with data management and machine learning
Presenting this set of slides with name - Data Analytics Process With Data Management And Machine Learning. This is a five stage process. The stages in this process are Data Analytics Process, Data Analysis Cycle, Data Visualization Process.
-
 Data monitoring analytics real time insights collection flexible integration
Presenting this set of slides with name - Data Monitoring Analytics Real Time Insights Collection Flexible Integration. This is an editable five stages graphic that deals with topics like Data Monitoring Analytics, Real Time Insights Collection, Flexible Integration to help convey your message better graphically. This product is a premium product available for immediate download, and is 100 percent editable in Powerpoint. Download this now and use it in your presentations to impress your audience.
-
 Operations data analytics economic industry analysis research development
Presenting this set of slides with name - Operations Data Analytics Economic Industry Analysis Research Development. This is an editable five stages graphic that deals with topics like Operations Data Analytics, Economic Industry Analysis, Research Development to help convey your message better graphically. This product is a premium product available for immediate download, and is 100 percent editable in Powerpoint. Download this now and use it in your presentations to impress your audience.
-
 Data layer social platform monitoring analytics brand monitoring
Presenting this set of slides with name - Data Layer Social Platform Monitoring Analytics Brand Monitoring. This is an editable four stages graphic that deals with topics like Data Layer, Social Platform, Monitoring Analytics, Brand Monitoring to help convey your message better graphically. This product is a premium product available for immediate download, and is 100 percent editable in Powerpoint. Download this now and use it in your presentations to impress your audience.
-
 Positioning strategy operational planning big data analytics visualization
Presenting this set of slides with name - Positioning Strategy Operational Planning Big Data Analytics Visualization. This is an editable four stages graphic that deals with topics like Positioning Strategy, Operational Planning, Big Data Analytics Visualization to help convey your message better graphically. This product is a premium product available for immediate download, and is 100 percent editable in Powerpoint. Download this now and use it in your presentations to impress your audience.
-
 Statistical analytical ability data visualization enterprise data management
Presenting this set of slides with name - Statistical Analytical Ability Data Visualization Enterprise Data Management. This is an editable four stages graphic that deals with topics like Statistical Analytical Ability, Data Visualization, Enterprise Data Management to help convey your message better graphically. This product is a premium product available for immediate download and is 100 percent editable in Powerpoint. Download this now and use it in your presentations to impress your audience.
-
 Business rules data delivery dashboard analytics business requirement
Presenting this set of slides with name - Business Rules Data Delivery Dashboard Analytics Business Requirement. This is an editable three stages graphic that deals with topics like Business Rules, Data Delivery, Dashboard Analytics, Business Requirement to help convey your message better graphically. This product is a premium product available for immediate download, and is 100 percent editable in Powerpoint. Download this now and use it in your presentations to impress your audience.
-
 Transaction integration customer analytics investment management data integration
Presenting this set of slides with name - Transaction Integration Customer Analytics Investment Management Data Integration. This is an editable four stages graphic that deals with topics like Transaction Integration, Customer Analytics, Investment Management, Data Integration to help convey your message better graphically. This product is a premium product available for immediate download, and is 100 percent editable in Powerpoint. Download this now and use it in your presentations to impress your audience.
-
 Mobile qualitative big data analytics behavioral economics models
Presenting this set of slides with name - Mobile Qualitative Big Data Analytics Behavioral Economics Models. This is an editable eight stages graphic that deals with topics like Mobile Qualitative, Big Data Analytics, Behavioral Economics Models to help convey your message better graphically. This product is a premium product available for immediate download, and is 100 percent editable in Powerpoint. Download this now and use it in your presentations to impress your audience.
-
 Competitive advantage descriptive analytics machine learning data management platforms
Presenting this set of slides with name - Competitive Advantage Descriptive Analytics Machine Learning Data Management Platforms. This is an editable four graphic that deals with topics like Competitive Advantage, Descriptive Analytics, Machine Learning, Data Management Platforms to help convey your message better graphically. This product is a premium product available for immediate download, and is 100 percent editable in Powerpoint. Download this now and use it in your presentations to impress your audience.
-
 Data warehouse appliance standard hardware advanced analytics maturity
Presenting this set of slides with name - Data Warehouse Appliance Standard Hardware Advanced Analytics Maturity. This is an editable five graphic that deals with topics like Data Warehouse Appliance, Standard Hardware, Advanced Analytics Maturity to help convey your message better graphically. This product is a premium product available for immediate download, and is 100 percent editable in Powerpoint. Download this now and use it in your presentations to impress your audience.
-
 Data governance contains information analytics and outcomes
Presenting this set of slides with name - Data Governance Contains Information Analytics And Outcomes. This is a four stage process. The stages in this process are Data Quality, Data Governance, Data Management.
-
 Risks and opportunities showing regulations capital management data analytics
Presenting this set of slides with name - Risks And Opportunities Showing Regulations Capital Management Data Analytics. This is a eight stage process. The stages in this process are Challenges And Solutions, Issues And Solutions, Risk And Opportunities.
-
 Data analytics skills substitute product service strategic planning
Presenting this set of slides with name - Data Analytics Skills Substitute Product Service Strategic Planning. This is an editable four stages graphic that deals with topics like Data Analytics Skills, Substitute Product Service, Strategic Planning to help convey your message better graphically. This product is a premium product available for immediate download, and is 100 percent editable in Powerpoint. Download this now and use it in your presentations to impress your audience.
-
 Mobile analytics icon showing pie chart bar graph data analytics
Presenting this set of slides with name - Mobile Analytics Icon Showing Pie Chart Bar Graph Data Analytics. This is a one stage process. The stages in this process are Mobile Analytics, Mobile Tracking, Mobile Web Analytics.
-
 Customer insight defines data external analytics
Presenting this set of slides with name - Customer Insight Defines Data External Analytics. This is a two stage process. The stages in this process are Customer Insight, Consumer Insight, Customer Experience.
-
 Data warehousing operational analytical environment
Presenting this set of slides with name - Data Warehousing Operational Analytical Environment. This is a two stage process. The stages in this process are Etl, Extract, Transform And Load, Data Warehousing.
-
 Data warehousing reporting analytics data mining
Presenting this set of slides with name - Data Warehousing Reporting Analytics Data Mining. This is a two stage process. The stages in this process are Etl, Extract, Transform And Load, Data Warehousing.
-
 Collaboration communications data center technology enterprise data analytics
Presenting this set of slides with name - Collaboration Communications Data Center Technology Enterprise Data Analytics. This is an editable two stages graphic that deals with topics like Collaboration Communications, Data Center Technology, Enterprise Data Analytics to help convey your message better graphically. This product is a premium product available for immediate download, and is 100 percent editable in Powerpoint. Download this now and use it in your presentations to impress your audience.
-
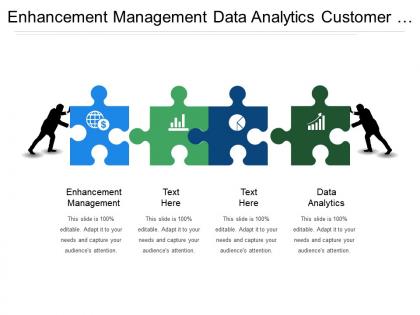 Enhancement management data analytics customer acquisition customer retention
Presenting Enhancement Management Data Analytics Customer Acquisition Customer Retention. Enjoy 100% customizability by downloading our PowerPoint template. Modify the text, font, orientation, patterns, shapes, colors, and background to achieve the desired results. Save and easily convert our PPT file into different formats such as PDF, PNG, and JPG. This professionally designed PowerPoint slide works well with Google Slides. It is also compatible with multiple screen aspect ratios like standard and widescreen.
-
 Enterprise security strategy roadmap data architecture business analytics
Presenting this set of slides with name - Enterprise Security Strategy Roadmap Data Architecture Business Analytics. This is an editable four stages graphic that deals with topics like Enterprise Security, Strategy Roadmap, Data Architecture, Business Analytics to help convey your message better graphically. This product is a premium product available for immediate download, and is 100 percent editable in Powerpoint. Download this now and use it in your presentations to impress your audience.
-
 Data analytic arrow magnifying glass upward arrow
Presenting data analytic arrow magnifying glass upward arrow. This is a data analytic arrow magnifying glass upward arrow. This is a three stage process. The stages in this process are data analytics icons, information analytics icons, content analytics icons.
-
 Data analytic bar graph magnifying glass
Presenting data analytic bar graph magnifying glass. This is a data analytic bar graph magnifying glass. This is a four stage process. The stages in this process are data analytics icons, information analytics icons, content analytics icons.
-
 Data analytic icon bar graph
Presenting Data Analytic Icon Bar Graph template. The slide is compatible with Google Slides which makes it accessible at once. The slide is completely editable. It can be saved in various document formats such as JPEG, PNG, or PDF. Moreover, both standard screen(4:3) and widescreen(16:9) aspect ratios are supported. High-quality graphics ensure that distortion does not occur.
-
 Data analytic icon computer pie chart
Presenting data analytic icon computer pie chart. This is a data analytic icon computer pie chart. This is a three stage process. The stages in this process are data analytics icons, information analytics icons, content analytics icons.
-
 Data analytic icon computer screen bar graph
Presenting data analytic icon computer screen bar graph. This is a data analytic icon computer screen bar graph. This is a one stage process. The stages in this process are data analytics icons, information analytics icons, content analytics icons.
-
 Data analytic icon improved bar graph
Presenting data analytic icon improved bar graph. This is a data analytic icon improved bar graph. This is a three stage process. The stages in this process are data analytics icons, information analytics icons, content analytics icons.


