Powerpoint Templates and Google slides for Analytical Dashboard
Save Your Time and attract your audience with our fully editable PPT Templates and Slides.
-
 Project Leadership Training Analytical Dashboard
The slide depicts the dashboard analyzing project leadership training metrics such as training budget, participants, total training hours, total cost, etc. to enhance project management effectiveness and leadership development. Presenting our well structured Project Leadership Training Analytical Dashboard The topics discussed in this slide are Approved Demands, Training Demands, Training Budget. This is an instantly available PowerPoint presentation that can be edited conveniently. Download it right away and captivate your audience.
-
 Statistical Analysis Techniques Healthcare Data Analytics Monitoring Dashboard
This slide represents the dashboard to monitor the data analytics in healthcare department. The key components of this slide are overall patient satisfaction, patients by division, average waiting time, total patients admitted, etc. Present the topic in a bit more detail with this Statistical Analysis Techniques Healthcare Data Analytics Monitoring Dashboard. Use it as a tool for discussion and navigation on Outpatient Vs Inpatients Trend, Overall Patient Satisfaction, Advisor Explained The Treatment Properly. This template is free to edit as deemed fit for your organization. Therefore download it now.
-
 Dashboard For Effective Network Traffic Implementing Data Analytics To Enhance Telecom Data Analytics SS
This slide showcases dashboard used to monitor and rack network traffic and bandwidth usage data. It includes elements such as real time bandwidth usage monitoring, customized reports, network troubleshooting, capacity planning , utilization needs etc. Present the topic in a bit more detail with this Dashboard For Effective Network Traffic Implementing Data Analytics To Enhance Telecom Data Analytics SS. Use it as a tool for discussion and navigation on Dashboard Usability, Bandwidth Monitoring Software. This template is free to edit as deemed fit for your organization. Therefore download it now.
-
 Dashboard To Analyze Customer Churn In Implementing Data Analytics To Enhance Telecom Data Analytics SS
This slide showcases dashboard for tracking customer attrition rate in telecom business and identify reasons for high churn. It provides information regarding dashboard usability, churn rate by gender, by city, phone vs internet service, business revenue, customer journey etc. Deliver an outstanding presentation on the topic using this Dashboard To Analyze Customer Churn In Implementing Data Analytics To Enhance Telecom Data Analytics SS. Dispense information and present a thorough explanation of Key Insights, Dashboard Usability, Churn Customers using the slides given. This template can be altered and personalized to fit your needs. It is also available for immediate download. So grab it now.
-
 Employee Performance Evaluation Analytics Dashboard Performance Evaluation Strategies For Employee
This slide illustrate information about employee performance evaluation analytics dashboard for self assessment. It includes elements such as average job satisfaction, average performance rating, average age etc. Present the topic in a bit more detail with this Employee Performance Evaluation Analytics Dashboard Performance Evaluation Strategies For Employee. Use it as a tool for discussion and navigation on Education Background, Attrition Level, Business Travel Frequency. This template is free to edit as deemed fit for your organization. Therefore download it now.
-
 Text Analytics Dashboard For Sentiment Analysis
This slide showcases the text analytics dashboard for customer sentiment analysis, which includes components such as total comments and vocabulary density. Deliver an outstanding presentation on the topic using this Text Analytics Dashboard For Sentiment Analysis. Dispense information and present a thorough explanation of Text Analytics Dashboard, Sentiment Analysis, Vocabulary Density using the slides given. This template can be altered and personalized to fit your needs. It is also available for immediate download. So grab it now.
-
 Customer Service Analytics Tool Dashboard
This slide represents the customer service analytics tool dashboard which include components such as all users, segments, new paying, tags, etc. Presenting our well structured Customer Service Analytics Tool Dashboard The topics discussed in this slide are Segments, TagsThis is an instantly available PowerPoint presentation that can be edited conveniently. Download it right away and captivate your audience.
-
 Developing Freemium Business Churn Analytics Dashboard For Performance Evaluation
This slide presents churn analytics dashboard highlighting key segments of churn rate evaluation, helpful in making necessary strategic changes in plan and features. It includes churn by product, churn by country, credit scores to churn, churn by age, etc. Present the topic in a bit more detail with this Developing Freemium Business Churn Analytics Dashboard For Performance Evaluation. Use it as a tool for discussion and navigation on Churn Vs No Churn, Salary To Churn, Tenure To Churn, Balance To Churn. This template is free to edit as deemed fit for your organization. Therefore download it now.
-
 Content Monetization Revenue Analytics Dashboard
The below slide provides a content monetization dashboard analytics that keeps a track of revenue generated from different devices. It provides insights such as total revenue, paying device, etc. Introducing our Content Monetization Revenue Analytics Dashboard set of slides. The topics discussed in these slides are Revenue, Average Revenue Per Daily Active Device, Average Revenue Per Paying Device. This is an immediately available PowerPoint presentation that can be conveniently customized. Download it and convince your audience.
-
 Real Time Icon Business Analytics Dashboard Processing Operation Monitoring Location
It has PPT slides covering wide range of topics showcasing all the core areas of your business needs. This complete deck focuses on Real Time Icon Business Analytics Dashboard Processing Operation Monitoring Location and consists of professionally designed templates with suitable graphics and appropriate content. This deck has total of ten slides. Our designers have created customizable templates for your convenience. You can make the required changes in the templates like colour, text and font size. Other than this, content can be added or deleted from the slide as per the requirement. Get access to this professionally designed complete deck PPT presentation by clicking the download button below.
-
 Overview gym health and fitness clubs industry analytics dashboard for gym health and fitness clubs
This slide covers the Key performance indicators for analysing social media platforms, email campaigns and website performance Increase audience engagement and knowledge by dispensing information using Overview Gym Health And Fitness Clubs Industry Analytics Dashboard For Gym Health And Fitness Clubs. This template helps you present information on seven stages. You can also present information on Analytics, Dashboard, Performance using this PPT design. This layout is completely editable so personaize it now to meet your audiences expectations.
-
 Investigative Dashboard Search In Powerpoint And Google Slides Cpb
Presenting Investigative Dashboard Search In Powerpoint And Google Slides Cpb slide which is completely adaptable. The graphics in this PowerPoint slide showcase three stages that will help you succinctly convey the information. In addition, you can alternate the color, font size, font type, and shapes of this PPT layout according to your content. This PPT presentation can be accessed with Google Slides and is available in both standard screen and widescreen aspect ratios. It is also a useful set to elucidate topics like Investigative Dashboard Search. This well-structured design can be downloaded in different formats like PDF, JPG, and PNG. So, without any delay, click on the download button now.
-
 Big Data Analytics Dashboard Icon
Introducing our premium set of slides with Big Data Analytics Dashboard Icon. Ellicudate the three stages and present information using this PPT slide. This is a completely adaptable PowerPoint template design that can be used to interpret topics like Big Data Analytics, Dashboard Icon. So download instantly and tailor it with your information.
-
 Dashboard Of Data Analytics In Digital Marketing
This slide depicts digital analytics performance report of business to evaluate customer engagement over website. It includes revenue, conversion performance, cost per click, transaction, Impressions and session. Introducing our Dashboard Of Data Analytics In Digital Marketing set of slides. The topics discussed in these slides are Transaction, Impressions, Cost Per Click. This is an immediately available PowerPoint presentation that can be conveniently customized. Download it and convince your audience.
-
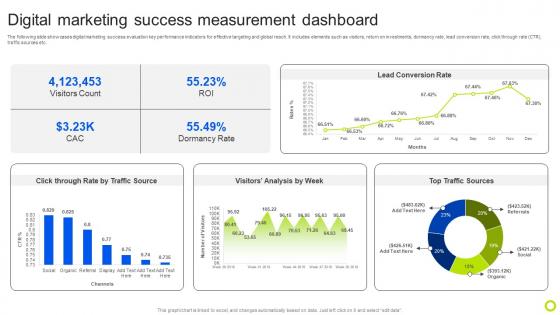 Digital Marketing Success Measurement Dashboard Guide For Implementing Analytics MKT SS V
The following slide showcases digital marketing success evaluation key performance indicators for effective targeting and global reach. It includes elements such as visitors, return on investments, dormancy rate, lead conversion rate, click through rate CTR, traffic sources etc.Present the topic in a bit more detail with this Digital Marketing Success Measurement Dashboard Guide For Implementing Analytics MKT SS V. Use it as a tool for discussion and navigation on Visitors Count, Lead Conversion, Dormancy Rate. This template is free to edit as deemed fit for your organization. Therefore download it now.
-
 Kpi Dashboard Icon Of Big Data In Customer Analytics
Introducing our Kpi Dashboard Icon Of Big Data In Customer Analytics set of slides. The topics discussed in these slides are Kpi Dashboard Icon Of Big, Data In Customer Analytics. This is an immediately available PowerPoint presentation that can be conveniently customized. Download it and convince your audience.
-
 Client Data Insights And Analytics Dashboard Icon
Introducing our Client Data Insights And Analytics Dashboard Icon set of slides. The topics discussed in these slides are Customer Analytics, Data Dashboard Icon. This is an immediately available PowerPoint presentation that can be conveniently customized. Download it and convince your audience.
-
 Icon Highlighting Data Analytics Dashboard For Gaining Companies Insights
Presenting our set of slides with Icon Highlighting Data Analytics Dashboard For Gaining Companies Insights. This exhibits information on three stages of the process. This is an easy to edit and innovatively designed PowerPoint template. So download immediately and highlight information on Icon Highlighting, Data Analytics, Gaining Companies Insights.
-
 Social Media Analytics With Tools Social Media Engagement Tracking Dashboard
This slide depicts the social media engagement metrics dashboard. The purpose of this slide is to outline the engagement metrics such as page engagement, post-key interaction, post-engagement type, etc. Deliver an outstanding presentation on the topic using this Social Media Analytics With Tools Social Media Engagement Tracking Dashboard. Dispense information and present a thorough explanation of Social Media Engagement, Tracking Dashboard, Post Key Interaction, Post Engagement Type using the slides given. This template can be altered and personalized to fit your needs. It is also available for immediate download. So grab it now.
-
 Hospital Website Analytics Marketing Plan Dashboard
This slide illustrates KPIordashboard of hospital marketing plan for website analytics including user sessions, page interactions, userbase, online visits, and website traffic density.Introducing our Hospital Website Analytics Marketing Plan Dashboard set of slides. The topics discussed in these slides are Web Traffic Concentration, Marketing Plan Dashboard. This is an immediately available PowerPoint presentation that can be conveniently customized. Download it and convince your audience.
-
 Dashboard For AI Powered Chatbot Analytics
This slide represents analytics dashboard for AI powered chatbot. It aims to help businesses make data driven decisions to enhance chatbots effectiveness, user experience, and overall operational efficiency. It includes various elements such as active conversations, messages per conversation, etc. Presenting our well structured Dashboard For AI Powered Chatbot Analytics The topics discussed in this slide are Cost Saved, Hours Saved, Business Value Generated This is an instantly available PowerPoint presentation that can be edited conveniently. Download it right away and captivate your audience.
-
 Icon Highlighting SaaS Dashboard For Data Analytics
Introducing our premium set of slides with Icon Highlighting SaaS Dashboard For Data Analytics. Ellicudate the three stages and present information using this PPT slide. This is a completely adaptable PowerPoint template design that can be used to interpret topics like Highlighting SaaS Dashboard, Data Analytics. So download instantly and tailor it with your information.
-
 Social Media Analytics Dashboard Icon
Presenting our set of slides with Social Media Analytics Dashboard Icon. This exhibits information on four stages of the process. This is an easy to edit and innovatively designed PowerPoint template. So download immediately and highlight information on Social Media Analytics, Dashboard, Icon.
-
 Data Analytics Dashboard Benefits Icon Showcasing Status
Introducing our premium set of slides with Data Analytics Dashboard Benefits Icon Showcasing Status Ellicudate the three stages and present information using this PPT slide. This is a completely adaptable PowerPoint template design that can be used to interpret topics like Data Analytics, Dashboard Benefits, Showcasing Status So download instantly and tailor it with your information.
-
 Employee Benefits Analytics Dashboard Icon
Introducing our Employee Benefits Analytics Dashboard Icon set of slides. The topics discussed in these slides are Employee Analytics, Dashboard Icon. This is an immediately available PowerPoint presentation that can be conveniently customized. Download it and convince your audience.
-
 Web Analytics Dashboard To Improve Social Media Optimization
This slide demonstrates social media improvement KPI dashboard for web analytics such as engaged sessions, sessions, active users, average engagement time, new users, etc Introducing our premium set of slides with name Web Analytics Dashboard To Improve Social Media Optimization. Ellicudate the ten stages and present information using this PPT slide. This is a completely adaptable PowerPoint template design that can be used to interpret topics like Engaged Sessions, Engagement Rate, Sessions. So download instantly and tailor it with your information.
-
 Icon For Customer Demand Analytics Dashboard
Presenting our set of slides with Icon For Customer Demand Analytics Dashboard This exhibits information on three stages of the process. This is an easy to edit and innovatively designed PowerPoint template. So download immediately and highlight information on Customer Demand, Analytics Dashboard
-
 Apt business analytics dashboard diagram ppt slides
Presenting apt business analytics dashboard diagram ppt slides. This is a business analytics dashboard diagram ppt slides. This is a one stage process. The stages in this process are business, data, decision, analytics, statistical.
-
 Dashboards Snapshot by function marketing web analytics dashboard
Deliver an outstanding presentation on the topic using this Dashboards Snapshot By Function Marketing Web Analytics Dashboard. Dispense information and present a thorough explanation of Marketing Web Analytics Dashboard using the slides given. This template can be altered and personalized to fit your needs. It is also available for immediate download. So grab it now.
-
 Hiring project quarterly analytics dashboard
Presenting our well structured Hiring Project Quarterly Analytics Dashboard. The topics discussed in this slide are Gender Distribution, Turnover By Gender, Ethnicity Distribution. This is an instantly available PowerPoint presentation that can be edited conveniently. Download it right away and captivate your audience.
-
 Role of digital twin and iot healthcare dashboard snapshot showing analytical data
This slide shows the healthcare dashboard that presents analytical data such as occupancy, patient turnover, efficiency and costs, satisfaction and service indicators. Deliver an outstanding presentation on the topic using this Role Of Digital Twin And Iot Healthcare Dashboard Snapshot Showing Analytical Data. Dispense information and present a thorough explanation of Healthcare, Dashboard, Analytical using the slides given. This template can be altered and personalized to fit your needs. It is also available for immediate download. So grab it now.
-
 Analytics Cloud Dashboard Snapshot For Financial Reporting Sap Analytics Cloud
This slide illustrates the SAP Analytics Cloud dashboard snapshot for financial reporting in terms of net revenue, operating profit, cost of goods sold, profitability trend and net revenue by country. It also provides details of net worth of incoming order and order distribution by country. Present the topic in a bit more detail with this Analytics Cloud Dashboard For Financial Reporting Sap Analytics Cloud. Use it as a tool for discussion and navigation on Analytics, Dashboard, Financial. This template is free to edit as deemed fit for your organization. Therefore download it now.
-
 Cloud Dashboard For Product Sales Analysis Sap Analytics Cloud
This slide illustrates the SAP Analytics Cloud dashboard to monitor product sales performance. It provides information regarding the gross margin and net revenue earned, product performance state wise and year wise. Present the topic in a bit more detail with this Cloud Dashboard For Product Sales Analysis Sap Analytics Cloud. Use it as a tool for discussion and navigation on Analytics, Dashboard, Product. This template is free to edit as deemed fit for your organization. Therefore download it now.
-
 Sap Analytics Cloud Cloud Dashboard For Income Analysis And Forecasting
This slide illustrates the SAP Analytics Cloud dashboard for organization income analysis and forecasting. It provides information regarding multiple incomes such as interest, operating and trading income. It also contains details of operating expenses. Deliver an outstanding presentation on the topic using this Sap Analytics Cloud Cloud Dashboard For Income Analysis And Forecasting. Dispense information and present a thorough explanation of Dashboard, Analytics, Operating Expenses using the slides given. This template can be altered and personalized to fit your needs. It is also available for immediate download. So grab it now.
-
 Sap Analytics Cloud Dashboard To Asses Digital Marketing Campaigns Performance
This slide represents the SAP Analytics Cloud Dashboard to Asses digital marketing campaigns performance. It provides information regarding the spend, click, impression, click through rate and cost per click summary along with details of spend by campaigns. Present the topic in a bit more detail with this Sap Analytics Cloud Dashboard To Asses Digital Marketing Campaigns Performance. Use it as a tool for discussion and navigation on Analytics, Dashboard, Marketing. This template is free to edit as deemed fit for your organization. Therefore download it now.
-
 Sap Analytics Cloud Sap Analytics Cloud Dashboard For Hr Department
This slide represents the SAP Analytics Cloud Dashboard for HR department of the organization. It includes information regarding the workforce employed, average salary department wise, age diversity, gender distribution and reasons for leaving firm. Deliver an outstanding presentation on the topic using this Sap Analytics Cloud Sap Analytics Cloud Dashboard For Hr Department. Dispense information and present a thorough explanation of SAP Analytics Cloud Dashboard For HR Department using the slides given. This template can be altered and personalized to fit your needs. It is also available for immediate download. So grab it now.
-
 Social media recruitment trend and analytics dashboard
Introducing our Social Media Recruitment Trend And Analytics Dashboard set of slides. The topics discussed in these slides are Social Media Recruitment Trend And Analytics Dashboard. This is an immediately available PowerPoint presentation that can be conveniently customized. Download it and convince your audience.
-
 Digital Dashboard Depicting Insurance Claims Analytics
This slide illustrates digital dashboard depicting insurance claim analytics which contains claim amount comparison, customer feedback, claim details, average cost per claim, settle claim, etc. Presenting our well structured Digital Dashboard Depicting Insurance Claims Analytics. The topics discussed in this slide are Customer Feedback, Claim Amount Comparison, Cost Per Claim. This is an instantly available PowerPoint presentation that can be edited conveniently. Download it right away and captivate your audience.
-
 Analytics Dashboard To Evaluate Digital Marketing Performance
The purpose of this slide is to exhibits a dashboard which can be used to examine the marketing performance. The metrics covered in the dashboard are bounce rate, page views, new sessions, total time spent on site, email marketing performance etc. Presenting our well-structured Analytics Dashboard To Evaluate Digital Marketing Performance. The topics discussed in this slide are Analytics Dashboard, Evaluate, Marketing, Performance. This is an instantly available PowerPoint presentation that can be edited conveniently. Download it right away and captivate your audience.
-
 B2b Marketing Analytics Dashboard With Engagement Rate
The purpose of this slide is to display analytics dashboard which can be used by company to highlight marketing campaign performance. Information covered in this template is related to shares and likes by social media platforms, total engagement rate etc. Introducing our B2b Marketing Analytics Dashboard With Engagement Rate set of slides. The topics discussed in these slides are Marketing, Analytics, Dashboard, Engagement. This is an immediately available PowerPoint presentation that can be conveniently customized. Download it and convince your audience.
-
 Marketing Analytics Dashboard To Analyze Ads Campaign Performance
The purpose of this slide is to showcase marketing analytics dashboard. Company can analyze the performance of ads campaign through metrics such as total amount spent, total link clicks, conversions, revenue generated etc. Presenting our well-structured Marketing Analytics Dashboard To Analyze Ads Campaign Performance. The topics discussed in this slide are Marketing Analytics, Dashboard, Campaign, Performance. This is an instantly available PowerPoint presentation that can be edited conveniently. Download it right away and captivate your audience.
-
 Marketing Analytics Dashboard Snapshot With Conversion Rate
The purpose of this slide is to outline marketing analytics dashboard. The dashboard provides information about key metrices such as total impressions, clicks, cost, conversion value, rate, ROAS, market share by different ad platforms etc. Introducing our Marketing Analytics Dashboard Snapshot With Conversion Rate set of slides. The topics discussed in these slides are Marketing, Analytics, Dashboard. This is an immediately available PowerPoint presentation that can be conveniently customized. Download it and convince your audience.
-
 Real Time Analytics Dashboard To Measure Marketing Campaign Performance
The purpose of this slide is to outline analytics dashboard to evaluate the success rate of marketing campaign performance. It provides information about metrics such as clicks, impressions, spend, conversions, site audit score, audience growth, etc. Introducing our Real Time Analytics Dashboard To Measure Marketing Campaign Performance set of slides. The topics discussed in these slides are Analytics, Dashboard, Performance. This is an immediately available PowerPoint presentation that can be conveniently customized. Download it and convince your audience.
-
 Promotion Strategy Implementation Analytics Dashboard Snapshot
This slide illustrates graphical representation of implementation data of promotional strategy. It includes sales revenue, ad expenditure, profit etc. Presenting our well structured Promotion Strategy Implementation Analytics Dashboard Snapshot. The topics discussed in this slide are Revenue Performance, Sales Revenue, Return On Investment. This is an instantly available PowerPoint presentation that can be edited conveniently. Download it right away and captivate your audience.
-
 Mobile Application Analytics Dashboard With Average Daily Users
This slide showcases dashboard that can help organization to analyse the daily active users and traffic generated from mobile application. Its key components daily users trend, installs by country, installs by source and daily active users by device Introducing our Mobile Application Analytics Dashboard With Average Daily Users set of slides. The topics discussed in these slides are Application, Analytics, Dashboard. This is an immediately available PowerPoint presentation that can be conveniently customized. Download it and convince your audience.
-
 Strategic Planning For Industrial Marketing Manufacturing Analytics And Reporting Dashboard
This slide covers the manufacturing analytics and reporting dashboard which focuses on monthly inventory, priority orders, inventory holding costs, market share, turnover trend, etc. Deliver an outstanding presentation on the topic using this Strategic Planning For Industrial Marketing Manufacturing Analytics And Reporting Dashboard. Dispense information and present a thorough explanation of Manufacturing, Analytics, Dashboard using the slides given. This template can be altered and personalized to fit your needs. It is also available for immediate download. So grab it now.
-
 Data Visualization With Augmented Analytics Dashboard Snapshot Ppt Infographics
This slide represents the data visualization with an augmented analytics dashboard covering sales, spending per customer, gross profit, unique customers, unique purchase, and gross profit. Present the topic in a bit more detail with this Data Visualization With Augmented Analytics Dashboard Snapshot Ppt Infographics. Use it as a tool for discussion and navigation on Data Visualization With Augmented Analytics Dashboard. This template is free to edit as deemed fit for your organization. Therefore download it now.
-
 Server Migration Dashboard With Infrastructure Platform Analytics
This slide illustrates risk landscape dashboard for malware and network attacks which contains malware attack frequency, country wise attacks, top 10 attacks, etc. this can benefit IT managers in managing system performance and task efficiency. Presenting our well structured Server Migration Dashboard With Infrastructure Platform Analytics. The topics discussed in this slide are Components Migrated, Infrastructure Defects, Systems Migrated. This is an instantly available PowerPoint presentation that can be edited conveniently. Download it right away and captivate your audience.
-
 Visual Analytical KPI Dashboard Snapshot For Data Warehouse
Presenting our well structured Visual Analytical KPI Dashboard Snapshot For Data Warehouse. The topics discussed in this slide are Profit, Revenue Change, Analysis. This is an instantly available PowerPoint presentation that can be edited conveniently. Download it right away and captivate your audience.
-
 Cloud business intelligence dashboard intelligent service analytics ppt formats
Present the topic in a bit more detail with this Cloud Business Intelligence Dashboard Intelligent Service Analytics Ppt Formats. Use it as a tool for discussion and navigation on Social Interactions, Key Web Metrics, Key Sales Metrics, Regional Sales Status, Marketing Influence. This template is free to edit as deemed fit for your organization. Therefore download it now.
-
 Dashboards for iot device intelligent service analytics ppt template
Deliver an outstanding presentation on the topic using this Dashboards For Iot Device Intelligent Service Analytics Ppt Template. Dispense information and present a thorough explanation of Dashboard, Devices Connection using the slides given. This template can be altered and personalized to fit your needs. It is also available for immediate download. So grab it now.
-
 Total productivity maintenance production process analytics dashboard
This slide covers the dashboard of production process analytics dashboard that focuses on process cycle, defect types, completion count, etc. Present the topic in a bit more detail with this Total Productivity Maintenance Production Process Analytics Dashboard. Use it as a tool for discussion and navigation on Type Of Defect, Process Cycle Time By User, Count Of Completions, Process Time Statistics By User. This template is free to edit as deemed fit for your organization. Therefore download it now.
-
 Cost benefits iot digital twins implementation healthcare dashboard showing analytical data
This slide shows the healthcare dashboard that presents analytical data such as occupancy, patient turnover, efficiency and costs, satisfaction and service indicators. Deliver an outstanding presentation on the topic using this Cost Benefits Iot Digital Twins Implementation Healthcare Dashboard Showing Analytical Data. Dispense information and present a thorough explanation of Healthcare Dashboard Showing Analytical Data using the slides given. This template can be altered and personalized to fit your needs. It is also available for immediate download. So grab it now.
-
 Dashboard Depicting HR Analytics Of Organization Automation Of HR Workflow
This slide shows the dashboard that depicts total number of employees including permanent, fixed contract and temporary with business unit distribution. Deliver an outstanding presentation on the topic using this Dashboard Depicting HR Analytics Of Organization Automation Of HR Workflow. Dispense information and present a thorough explanation of Business Unit, Employees using the slides given. This template can be altered and personalized to fit your needs. It is also available for immediate download. So grab it now.
-
 Workforce Optimization Dashboard With Performance Analytics
The following slide highlights the dashboard of workforce optimization with performance analytics metrics such as absenteeism, overtime expenses, clock in punches etc. Introducing our Workforce Optimization Dashboard With Performance Analytics set of slides. The topics discussed in these slides are Performance Analytics, Clock In Punches, Operations Hours, Overtime Expenses, Absenteeism. This is an immediately available PowerPoint presentation that can be conveniently customized. Download it and convince your audience.
-
 KPI Dashboard Showing Web Traffic Results Using Analytics Tool
Mentioned slide outlines a comprehensive KPI dashboard highlighting web page results using XYZ analytics tool. The key performance indicators kpis mentioned in the slide are visits, page views, average visit duration, bounce rate, etc. Presenting our well structured KPI Dashboard Showing Web Traffic Results Using Analytics Tool. The topics discussed in this slide are Page Views, Average Visit Duration, Bounce Rate. This is an instantly available PowerPoint presentation that can be edited conveniently. Download it right away and captivate your audience.
-
 Oracle analytics cloud it dashboard snapshot for oracle analytics cloud
This slide depicts the dashboard snapshot for data integration in the business, and it is showing real time details about expenses, profits, margins percentage, and new addition projects. Deliver an outstanding presentation on the topic using this Oracle Analytics Cloud It Dashboard For Oracle Analytics Cloud. Dispense information and present a thorough explanation of Dashboard For Oracle Analytics Cloud using the slides given. This template can be altered and personalized to fit your needs. It is also available for immediate download. So grab it now.
-
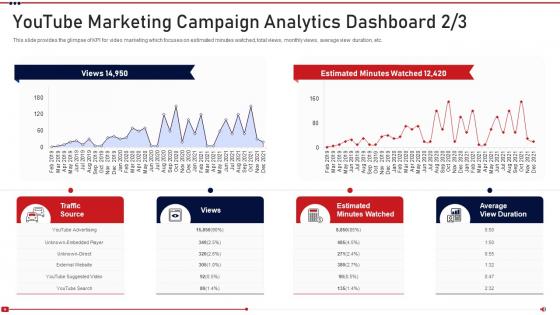 Youtube analytics dashboard promoting on youtube channel
This slide provides the glimpse of KPI for video marketing which focuses on estimated minutes watched, total views, monthly views, average view duration, etc. Deliver an outstanding presentation on the topic using this Youtube Analytics Dashboard Promoting On Youtube Channel. Dispense information and present a thorough explanation of Youtube Marketing Campaign Analytics Dashboard using the slides given. This template can be altered and personalized to fit your needs. It is also available for immediate download. So grab it now.
-
 Reducing Cost Of Operations Through Digital Twins Healthcare Dashboard Showing Analytical Data
This slide shows the healthcare dashboard that presents analytical data such as occupancy, patient turnover, efficiency and costs, satisfaction and service indicators. Present the topic in a bit more detail with this Reducing Cost Of Operations Through Digital Twins Healthcare Dashboard Showing Analytical Data. Use it as a tool for discussion and navigation on Healthcare, Dashboard, Analytical. This template is free to edit as deemed fit for your organization. Therefore download it now.
-
 Business Analytics Dashboard Slide For Collaborative Networks Infographic Template
This is a single slide titled Business Analytics Dashboard Slide For Collaborative Networks Infographic Template. It is crafted using high-quality vector-based visuals that are 100 percent editable and available for immediate download in standard and widescreen aspect ratios.


