Measurement - Illustrations
- Sub Categories
-
- Accounting
- Agriculture
- Auditing
- Beauty and Fashion
- Branding
- Business
- Communication
- Construction
- Contact Management
- Corporate Social Responsibility
- Creative
- Customer Support
- Cybersecurity
- Data Management
- Decision Making
- Design
- Disproportionate Illustrations
- Documentation
- E-commerce
- Education and Professional Development
- Engineering
- Environment
- Facility Management
- Finance
- Flat Illustrations
- Food and Beverage
- Furniture
- Gaming
- Hospitality
- HR
- Illustration
- Information Technology
- Innovation
- Insurance
- Isometric Illustrations
- IT Operations
- Laboratory
- Legal
- Location
- Management
- Manufacturing
- Market Research
- Marketing and Advertising
- Measurement
- Media
- Medical and Healthcare
- Office Supplies
- Operations
- Organizational Culture
- Performance Management
- Policy
- Product Management
- Productivity
- Project Management
- Quality Control
- Recruitment
- Remote Work
- Retail
- Risk Management
- Safety
- Sales
- Salon and Barbershop Business
- Science
- Service
- Social Media
- Social Responsibility
- Sustainability
- Technology
- Tools and Equipment
- Training
- Waste Management
- Web Design
-
 Brainstorming Mapping Idea Illustration
This colourful PowerPoint Illustration is perfect for brainstorming mapping ideas. It features a map with pins and a lightbulb to represent creative thinking. Use it to easily create visualisations of your ideas and plans for any project.
-
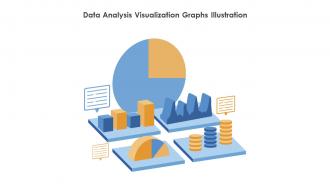
 Data Analysis Visualization Graphs Illustration
Brightly powerpoint Illustration with a bar graph to represent data visualization. Perfect for presentations, reports, and other documents to illustrate data points and trends.
-
 Product Positioning Concept Illustration
This PowerPoint Illustration is perfect for illustrating product positioning in a presentation. Its vibrant colours and clear design make it easy to understand and visually appealing, making it an ideal choice for any presentation.
-
 Strategy Business Planning Goals Process Improvement Illustration
This vibrant coloured PowerPoint Illustration is perfect for conveying the concept of strategy planning. It features a cog wheel with a lightbulb in the centre, symbolising the idea of creative problem solving. Ideal for presentations, reports and more.
-
 Target Audience Analysis Guide To Develop Marketing Strategies Illustration
This colourful PowerPoint Illustration provides a comprehensive guide to target audience analysis to help develop effective marketing strategies. It includes detailed information on how to identify target audiences, analyse their behaviour, and use insights to develop effective marketing plans.
-
 Data Stewardship Model Governance And Quality Illustration
This coloured PowerPoint Illustration depicts a Data Stewardship Model, which is a framework for data governance and management. It outlines the roles and responsibilities for data stewards, owners, and users, and helps organizations ensure data accuracy and security.
-
 Guide For Situation Analysis To Develop Marketing Program Illustration
This coloured PowerPoint Illustration is an essential guide to help you analyze the current situation and develop a comprehensive marketing program. It provides an easy-to-follow process with visuals to help you assess the market, identify key stakeholders, and develop a strategy to reach your business goals.
-
 Quantum Computing Algorithmes Superposition Illustration
This coloured powerpoint Illustration is perfect for presentations on Quantum Computing, featuring a dynamic design with a bright colour palette. Its a great way to visually communicate the complexity of the topic and engage your audience.
-
 Developing B2B Marketing Strategies For Lead Generation Illustration
This coloured powerpoint Illustration is perfect for developing B2B marketing strategies for lead generation. It provides a visual representation of the process and is easy to understand. It can be used to help explain the steps and strategies needed to create a successful marketing plan.
-
 Direct Response Marketing Channels Use To Increase Lead Generation Illustration
This coloured powerpoint Illustration provides a visual representation of the various direct response marketing channels used to increase lead generation. It includes channels such as email, social media, search engine optimization, and more. It is a great resource for marketers looking to increase their lead generation efforts.
-
 Learning Management System Course Management E Learning Illustration
This coloured powerpoint Illustration is a perfect addition to any Learning Management System. It is easy to use and provides a visually appealing way to display information. It is a great resource for teachers and students alike, and can help to make learning more engaging and interactive.
-
 Search Engine Marketing Illustration
Search Engine Marketing Illustration in vibrant colours to illustrate the concept of digital marketing. Perfect for presentations, websites and other marketing materials to capture attention and stand out.
-
 Customer Research Market Analysis Consumer Behavior Illustration
This coloured powerpoint Illustration is perfect for presentations on customer research. It features a magnifying glass and a chart, representing the process of gathering customer feedback. Its a great visual aid to help explain the importance of customer research.
-
 Effective Product Strategy Market Planning Analysis Illustration
This colourful PowerPoint Illustration is perfect for illustrating the importance of effective product strategy. It is a great visual aid to help explain the concept and can be used to highlight key points in a presentation.
-
 Creative Analysis Creative Thinking Ideation Illustration
This Creative Analysis PowerPoint Illustration is a vibrant, colourful representation of the creative process. It features a lightbulb, a magnifying glass, and a pencil, all in a bright, cheerful colour palette. Perfect for any creative project.
-
 Check Product Quality Assurance Control Illustration
This PowerPoint Illustration is a great visual aid to help you communicate the importance of checking product quality. It is a bright and colourful Illustration that will stand out on your presentation slides. It is a great tool to help you emphasize the importance of quality assurance.
-
 Financial Presentation Analysis Investment Strategies Illustration
This professionally designed PowerPoint Illustration is perfect for any Financial Presentation. It features a colourful design with a dollar sign, making it ideal for illustrating financial concepts. It is easy to use and can be quickly inserted into any presentation.
-
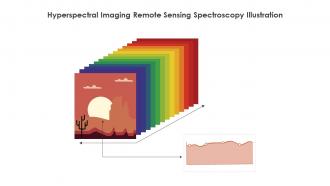
 Hyperspectral Imaging Remote Sensing Spectroscopy Illustration
This coloured PowerPoint Illustration depicts Hyperspectral Imaging, a technology used to capture and analyze the entire spectrum of light emitted by an object. It is used to identify materials, detect objects, and monitor environmental changes.
-
 Project Management Deadline Scheduling With Check Illustration
This colourful PowerPoint Illustration is the perfect visual representation of a project deadline with a checkmark. It is a great way to visually communicate the importance of meeting deadlines and achieving goals.
-
 Share Market Investment Analysis Strategies Illustration
This coloured PowerPoint Illustration is perfect for creating professional presentations on Share Market Analysis. It features a vibrant design with a graph and a chart to illustrate the performance of the market. Its an ideal choice for business professionals and investors.
-
 Hungry For Acquiring Knowledge Illustration
This vibrant coloured powerpoint Illustration is perfect for presentations about acquiring knowledge. It features a smiling face with a lightbulb, representing the idea of learning and growing. Its sure to add a touch of fun to your slides.
-
 Strategic Guide For Performance Based Marketing Campaign Illustration
This colourful PowerPoint Illustration provides a strategic guide for creating and executing successful performance-based marketing campaigns. It covers key topics such as budgeting, targeting, testing, and optimization to ensure maximum RO.
-
 Data Analysis Data Mining Machine Learning Illustration
This colourful Illustration is perfect for data analysis presentations. It is a visual representation of data analysis, with a graph and magnifying glass to show the process of collecting and analyzing information. It is a great way to illustrate the importance of data analysis in business.
-
 Data Analytical Research Analysis Statistical Illustration
This colourful PowerPoint Illustration is perfect for illustrating data analytical research. It features a magnifying glass and a graph, representing the process of collecting and analyzing data. Its ideal for presentations, reports, and other documents.
-
 Data Analytics Business Intelligence Machine Learning Illustration
This colourful PowerPoint Illustration is perfect for presentations on data analytics. It features a colourful chart with a magnifying glass, representing the analysis of data. Its a great way to add visual interest and emphasis to your presentation.
-
 Graph Analysis Network Analysis Data Visualization Illustration
This coloured powerpoint Illustration is perfect for visualizing the results of your graph analysis. It features a graph with a colourful background, making it easy to interpret and understand. Perfect for presentations, reports and other documents.
-
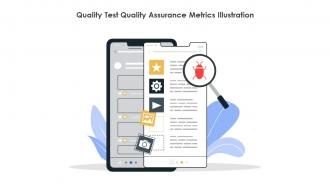
 Quality Test Quality Assurance Metrics Illustration
This coloured PowerPoint icon is perfect for presentations on Quality Testing. It features a vibrant blue, green and yellow colour palette, and a simple design that will help convey your message effectively. The icon is a great visual aid to help explain the importance of quality testing.
-
 Data Research Analysis Collection Illustration
This coloured PowerPoint icon is perfect for presentations on data research. It features a magnifying glass and a graph, symbolizing the process of data collection and analysis. The vibrant colours make it stand out and help to convey the message quickly and effectively.
-
 Beta Testing Metrics You Need To Track Illustration
This PowerPoint icon offers a comprehensive look at the metrics needed to track successful beta testing. It features a vibrant and colourful design to help visualize the data and identify key performance indicators. Perfect for any project manager or software developer.
-
 Comprehensive Analysis Of Different Data Lineage Illustration
This coloured PowerPoint icon is a visual representation of a comprehensive analysis of different data lineage classification. It is a helpful tool for understanding the complexities of data lineage and how it affects data processing. It is an ideal resource for data scientists and professionals alike.
-
 Minimizing Risk Performance With Business Analysis Illustration
This coloured PowerPoint icon is a visual representation of a comprehensive analysis of different data lineage classification. It is a helpful tool for understanding the complexities of data lineage and how it affects data processing. It is an ideal resource for data scientists and professionals alike.
-
 Delivery Excellence Model Quality Improvement Illustration
This coloured PowerPoint icon is a visual representation of the Delivery Excellence Model. It is an ideal tool for illustrating the key components of successful project delivery, including planning, execution, and delivery.
-
 Fuel Train Locomotive Railway Illustration
This coloured powerpoint icon is a visual representation of a fuel train, perfect for presentations or documents. It is a high quality vector graphic with vibrant colours that will make your slides stand out. Use it to illustrate concepts related to transportation, fuel, and energy.
-
 Business Analyzing Growth Graph Illustration
This vibrant coloured icon depicts a business analyzing growth graph to show the progress of a company. It is perfect for use in presentations, reports, and documents to illustrate the success of a business.
-
 Career Growth Professional Development Job Promotion Illustration
This coloured PowerPoint icon is perfect for representing career growth. It is designed to be eye-catching and professional, and is an ideal way to visually communicate the concept of career advancement. It is a great addition to any presentation, and can be easily edited to fit any colour scheme.
-
 Checking Product Quality Control And Assurance Illustration
This colourful PowerPoint icon is perfect for presentations about checking product quality. It features a hand holding a magnifying glass, with a blue and green colour scheme, to illustrate the process of inspecting and assessing product quality.
-
 Man Sends Statistics Data Analysis Statistical Analysis Illustration
This coloured powerpoint icon is perfect for presentations on data analysis. It features a man in a suit holding a graph, representing the transmission of statistical information. It is a great visual aid to demonstrate the importance of data in decision making.
-
 Spectral Scanning Light Analysis Illustration
This coloured powerpoint Illustration depicts Spectral Scanning in Hyperspectral Imaging, a process that captures and analyses multiple wavelengths of light to identify and classify objects in an image.
-
I have just started downloading templates for my presentations and I must say this is a great design. It helped accelerate my presentation design process and made it more visually appealing.
-
Content of slide is easy to understand and edit.
-
The templates are easy to get, and the chat customer support is excellent.
-
“Detailed and great to save your time.”
-
I faced no difficulty while searching for the slide I wanted. Honestly, the website’s interface is easy to use and can be navigated easily!
-
I didn’t expect such a good service for the money I am paying. But, they exceed my expectations. Great work SlideTeam.


