Data Management PowerPoint Templates, Presentation Backgrounds and PPT Slides
- Sub Categories
-
- Accounting
- Agriculture
- Auditing
- Beauty and Fashion
- Branding
- Business
- Communication
- Construction
- Contact Management
- Corporate Social Responsibility
- Creative
- Customer Support
- Cybersecurity
- Data Management
- Decision Making
- Design
- Disproportionate Illustrations
- Documentation
- E-commerce
- Education and Professional Development
- Engineering
- Environment
- Facility Management
- Finance
- Flat Illustrations
- Food and Beverage
- Furniture
- Gaming
- Hospitality
- HR
- Illustration
- Information Technology
- Innovation
- Insurance
- Isometric Illustrations
- IT Operations
- Laboratory
- Legal
- Location
- Management
- Manufacturing
- Market Research
- Marketing and Advertising
- Measurement
- Media
- Medical and Healthcare
- Office Supplies
- Operations
- Organizational Culture
- Performance Management
- Policy
- Product Management
- Productivity
- Project Management
- Quality Control
- Recruitment
- Remote Work
- Retail
- Risk Management
- Safety
- Sales
- Salon and Barbershop Business
- Science
- Service
- Social Media
- Social Responsibility
- Sustainability
- Technology
- Tools and Equipment
- Training
- Waste Management
- Web Design
-
 Internet Of Things IoT Implementation At Workplace Illustration
This PowerPoint Illustration features a colorful illustration of a workplace with an IoT implementation. Its perfect for illustrating the concept of how IoT can be used to optimize operations and increase efficiency in the workplace.
-
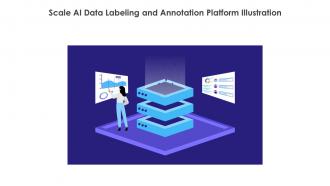 Scale AI Data Labeling And Annotation Platform Illustration
Scale AIs Data Labeling and Annotation Platform is a powerful tool for quickly and accurately labeling and annotating data. It features a colourful Illustration , making it easy to use and navigate. Its intuitive interface allows users to quickly label and annotate data with ease.
-
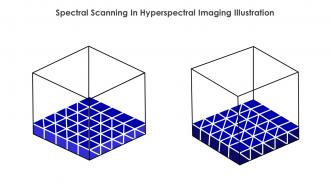 Spectral Scanning In Hyperspectral Imaging Illustration
This coloured powerpoint Illustration illustrates the process of spectral scanning in hyperspectral imaging, a technique used to capture and analyse the entire spectrum of light emitted from an object. It is a powerful tool for identifying materials, monitoring environmental changes and more.
-
 Document File Storage Management System Illustration
This colourful PowerPoint Illustration is a visual representation of a File Management System. It is ideal for presentations and documents related to data storage, organization, and retrieval. It is a great way to illustrate the concepts of file management and storage.
-
 EDW System To Improve Business Operational Efficiency Illustration
This coloured PowerPoint Illustration is a visual representation of EDW System to Improve Operational Efficiency. It is designed to help businesses streamline their processes and increase efficiency, resulting in improved productivity and cost savings.
-
 Forgot Social Media Account Handle Password Illustration
This coloured PowerPoint Illustration is perfect for reminding users to reset their forgotten social media handle passwords. It features a bright and cheerful design, making it easy to spot and remember. Its a great visual aid to help users stay organized and secure.
-
 Keyword Research SEO Strategies Illustration
This coloured PowerPoint Illustration is a great visual representation of Search Engine Optimization SEO. It features a magnifying glass and a chart, making it perfect for presentations about SEO strategies and tactics.
-
 Procedure For Successful Website Launch Illustration
This coloured PowerPoint Illustration provides a visual representation of the steps necessary for a successful website launch. It includes key elements such as planning, design, development, testing, and launch. It is a great resource for anyone looking to ensure their website launch is a success.
-
 Social Media Monitoring Web Traffic Analysis Illustration
This colourful PowerPoint Illustration is perfect for presentations on social media traffic analytics. It features a graph chart with multiple bars and a magnifying glass, representing the analysis of data. Ideal for business and marketing presentations.
-
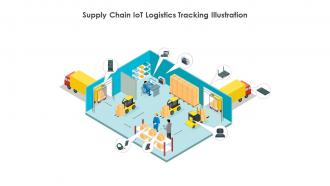 Supply Chain IoT Logistics Tracking Illustration
This coloured PowerPoint Illustration depicts a supply chain IoT asset tracking system, with a focus on the interconnectedness of the various components and the data flows between them. It is an ideal visual aid for presentations on the benefits of using IoT to monitor and manage assets in a supply chain.
-
 Chatgpt Open AI Powered Technology Illustration
ChatGPT is an open AI powered technology that provides coloured powerpoint Illustration s to help you create stunning presentations. With its intuitive design and user-friendly interface, it makes it easy to create professional-looking slides in no time. Its the perfect tool for business professionals and students alike.
-
 Code Programming For App Or Website Illustration
This colourful PowerPoint Illustration is perfect for representing code programming for apps or websites. It features an image of a computer with a code script on the screen, and is sure to add a professional touch to any presentation.
-
 Digital Wallet Mobile Payment Online Shopping Illustration
This coloured powerpoint Illustration is an illustration of a digital wallet. It is a vibrant and modern design, perfect for presentations about digital payment, online banking, and other financial topics.
-
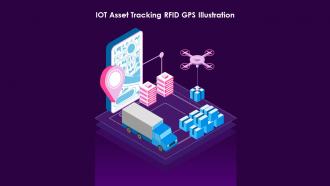 Iot Asset Tracking Rfid Gps Illustration
This PowerPoint Illustration is perfect for illustrating IOT Asset Tracking. It features a blue background with a tracking Illustration in the center, a globe, and a connected network of lines. Its a great visual representation of the power of IOT Asset Tracking.
-
 Mobile Marketing Advertising Sms Illustration
This colourful PowerPoint Illustration is perfect for presentations on mobile marketing. It features a mobile phone with a colourful background, conveying the importance of mobile marketing in todays digital world. Use this Illustration to illustrate your points and engage your audience.
-
 SEO Keyword Research Meta Tags Illustration
This coloured powerpoint Illustration is perfect for presentations on SEO topics. It is designed to be eye-catching and easily recognizable, helping to make your presentation stand out. The Illustration is bright and vibrant, adding a splash of colour to your slides. It is sure to help you make a lasting impression on your audience.
-
 AI ChatGPT Natural Language Processing Machine Learning Illustration
This coloured PowerPoint Illustration is a representation of AI ChatGPT, a powerful Artificial Intelligence tool that enables users to generate natural language conversations with ease. It is a great tool for businesses to quickly create automated customer support and marketing conversations.
-
 Blood Test Slide Medical Diagnosis Laboratory Analysis Illustration
This coloured PowerPoint Illustration depicts a blood test slide, with a clear background and a red drop of blood in the centre. It is a great visual aid for presentations on medical topics, such as blood tests, blood donation, or diseases.
-
 Pipette Laboratory Equipment Liquid Handling Illustration
This coloured powerpoint Illustration is a great way to add visual interest to your presentation. It features a pipette filled with a bright, vibrant colour to help bring your message to life. Perfect for adding a splash of colour to any presentation.
-
 Blockchain Process Flow For Advanced Logistics Illustration
This coloured powerpoint Illustration provides a visual representation of the blockchain process flow for advanced logistics solutions. It is an essential tool for understanding the complexities of supply chain management and the potential of blockchain technology.
-
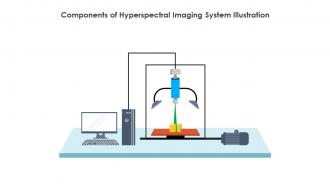 Components Of Hyperspectral Imaging System Illustration
This coloured PowerPoint Illustration illustrates the components of a hyperspectral imaging system, including a light source, a spectrometer, a detector, and a processor. It is perfect for presentations on hyperspectral imaging technology, and can be used to explain the basics of the system in a visually engaging way.
-
 Comprehensive Guide To Begin AIOps Journey Illustration
This comprehensive guide provides a step-by-step approach to starting an AIOps journey. Learn how to leverage AI and automation to improve IT operations and gain insights into your IT environment. Get the most out of your AIOps journey with this coloured powerpoint Illustration.
-
 Email Based Phishing Attacks Prevention IT Illustration
This colored PowerPoint Illustration provides a comprehensive overview of email-based phishing attacks and how to prevent them. It covers topics such as identifying suspicious emails, understanding phishing tactics, and implementing security measures.
-
 Healthcare Cyber Security Compliance Data Encryption Illustration
This coloured PowerPoint Illustration is designed to represent healthcare cyber security. It features a blue shield with a white cross in the center, symbolizing protection against malicious cyber threats. It is a perfect visual aid for any presentation on the importance of cyber security in healthcare.
-
 Hyperspectral Imaging Technology Illustration
This coloured Illustration depicts Hyperspectral Imaging Technology, a powerful tool for gathering data from the electromagnetic spectrum. It can be used to identify and distinguish objects, materials, and environments. It is an invaluable tool for many industries.
-
 Isometric Server Room And Big Data Illustration
This isometric server room and big data Illustration is a vibrant and eye-catching way to represent your data center. The colorful and detailed image is perfect for presentations, websites, and more. Get your message across with this powerful visual representation of your data center.
-
 Push Broom Scanning In Hyperspectral Imaging Illustration
This coloured PowerPoint Illustration illustrates the use of push broom scanning in hyperspectral imaging. It is a powerful tool for collecting and analysing data from a wide range of wavelengths. It is a great way to quickly and accurately gather information from a scene.
-
 Spatio Spectral Scanning Remote Sensing Image Illustration
This coloured PowerPoint Illustration provides an overview of different modes to generate a hyperspectral image, such as pushbroom, whiskbroom, and snapshot. It is an ideal visual aid to help understand the concept of hyperspectral imaging.
-
 Working Principles Hyperspectral Imaging Technology Illustration
This coloured PowerPoint Illustration illustrates the working principles of hyperspectral imaging technology. It is a powerful tool for capturing and analysing data from the electromagnetic spectrum, providing detailed information about the composition of objects.
-
 Bitcoin Cryptocurrency Blockchain Illustration
This coloured PowerPoint Illustration is a representation of Bitcoin, the worlds first decentralized digital currency. It features a gold coin with the Bitcoin logo in the center, set against a bright blue background. Perfect for presentations about cryptocurrency, finance, and digital currency.
-
 Data Analysis Data Mining Machine Learning Illustration
This colourful Illustration is perfect for data analysis presentations. It is a visual representation of data analysis, with a graph and magnifying glass to show the process of collecting and analyzing information. It is a great way to illustrate the importance of data analysis in business.
-
 Data Analytical Research Analysis Statistical Illustration
This colourful PowerPoint Illustration is perfect for illustrating data analytical research. It features a magnifying glass and a graph, representing the process of collecting and analyzing data. Its ideal for presentations, reports, and other documents.
-
 Data Analytics Business Intelligence Machine Learning Illustration
This colourful PowerPoint Illustration is perfect for presentations on data analytics. It features a colourful chart with a magnifying glass, representing the analysis of data. Its a great way to add visual interest and emphasis to your presentation.
-
 Data Security Encryption Access Control Illustration
This coloured PowerPoint Illustration depicts a data security concept, with a padlock and a key to represent secure data protection. It is ideal for presentations on data protection, cyber security, and other related topics.
-
 Global Data Security Encryption Cyber Security Illustration
This coloured PowerPoint Illustration provides a visually appealing representation of global data security. It is perfect for presentations and other documents to illustrate the importance of protecting data across the world.
-
 Graph Analysis Network Analysis Data Visualization Illustration
This coloured powerpoint Illustration is perfect for visualizing the results of your graph analysis. It features a graph with a colourful background, making it easy to interpret and understand. Perfect for presentations, reports and other documents.
-
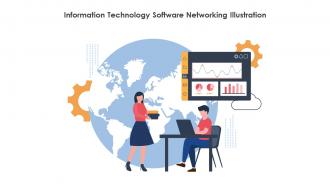 Information Technology Software Networking Illustration
This PowerPoint Illustration is perfect for any Information Technology presentation. It is a vibrant colour that will draw your audiences attention and make your message stand out. It is easy to use and can be added to any presentation quickly.
-
 Naas Overview AI Artificial Intelligence Machine Learning Illustration
This AI powered presentation Illustration is a great way to quickly create stunning visuals for your presentations. Its a vibrant and colourful Illustration that will add a professional touch to your slides. Its easy to use and will help you make a lasting impression.
-
 Private Blockchain Decentralized Ledger Cryptocurrency Illustration
This colourful PowerPoint Illustration is an illustration of a private blockchain. It depicts a secure, distributed ledger technology that allows for secure data sharing and storage. Perfect for presentations on blockchain technology, digital security, and data privacy.
-
 Comprehensive Guide To Mobile Cloud Computing Illustration
This Comprehensive Guide to Mobile Cloud Computing PowerPoint Illustration features a vibrant blue and yellow colour palette, perfect for illustrating the complexities of mobile cloud computing. It is ideal for presentations, websites, and other digital projects.
-
 Inbound Logistics Supply Chain Management Illustration
This colourful PowerPoint Illustration is an ideal visual aid to help promote mall event marketing strategies to drive sales revenue and customer engagement. It is an easy to use and visually appealing resource for any marketing professional.
-
 Cloud Computing Virtualization Infrastructure As A Service Illustration
This colourful PowerPoint Illustration depicts cloud computing, a technology used to store and access data and programs over the internet. It is a great visual aid for presentations on the topic of cloud computing, and can be used to illustrate the concept in a simple and effective way.
-
 Natural Language Processing Information Technology Illustration
This coloured PowerPoint Illustration depicts Natural Language Processing, a branch of Artificial Intelligence that enables computers to understand, interpret and manipulate human language. It is a powerful tool for analyzing text and extracting valuable insights.
-
 Natural Language Processing IT Machine Learning Illustration
This coloured PowerPoint Illustration depicts Natural Language Processing, a branch of Artificial Intelligence that enables computers to understand, interpret and manipulate human language. It is a powerful tool for analyzing text and extracting valuable insights.
-
 Research Project Data Analysis Research Methodology Illustration
This coloured PowerPoint Illustration is perfect for representing a research project. It features a magnifying glass over a stack of books, symbolizing exploration and knowledge. The vibrant colours will make your slides stand out and draw attention to your research.
-
 Agile Development Workflow Software Development Illustration
This colourful PowerPoint icon is perfect for illustrating Agile Development Workflow. It features a series of steps, each with its own colour, to help you visualise the process. Its ideal for presentations, reports, and other documents.
-
 Lead Generation Prospecting Targeting Illustration
This colourful PowerPoint icon is perfect for illustrating lead generation. It features an arrow pointing upwards, with a bright blue background and a white outline. Its a great way to visually represent the process of capturing leads and turning them into customers.
-
 Structure Of Smart Home Security System Illustration
This coloured PowerPoint icon depicts the structure of a smart home security system, with a central control unit, multiple sensors, and a user interface. It is ideal for illustrating the components of a home security system and how they interact with each other.
-
 Successful Website Launch Technology Illustration
This PowerPoint icon offers a visual representation of the steps needed for a successful website launch. It features a colourful, easytounderstand design that outlines the procedure from planning to launch.
-
 Analyze Data Data Analysis Data Mining Illustration
This colourful PowerPoint icon depicts a person analyzing data. It is perfect for presentations about data analysis, data science, and data visualization. It can be used to illustrate the importance of data analysis and its impact on decision-making.
-
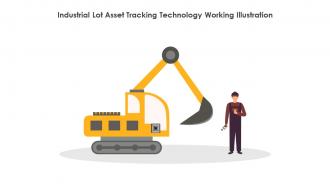 Industrial Lot Asset Tracking Technology Working Illustration
This coloured PowerPoint icon depicts Industrial Lot Asset Tracking Technology, a powerful tool for businesses to track inventory, optimize supply chain operations, and reduce costs. It provides real-time visibility into asset locations, performance, and usage, enabling efficient and accurate asset management.
-
 IoT Asset Tracking And Monitoring For Fleet Management Illustration
This coloured PowerPoint icon depicts IoT asset tracking and monitoring for fleet management. It provides real-time visibility of fleet assets, allowing for improved operational efficiency, reduced costs, and enhanced customer service.
-
 Machine Learning Artificial Intelligence Illustration
This coloured PowerPoint icon represents Natural Language Processing IT. It is ideal for presentations, reports, and other documents to illustrate the concept of NLP. It is bright and vibrant, and will add a professional, modern touch to any project.
-
 Natural Language Processing IT Illustration
This coloured PowerPoint icon is a perfect visual representation of Natural Language Processing NLP, a branch of Artificial Intelligence used for understanding and interpreting human language. It is a great addition to any presentation on the topic, helping to explain and illustrate the concept in a clear and concise manner.
-
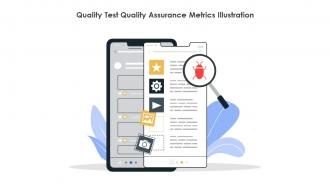 Quality Test Quality Assurance Metrics Illustration
This coloured PowerPoint icon is perfect for presentations on Quality Testing. It features a vibrant blue, green and yellow colour palette, and a simple design that will help convey your message effectively. The icon is a great visual aid to help explain the importance of quality testing.
-
 SAAS Cloud Computing Software As A Service Illustration
This coloured powerpoint icon is perfect for SAAS presentations, providing a modern and professional look. It is easy to use and is available in a range of colours to suit any presentation. It is a great way to make your slides stand out and create a professional finish.
-
 Smart Home Systems Automation Connected Devices Illustration
This colourful powerpoint icon is perfect for presentations on Smart Home Systems. It features a house with a blue roof and a green door, and is sure to make your presentation stand out.
-
 Alibaba Cloud SaaS Platform Implementation Guide Illustration
This coloured PowerPoint icon provides a comprehensive guide to the implementation of Alibaba Cloud SaaS Platform, including step-by-step instructions and best practices. It is an essential resource for businesses looking to leverage the power of the cloud.
-
 Building Security Awareness To Minimize Cybersecurity Threats Illustration
This colourful PowerPoint icon is a great visual aid for building security awareness among the workforce to minimize cybersecurity threats. It is designed to help educate employees on the importance of cybersecurity and how to protect their data and systems from malicious attacks.
-
 Data Research Analysis Collection Illustration
This coloured PowerPoint icon is perfect for presentations on data research. It features a magnifying glass and a graph, symbolizing the process of data collection and analysis. The vibrant colours make it stand out and help to convey the message quickly and effectively.
-
No second thoughts when I’m looking for excellent templates. SlideTeam is definitely my go-to website for well-designed slides.
-
“The presentation template I got from you was a very useful one.My presentation went very well and the comments were positive.Thank you for the support. Kudos to the team!”
-
The customer care of SlideTeam is very responsive. I was having a payment issue and they fixed it for me in no time.
-
A fantastic collection of templates. I'll likely use this as my go-to resource for future templates and support.
-
It saves your time and decrease your efforts in half.
-
These stunning templates can help you create a presentation like a pro.
-
The templates are handy and I can personalize them as per my needs. Glad to be your subscriber!
-
Informative and engaging! I really like the design and quality of the slides.
-
The way SlideTeam professionals work is exceptional. Thanks for being so helpful!
-
If you have visited their site and failed to find the products, try reaching the customer service because it will be the case that you didn't use the search bar well.


