Human Resource Optimization Powerpoint Presentation Slides
Increase the productivity of your organization by employing our Human Resource Optimization PowerPoint Presentation Slides. Highlight the need for optimally utilizing the resources in the company and the issues encountered due to inadequate management of the resources with the help of our workforce optimization PPT templates. Poor resource planning and allocation results in havoc for the organization. Therefore, our personnel management PPT presentation helps you to formulate a well-researched business plan. For a better understanding, compare the past and present data on employees and their contribution by taking aid of this human resource planning PPT slideshow. Display your foresightedness by creating a plan of action for the future training and development of the employees. Download these completely adaptable human capital planning PPT graphics and convey your mission, vision, and objectives by giving it your orientation. Impress your audience by providing an overall impact analysis of the resource optimization and the increased profitability for your organization with this workforce training PPT layouts.
You must be logged in to download this presentation.
 Impress your
 audience
Editable
of Time
PowerPoint presentation slides
Presenting our Human Resource Optimization Powerpoint Presentation Slides. This is a 100% editable and adaptable PPT slide. You can save it in different formats like PDF, JPG, and PNG. It can be edited with different color, font, font size, and font type of the template as per your requirements. This template supports the standard (4:3) and widescreen (16:9) format. It is also compatible with Google slides.
People who downloaded this PowerPoint presentation also viewed the following :
Content of this Powerpoint Presentation
Slide 1: This title slide introduces Human Resource Optimization. Add the name of your company here.
Slide 2: This slide contains the Table of Contents. It includes – Overview, Current Scenario, Future Scenario, etc.
Slide 3: This is a table of content slide showing the Overview.
Slide 4: This slide presents the Status of Current Projects Assigned.
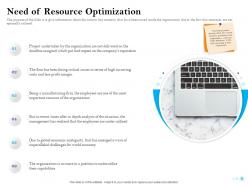
Slide 5: This slide presents the Need of Resource Optimization.
Slide 6: This slide presents the Concerns at Business Level.
Slide 7: This slide presents the Competitive Analysis.
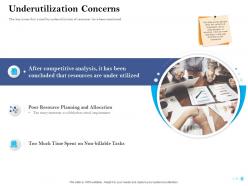
Slide 8: This slide presents the Underutilization Concerns.
Slide 9: This is a table of content slide showing the Current Scenario
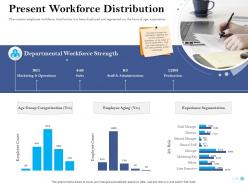
Slide 10: This slide presents the Present Workforce Distribution.
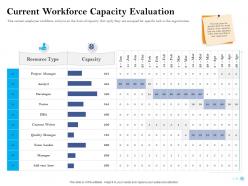
Slide 11: This slide presents the Current Workforce Capacity Evaluation.
Slide 12: This slide presents the Skills Level Analysis by Department.
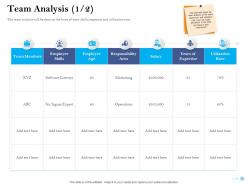
Slide 13: This slide presents the Team Analysis (1/2).
Slide 14: This slide presents the Team Analysis (2/2).
Slide 15: This slide presents the Overall Team Utilization.
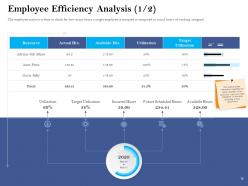
Slide 16: This slide presents the Employee Efficiency Analysis (1/2). The employee analysis is done to check for how many hours a single employee is occupied as compared to actual hours of working assigned.
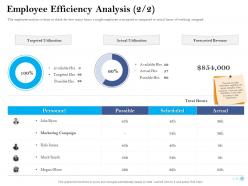
Slide 17: This slide presents the Employee Efficiency Analysis (2/2). This slide provides information regarding the actual utilization of the resources.
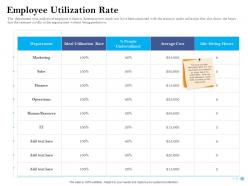
Slide 18: This slide presents the Employee Utilization Rate.
Slide 19: This is a table of content slide showing the Future Scenario.
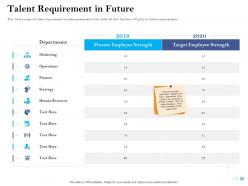
Slide 20: This slide presents the Talent Requirement in Future.
Slide 21: This slide presents the Department Wise Resource Allocation in Future.
Slide 22: This is a table of content slide showing the Action Plan – Training.
Slide 23: This slide presents the Need of Training.
Slide 24: This slide presents the Types of Training.
Slide 25: This slide presents the Internal Training of Employees.
Slide 26: This slide presents the 30 60 90 Plan for Internal Training.
Slide 27: This slide presents the External Training Schedule with Cost.
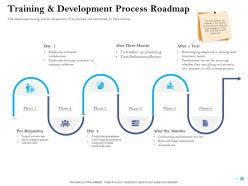
Slide 28: This slide presents the Training & Development Process Roadmap.
Slide 29: This is a table of content slide showing the Overall Impact Analysis.
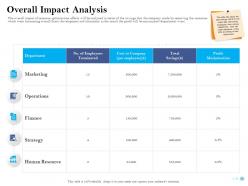
Slide 30: This slide presents the Overall Impact Analysis. The overall impact of resource optimization efforts will be analyzed in terms of the savings that the company made by removing the resources
Slide 31: This slide presents the Overall Impact Analysis. (Contd…) - This slide provides a glimpse of the improved utilization rate in the organization and the associated benefits.
Slide 32: This is the Human Resource Optimization - Icons Slide.
Slide 33: This slide introduces the Additional Slides.
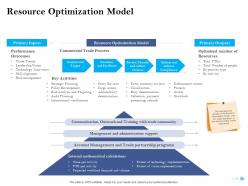
Slide 34: This slide presents the Resource Optimization Model.
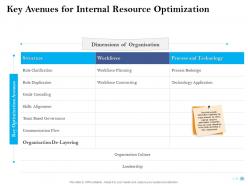
Slide 35: This slide presents the Key Optimization Avenues.
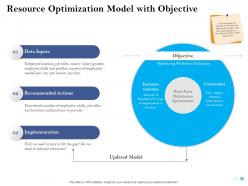
Slide 36: This slide presents the Resource Optimization Model with Objective.
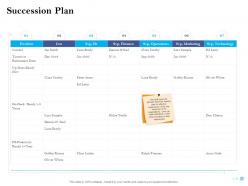
Slide 37: This slide presents the Succession Plan.
Slide 38: This slide contains the information about the company aka the ‘About Us’ section. This includes the Value Clients, the Target Audience, and Preferred by Many.
Slide 39: This slide provides the Mission for the entire company. This includes the vision, the mission, and the goal.
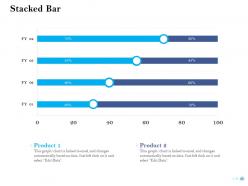
Slide 40: This slide shows a Stacked Bar that compares 2 products’ data over a timeline of financial years.
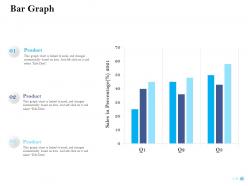
Slide 41: This slide shows a Bar Graph that compares 3 products’ sales over a timeline of financial quarters.
Slide 42: This is the Lego slide. In this slide, you can showcase the building blocks of your project or concept.
Slide 43: This is the Financial slide.
Slide 44: This is the Mind Map slide for brainstorming ideas.
Slide 45: This slide is a Timeline template to showcase the progress of the steps of a project with time.
Slide 46: This is a Thank You slide where details such as the address, contact number, email address are added.
Human Resource Optimization Powerpoint Presentation Slides with all 46 slides:
Use our Human Resource Optimization Powerpoint Presentation Slides to effectively help you save your valuable time. They are readymade to fit into any presentation structure.
-
Thanks for all your great templates they have saved me lots of time and accelerate my presentations. Great product, keep them up!
-
Illustrative design with editable content. Exceptional value for money. Highly pleased with the product.
-
Excellent design and quick turnaround.
-
Graphics are very appealing to eyes.


