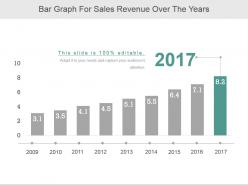
Graphique à barres des revenus des ventes au fil des années
Notre graphique à barres pour le chiffre d'affaires des ventes au fil des années suit un affichage personnalisé. Obtenez l'affichage de tous les détails selon vos souhaits.
You must be logged in to download this presentation.
 Impress your
 audience
Editable
of Time
Caractéristiques de ces diapositives de présentation PowerPoint :
Présentation d'un graphique à barres pour le chiffre d'affaires au fil des années. Ceci est un graphique à barres pour le chiffre d'affaires au fil des années. Il s'agit d'un processus en neuf étapes. Les étapes de ce processus sont : entreprise, marketing, croissance, barre, années.
People who downloaded this PowerPoint presentation also viewed the following :
Graphique à barres des revenus des ventes au fil des années avec les 5 diapositives : 1. Revenus des ventes en 2018 : 2,5 millions d'euros 2. Revenus des ventes en 2019 : 3 millions d'euros 3. Revenus des ventes en 2020 : 2,8 millions d'euros 4. Revenus des ventes en 2021 : 3,2 millions d'euros 5. Revenus des ventes en 2022 : 3,5 millions d'euros
Nos graphiques à barres des revenus des ventes au fil des années sont à votre disposition. Nous sommes prêts à vous apporter toute l'assistance nécessaire.
-
Much better than the original! Thanks for the quick turnaround.
-
Innovative and attractive designs.


