Dashboards Measuring PowerPoint Designs, Presentations Slides & PPT Shapes
- Sub Categories
-
- Arrows and Targets
- Bullet and Text Slides
- Charts and Graphs
- Circular Cycle Diagrams
- Concepts and Shapes
- Custom Flat Designs
- Dashboards and Measuring
- Flow Process
- Funnels
- Gears
- Growth
- Harvey Balls
- Idea Innovation and Light Bulbs
- Leadership
- Linear Process Diagrams
- Magnifying Glass
- Misc Other Graphics
- Opportunity and Handshake
- Organization Charts
- Puzzles
- Pyramids
- Roadmaps and Timelines
- Silhouettes
- Steps
- Strategic Planning Analysis
- SWOT Analysis
- Tables and Matrix
- Teamwork
- Technology and Communication
- Venn Diagrams
- Visuals and Illustrations
-
 Market overview of a marketing plan ppt summary
Presenting market overview of a marketing plan ppt summary. This is a market overview of a marketing plan ppt summary. This is a eight stage process. The stages in this process are number of competitors, number of companies that exited, replacement, rate industrial cameras, replacement, rate frame, grabbers, average product development time industrial cameras, average product development time frame grabbers, r and d spend as a per cent of market revenue, marketing spend as a per cent of market revenue.
-
 Sales tracking dashboard powerpoint slide designs download
Presenting sales tracking dashboard powerpoint slide designs download. Presenting sales tracking dashboard powerpoint slide designs download. Presenting sales tracking dashboard powerpoint slide designs download. Presenting sales tracking dashboard powerpoint slide designs download. This is a sales tracking dashboard powerpoint slide designs download. This is a three stage process. The stages in this process are business, dashboard, strategy, marketing, management, presentation.
-
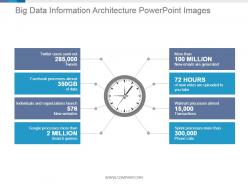
 Big data information architecture powerpoint images
Presenting big data information architecture powerpoint images. This is a big data information architecture powerpoint images. This is a eight stage process. The stages in this process are twitter users send out tweets, facebook processes almost of data, individuals and organizations launch new websites, google processes more than search queries, more than new emails are generated, of new video are uploaded to you tube, walmart processes almost transactions, sprint processes more than phone calls.
-
 Effective time management key benefits powerpoint graphics
Presenting effective time management key benefits powerpoint graphics. This is a effective time management key benefits powerpoint graphics. This is a two stage process. The stages in this process are increase savings, process improvement, motivating employees, financial security balanced, growth.
-
 Big data benefits pie chart for business powerpoint show
Presenting big data benefits pie chart for business powerpoint show. This is a big data benefits pie chart for business powerpoint show. This is a four stage process. The stages in this process are increased efficiency, better business decision making, improved customer experience and engagement, achieved financial savings.
-
 Big data opportunities and challenges ppt slide templates
Presenting big data opportunities and challenges ppt slide templates. This is a big data opportunities and challenges ppt slide templates. This is a three stage process. The stages in this process are business, marketing, finance, success, percentage.
-
 Gender comparison pie chart powerpoint slide show
Presenting gender comparison pie chart powerpoint slide show. This is a gender comparison pie chart powerpoint slide show. This is a two stage process. The stages in this process are women, men.
-
 Revenue speedometer dashboard snapshot ppt diagrams
Presenting revenue speedometer dashboard Snapshot ppt diagrams. This is a revenue speedometer dashboard ppt diagrams. This is a three stage process. The stages in this process are business, marketing, success, dashboard, percentage.
-
 Performance measurement and comparison dashboard snapshot ppt design
Presenting performance measurement and comparison dashboard snapshot ppt design. This is a performance measurement and comparison dashboard ppt design. This is a three stage process. The stages in this process are series, qtr.
-
 Business performance four point dashboard snapshot ppt slide
Presenting business performance four point dashboard snapshot ppt slide. This is a business performance four point dashboard ppt slide. This is a four stage process. The stages in this process are business, success, dashboard, finance, strategy.
-
 Digital media performance evaluation ppt background
Presenting digital media performance evaluation ppt background. This is a digital media performance evaluation ppt background. This is a three stage process. The stages in this process are traffic, engagement, conversion.
-
 Media budget optimization chart sample of ppt
Presenting media budget optimization chart sample of ppt. This is a media budget optimization chart sample of ppt. This is a two stage process. The stages in this process are media spend, traffic, sales, online, offline.
-
 Media kpi development sales funnel ppt slide
Presenting media kpi development sales funnel ppt slide. This is a media kpi development sales funnel ppt slide. This is a four stage process. The stages in this process are visitors, leads, marketing qualified leads, sales qualified leads, decision, consideration, awareness.
-
 Product performance dashboard ppt slide design
Presenting product performance dashboard ppt slide design. This is a product performance dashboard ppt slide design. This is a three stage process. The stages in this process are business, marketing, strategy, analysis, management.
-
 Capital asset pricing model powerpoint themes
Presenting capital asset pricing model powerpoint themes. This is a capital asset pricing model powerpoint themes. This is a two stage process. The stages in this process are our cost.
-
 Salesforce dashboard powerpoint slide presentation tips
Presenting salesforce dashboard powerpoint slide presentation tips. This is a salesforce dashboard powerpoint slide presentation tips. This is a two stage process. The stages in this process are business, marketing, dashboard, management, planning.
-
 Brand marketing campaign report powerpoint guide
Presenting brand marketing campaign report powerpoint guide. This is a brand marketing campaign report powerpoint guide. This is a four stage process. The stages in this process are brand safety, industry snapshot, viewability, tra score, ad fraud.
-
 Product performance dashboard powerpoint slide information
Presenting product performance dashboard powerpoint slide information. This is a product performance dashboard powerpoint slide information. This is a one stage process. The stages in this process are business, success, dashboard, measure, strategy.
-
 Evaluating advertising agency on parameters dashboard ppt templates
Presenting evaluating advertising agency on parameters dashboard ppt templates. This is a evaluating advertising agency on parameters dashboard ppt templates. This is a four stage process. The stages in this process are ad fraud, industry snapshot, view ability, brand safety.
-
 Sales performance reporting dashboard powerpoint template
Presenting sales performance reporting dashboard powerpoint template. This is a sales performance reporting dashboard powerpoint template. This is a three stage process. The stages in this process are dashboard, management, process, strategy, analysis.
-
 Dashboard powerpoint slide background
Presenting dashboard powerpoint slide background. This is a dashboard powerpoint slide background. This is a one stage process. The stages in this process are dashboard, meter, measure, speed, percentage.
-
 Customer segmentation dashboard speedometer powerpoint slide
Presenting customer segmentation dashboard speedometer powerpoint slide. This is a customer segmentation dashboard speedometer powerpoint slide. This is a three stage process. The stages in this process are dashboard, measurement, business, strategy, success.
-
 Business cost reduction comparison dashboard snapshot ppt ideas
Presenting business cost reduction comparison dashboard ppt ideas. This is a business cost reduction comparison dashboard snapshot ppt ideas. This is a four stage process. The stages in this process are business, meter, measure, reduction, cost.
-
 Annual project performance dashboard snapshot ppt slide show
Presenting annual project performance dashboard snapshot ppt slide show. This is a annual project performance dashboard ppt slide show. This is a four stage process. The stages in this process are business, bar graph, dashboard, measure, value.
-
 Business goal performance dashboard snapshot ppt slide styles
Presenting business goal performance dashboard ppt slide styles. This is a business goal performance dashboard snapshot ppt slide styles. This is a one stage process. The stages in this process are business, bar graph, dashboard, measure, value.
-
 Financial reporting and analysis pie chart ppt slide
Presenting financial reporting and analysis pie chart ppt slide. This is a financial reporting and analysis pie chart ppt slide. This is a four stage process. The stages in this process are finance, marketing, percentage, process, success.
-
 Improved customer service experience pie charts ppt images
Presenting improved customer service experience pie charts ppt images. This is a improved customer service experience pie charts ppt images. This is a four stage process. The stages in this process are increased efficiency, better business decision making, improved customer experience and engagement, achieved financial savings.
-
 Revenue performance reporting speedometer ppt images
Presenting revenue performance reporting speedometer ppt images. This is a revenue performance reporting speedometer ppt images. This is a four stage process. The stages in this process are dashboard, measure, percentage, business, marketing.
-
 3 point dashboard for project management example of ppt
Presenting 3 point dashboard for project management example of ppt. This is a 3 point dashboard for project management example of ppt. This is a three stage process. The stages in this process are dashboard, measurement, technology, percentage, business.
-
 Site performance dashboard analytics ppt images gallery
Presenting site performance dashboard analytics ppt images gallery. This is a site performance dashboard analytics ppt images gallery. This is a four stage process. The stages in this process are site performance,dashboard,analytics,financial,product.
-
 Web performance dashboard snapshot ppt samples
This is a web performance dashboard snapshot ppt samples. This is a one stage process. The stages in this process are web performance,dashboard,presentation,analysis.
-
 Sales activity dashboard snapshot ppt samples
Presenting sales activity dashboard snapshot ppt samples. This is a sales activity dashboard ppt samples. This is a four stage process. The stages in this process are sales, activity, dashboard, financial, strategy.
-
 Product sales analysis report ppt presentation examples
Presenting product sales analysis report ppt presentation examples. This is a product sales analysis report ppt presentation examples. This is a five stage process. The stages in this process are analysis, business, marketing, strategy, success, management, growth.
-
 Sales analysis dashboard snapshot ppt design templates
Presenting sales analysis dashboard Snapshot ppt design templates. This is a sales analysis dashboard ppt design templates. This is a three stage process. The stages in this process are analysis, dashboard, business, marketing, strategy, success.
-
 Business sales funnel report powerpoint slide template
Presenting business sales funnel report powerpoint slide template. This is a business sales funnel report powerpoint slide template. This is a three stage process. The stages in this process are business, funnel, strategy, arrow, process.
-
 Dashboard for team performance powerpoint slide graphics
Presenting dashboard for team performance powerpoint slide graphics. This is a dashboard for team performance powerpoint slide graphics. This is a three stage process. The stages in this process are dashboard, business, finance, strategy, marketing.
-
 Global internet users statistics powerpoint layout
Presenting global internet users statistics powerpoint layout. This is a global internet users statistics powerpoint layout. This is a three stage process. The stages in this process are numbers of internet users, numbers of mobile users, numbers of social media users, number of internet users are increasing.
-
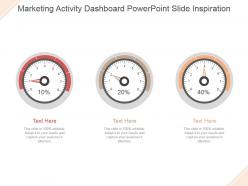
 Marketing activity dashboard powerpoint slide inspiration
Presenting marketing activity dashboard powerpoint slide inspiration. This is a marketing activity dashboard powerpoint slide inspiration. This is a three stage process. The stages in this process are dashboard, percentage, finance, measurement, business.
-
 Dashboard for quality assurance powerpoint slide show
Presenting dashboard for quality assurance powerpoint slide show. This is a dashboard for quality assurance powerpoint slide show. This is a four stage process. The stages in this process are dashboard, management, business, marketing, speedometer.
-
 Three speedometers for defining future sales goal ppt slide examples
Presenting three speedometers for defining future sales goal ppt slide examples. This is a three speedometers for defining future sales goal ppt slide examples. This is a three stage process. The stages in this process are business, marketing, planning, presentation, technology.
-
 Crowdfunding disadvantages powerpoint templates
Presenting crowdfunding disadvantages powerpoint templates. This is a crowdfunding disadvantages powerpoint templates. This is a one stage process. The stages in this process are disadvantages, med, low, high, time consuming, all or nothing, unrealistic expectations, hard work, lots of planning required, chances you wont get funded.
-
 Business progress growth dashboard powerpoint show
Presenting business progress growth dashboard powerpoint show. This is a business progress growth dashboard powerpoint show. This is a five stage process. The stages in this process are business, marketing, dashboard, measure, management.
-
 Marketing team performance dashboard ppt inspiration
Presenting marketing team performance dashboard ppt inspiration. This is a marketing team performance dashboard ppt inspiration. This is a four stage process. The stages in this process are peter smith, marry smith, carol smith, anita smith, peter smith, reward, completion, overdue plans, problems, summary, finished what he planned, doesnt complete his plans, shows initiative, didnt submit a report, overdue, progress, plan and problems, reward.
-
 Performance Management Kpi Dashboard Snapshot Ppt Slide
Presenting performance management kpi dashboard snapshot ppt slide. This is a performance management kpi dashboard ppt slide. This is a five stage process. The stages in this process are product, sold products, compare to, south, north, actual, change, successful adverts, jan, feb, mar, apr, earned revenue, average, target, outcasts, operations.
-
 4 speedometers dashboard for project management good ppt example
Presenting 4 speedometers dashboard for project management good ppt example. This is a 4 speedometers dashboard for project management good ppt example. This is a four stage process. The stages in this process are business, marketing, dashboard, measuring, management.
-
 Male and female workforce comparison ppt slides
Presenting male and female workforce comparison ppt slides. This is a male and female workforce comparison ppt slides. This is a two stage process. The stages in this process are by gender, male employees, new hires, left employment, female employees, senior managers m1 and above, managers and professionals, supports.
-
 Three dashboards for business reporting powerpoint slide presentation tips
Presenting three dashboards for business reporting powerpoint slide presentation tips. This is a three dashboards for business reporting powerpoint slide presentation tips. This is a three stage process. The stages in this process are business, marketing, dashboard, presentation, management.
-
 Strategic planning and performance dashboard snapshot ppt slide design
Presenting strategic planning and performance dashboard ppt slide design. This is a strategic planning and performance dashboard ppt slide design. This is a four stage process. The stages in this process are technology, business, marketing, success, communication.
-
 Social media data analysis powerpoint slide influencers
Presenting social media data analysis powerpoint slide influencers. This is a social media data analysis powerpoint slide influencers. This is a eight stage process. The stages in this process are facebook processes almost, individuals and organizations launch, new websites, google processes more than, search queries, twitter users send out, new emails are generated.
-
 Business performance metrics powerpoint ideas
Presenting business performance metrics powerpoint ideas. This is a business performance metrics powerpoint ideas. This is a four stage process. The stages in this process are execute strategy, deliver business values, enhance decision making, manage organizational change.
-
 Business payment plan powerpoint templates
Presenting business payment plan powerpoint templates. This is a business payment plan powerpoint templates. This is a two stage process. The stages in this process are installments, milestones, challenges, percentage, time management.
-
 Three dashboards for measuring digital marketing ppt summary
Presenting three dashboards for measuring digital marketing ppt summary. This is a three dashboards for measuring digital marketing ppt summary. This is a three stage process. The stages in this process are dashboard, measuring, business, marketing, percentage.
-
 Digital marketing reporting dashboard snapshot presentation examples
Presenting digital marketing reporting dashboard presentation examples. This is a digital marketing reporting dashboard presentation examples. This is a three stage process. The stages in this process are business, dashboard, speed, meter, marketing.
-
 Key analysis from paid search marketing powerpoint templates
Presenting key analysis from paid search marketing powerpoint templates. This is a key analysis from paid search marketing powerpoint templates. This is a two stage process. The stages in this process are budget, impressions, clicks, conversions, key stats, march change form february.
-
 2 point visual comparison chart sample of ppt
Presenting 2 point visual comparison chart sample of ppt. This is a 2 point visual comparison chart sample of ppt. This is a two stage process. The stages in this process are business, comparison, percentage, strategy, finance, success.
-
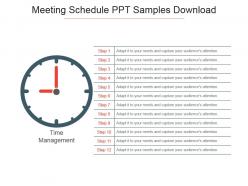
 Meeting schedule ppt samples download
Presenting meeting schedule ppt samples download. This is a meeting schedule ppt samples download. This is a one stage process. The stages in this process are time management, dashboard, business, marketing, planning.
-
 Employee engagement dashboard snapshot good ppt example
Presenting employee engagement dashboard snapshot good PPT example presentation slides. Simple data input like company logo, name or trademark. This PowerPoint template is fully supported by Google Slides. User can edit the data in linked excel sheet and graphs and charts gets customized accordingly. This layout offers fast downloading speed and formats can be easily changed to JPEG and PDF applications. This template is suitable for marketing, sales persons, business managers and entrepreneurs. Adjust PPT layout, font, text and color as per your necessity.
-
 Net promoter score scale template powerpoint graphics
Presenting net promoter score scale PPT template. This Presentation graphic is eloquent and beneficial for the students, researchers, specialists from various fields. The composition features of this PowerPoint image allow you to modify the appearance and layout. This PPT design has enough scope to insert the title or subtitles respectively. The impeccable Presentation design is well acquainted with all Google Slides. They also provide an option to add your business logo too.
-
 Net promoter score survey template powerpoint slide
Presenting Net Promoter Score Survey Template PowerPoint Slide. Made up of high-resolution graphics. Easy to download and can be saved in a variety of formats. Access to open on a widescreen preview. Compatible with the Google Slides and PowerPoint software. Edit the style, size, and the background of the slide icons as per your needs. Useful for business owners, students, and managers. Can be viewed on standard screen and widescreen without any fear of pixelation.
-
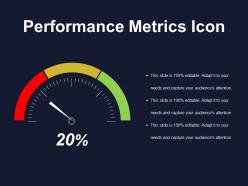
 Performance metrics icon powerpoint images
Presenting performance metrics icon PowerPoint images PPT slide. This performance metrics slide is easily downloadable and export it into JPEG or PDF format. A presenter can display this performance metrics icon slide in the standard or widescreen view. You can even amend the color, text, font type & font size, aspect ratio, etc. of performance metrics icon slide. The performance metrics icon template gets 100% synced with Google Slides and fully editable in PowerPoint. You can share this performance metrics icon slide easily with large segment due to its tremendous pixel quality. The performance metrics icon slide gets linked with the excel sheet.
-
Excellent work done on template design and graphics.
-
Appreciate the research and its presentable format.
-
Colors used are bright and distinctive.
-
Informative presentations that are easily editable.
-
Attractive design and informative presentation.
-
Presentation Design is very nice, good work with the content as well.
-
Great designs, really helpful.
-
Excellent Designs.
-
Informative design.
-
Visually stunning presentation, love the content.


