Dashboards Measuring PowerPoint Designs, Presentations Slides & PPT Shapes
- Sub Categories
-
- Arrows and Targets
- Bullet and Text Slides
- Charts and Graphs
- Circular Cycle Diagrams
- Concepts and Shapes
- Custom Flat Designs
- Dashboards and Measuring
- Flow Process
- Funnels
- Gears
- Growth
- Harvey Balls
- Idea Innovation and Light Bulbs
- Leadership
- Linear Process Diagrams
- Magnifying Glass
- Misc Other Graphics
- Opportunity and Handshake
- Organization Charts
- Puzzles
- Pyramids
- Roadmaps and Timelines
- Silhouettes
- Steps
- Strategic Planning Analysis
- SWOT Analysis
- Tables and Matrix
- Teamwork
- Technology and Communication
- Venn Diagrams
- Visuals and Illustrations
-
 Runtime binary search ppt powerpoint presentation ideas clipart images cpb
Presenting our Runtime Binary Search Ppt Powerpoint Presentation Ideas Clipart Images Cpb PowerPoint template design. This PowerPoint slide showcases six stages. It is useful to share insightful information on Runtime Binary Search This PPT slide can be easily accessed in standard screen and widescreen aspect ratios. It is also available in various formats like PDF, PNG, and JPG. Not only this, the PowerPoint slideshow is completely editable and you can effortlessly modify the font size, font type, and shapes according to your wish. Our PPT layout is compatible with Google Slides as well, so download and edit it as per your knowledge.
-
 Serial position curve ppt powerpoint presentation portfolio model cpb
Presenting our Serial Position Curve Ppt Powerpoint Presentation Portfolio Model Cpb PowerPoint template design. This PowerPoint slide showcases four stages. It is useful to share insightful information on Serial Position Curve This PPT slide can be easily accessed in standard screen and widescreen aspect ratios. It is also available in various formats like PDF, PNG, and JPG. Not only this, the PowerPoint slideshow is completely editable and you can effortlessly modify the font size, font type, and shapes according to your wish. Our PPT layout is compatible with Google Slides as well, so download and edit it as per your knowledge.
-
 Dashboard supply chain inventory optimization ppt pictures model
Present the topic in a bit more detail with this Dashboard Supply Chain Inventory Optimization Ppt Pictures Model. Use it as a tool for discussion and navigation on Low, Medium, High. This template is free to edit as deemed fit for your organization. Therefore download it now.
-
 Project portfolio report with priority and completion status
This graph or chart is linked to excel, and changes automatically based on data. Just left click on it and select edit data. Introducing our premium set of slides with Project Portfolio Report With Priority And Completion Status. Elucidate the three stages and present information using this PPT slide. This is a completely adaptable PowerPoint template design that can be used to interpret topics like Completed Projects, Projects In Progress, Mobile Application Development. So download instantly and tailor it with your information.
-
 Marketing dashboard template requirement gathering methods ppt powerpoint design
Introducing Marketing Dashboard Template Requirement Gathering Methods Ppt Powerpoint Design. to increase your presentation threshold. Encompassed with three stages, this template is a great option to educate and entice your audience. Dispence information on marketing dashboard, using this template. Grab it now to reap its full benefits.
-
 Numerical vs categorical data examples ppt powerpoint presentation pictures graphics design cpb
Presenting Numerical Vs Categorical Data Examples Ppt Powerpoint Presentation Pictures Graphics Design Cpb slide which is completely adaptable. The graphics in this PowerPoint slide showcase four stages that will help you succinctly convey the information. In addition, you can alternate the color, font size, font type, and shapes of this PPT layout according to your content. This PPT presentation can be accessed with Google Slides and is available in both standard screen and widescreen aspect ratios. It is also a useful set to elucidate topics like Numerical Vs Categorical Data Examples. This well-structured design can be downloaded in different formats like PDF, JPG, and PNG. So, without any delay, click on the download button now.
-
 Marketing dashboard template process of requirements management ppt infographics
Increase audience engagement and knowledge by dispensing information using Marketing Dashboard Template Process Of Requirements Management Ppt Infographics. This template helps you present information on one stage. You can also present information on marketing dashboard using this PPT design. This layout is completely editable so personaize it now to meet your audiences expectations.
-
 Dashboard customer retention and engagement planning ppt pictures graphics
Introducing Dashboard Customer Retention And Engagement Planning Ppt Pictures Graphics. to increase your presentation threshold. Encompassed with three stages, this template is a great option to educate and entice your audience. Dispence information on dashboard, using this template. Grab it now to reap its full benefits.
-
 Kpi for enterprise performance management system
Introducing our premium set of slides with KPI For Enterprise Performance Management System. Elucidate the three stages and present information using this PPT slide. This is a completely adaptable PowerPoint template design that can be used to interpret topics like KPI For Enterprise Performance Management System. So download instantly and tailor it with your information.
-
 Measuring Flasks Powerpoint Presentation Slides
These high quality, editable pre-designed powerpoint slides and powerpoint templates have been carefully created by our professional team to help you impress your audience. Each graphic in every powerpoint slide is vector based and is 100% editable in powerpoint. Each and every property of any slide - color, size, shading etc can be modified to build an effective powerpoint presentation. Use these slides to convey complex business concepts in a simplified manner. Any text can be entered at any point in the powerpoint slide. Simply DOWNLOAD, TYPE and PRESENT!
-
 Measuring Instruments Powerpoint Presentation Slides
These high quality, editable pre-designed powerpoint slides and powerpoint templates have been carefully created by our professional team to help you impress your audience. Each graphic in every powerpoint slide is vector based and is 100% editable in powerpoint. Each and every property of any slide - color, size, shading etc can be modified to build an effective powerpoint presentation. Use these slides to convey complex business concepts in a simplified manner. Any text can be entered at any point in the powerpoint slide. Simply DOWNLOAD, TYPE and PRESENT!
-
 Measuring Beakers Powerpoint Presentation Slides Db
These high quality, editable pre-designed powerpoint slides and powerpoint templates have been carefully created by our professional team to help you impress your audience. Each graphic in every powerpoint slide is vector based and is 100% editable in powerpoint. Each and every property of any slide - color, size, shading etc can be modified to build an effective powerpoint presentation. Use these slides to convey complex business concepts in a simplified manner. Any text can be entered at any point in the powerpoint slide. Simply DOWNLOAD, TYPE and PRESENT!
-
 Measuring Instruments Powerpoint Presentation Slides Db
These high quality, editable pre-designed powerpoint slides and powerpoint templates have been carefully created by our professional team to help you impress your audience. Each graphic in every powerpoint slide is vector based and is 100% editable in powerpoint. Each and every property of any slide - color, size, shading etc can be modified to build an effective powerpoint presentation. Use these slides to convey complex business concepts in a simplified manner. Any text can be entered at any point in the powerpoint slide. Simply DOWNLOAD, TYPE and PRESENT!
-
 Measuring Growth Powerpoint Presentation Slides
These high quality, editable pre-designed powerpoint slides have been carefully created by our professional team to help you impress your audience. Each graphic in every slide is vector based and is 100% editable in powerpoint. Each and every property of any slide - color, size, shading etc can be modified to build an effective powerpoint presentation. Use these slides to convey complex business concepts in a simplified manner. Any text can be entered at any point in the powerpoint slide. Simply DOWNLOAD, TYPE and PRESENT!
-
 Measuring Growth Planning Graphs Powerpoint Slides And Ppt Templates Db
These high quality, editable pre-designed Measuring Growth Planning Graphs Powerpoint Slides And Ppt Templates DB powerpoint slides and powerpoint templates have been carefully created by our professional team to help you impress your audience. Each graphic in every powerpoint slide is vector based and is 100% editable in powerpoint. Each and every property of any slide - color, size, shading etc can be modified to build an effective powerpoint presentation. Use these slides to convey complex business concepts in a simplified manner. Any text can be entered at any point in the powerpoint slide. Simply DOWNLOAD, TYPE and PRESENT
-
 Measuring Value In Flasks Chemistry Medical Liquid Half Empty Full Powerpoint Diagram Templates Graphics 712
These high quality, editable pre-designed measuring value in flasks chemistry medical liquid half empty full powerpoint diagram templates graphics 712 powerpoint slides and powerpoint templates have been carefully created by our professional team to help you impress your audience. Each graphic in every powerpoint slide is vector based and is 100% editable in powerpoint.
-
 Upward Level Cylinders Glass Beakers Measuring With Liquid Half Filled Powerpoint Diagram Templates Graphics 712
These high quality, editable pre-designed upward level cylinders glass beakers measuring with liquid half filled powerpoint diagram templates graphics 712 powerpoint slides and powerpoint templates have been carefully created by our professional team to help you impress your audience. Each graphic in every powerpoint slide is vector based and is 100% editable in powerpoint.
-
 Measuring Growth
High determination PowerPoint visuals. Simplicity of download and can be spared in any organization. Ease of customization and introduction. Good with various programming alternatives accessible both on the web and disconnected. Altogether editable slide plan design. Simplicity of consideration and rejection of slide content at sole tact. Opportunity to customize the slides with organization particular name, logo and trademark. Utilized by deals profile experts, understudies and instructors.
-
 Measuring Beakers Ppt 5
This template is skillfully designed and is completely editable to suit all the needs and requirements of the user. The color of the font, its size, style, and all other elements can be customized according to the user's desire The text in the PPT placeholder can be replaced with the desired information making this template highly flexible and adaptable as well. This template is also compatible with various Microsoft versions and formats like Google Slides, JPG, PDF, etc so the user will face no issue in saving it in the format of his choice.
-
 Measuring Instruments Ppt 2
This template is skillfully designed and is completely editable to suit all the needs and requirements of the user. The color of the font, its size, style, and all other elements can be customized according to the user's desire The text in the PPT placeholder can be replaced with the desired information making this template highly flexible and adaptable as well. This template is also compatible with various Microsoft versions and formats like Google Slides, JPG, PDF, etc so the user will face no issue in saving it in the format of his choice.
-
 Measuring Instruments Ppt 3
This template is skillfully designed and is completely editable to suit all the needs and requirements of the user. The color of the font, its size, style, and all other elements can be customized according to the user's desire The text in the PPT placeholder can be replaced with the desired information making this template highly flexible and adaptable as well. This template is also compatible with various Microsoft versions and formats like Google Slides, JPG, PDF, etc so the user will face no issue in saving it in the format of his choice.
-
 1113 Business Ppt Diagram Measuring Scale With Pointer Powerpoint Template
We are proud to present our 1113 business ppt diagram measuring scale with pointer powerpoint template. This PPT diagram has been conceived to enable you to emphatically communicate your ideas. Adjust the above image in your PPT presentations to visually support your content in an impressive way.
-
 Measuring Success Powerpoint Template Slide
Bother free, easy and fast download. Completely modifiable text as per your need. Change the color scheme and contrast to suit the contextual requirement. Thoroughly editable orientation and size of PPT icons. Include your own company logo, tagline, watermark, trademark etc. to personalize. No alteration in original resolution of presentation images post editing. The stages in this process are success, growth.
-
 0314 Dashboard Snapshot Meter For Business Information
Businessmen, micro, small and start up enterprises can use the PPT layout to make effective comparisons. PowerPoint presentation supports differential and unique text and background color. All images used can be resized and altered in the presentation slide. Compatible with Google slides is good for PPT design. There is no space constrain in the PowerPoint design, user oriented edition of data is ensured. Smooth performance is rendered by the presentation slide show on all software’s.
-
 0314 Dashboard Snapshot To Compare Data
The PowerPoint presentation ensures function of editing text and diagrams color of most benefit to management professionals, big or small organizations and business startups. Features facile and user oriented features to change in the color, size and orientation in presentation slide show. Text and graphic can be featured together in the same PPT slide. Quality and standard resolution in color and art shape is offered by PPT graphic. Extends professional resolution without compromising on pixels quality.
-
 0314 Data Driven Dashboard Snapshot Design
Amendable presentation design with amazing picture quality. Modification is possible with color, text, font and shape. Excel linked design so you can make changes in the excel sheet and the design will change accordingly. Prompt download and can be changed in JPEG and PDF format. Gives a specialized effect to your Presentation template. Alternate to customize the design by adding business badge, icon and symbol. PowerPoint slide exhibited in standard and widescreen view. Useful for marketing people, corporate managers, revenue department, sales administrators, private financiers.
-
 0314 Business Ppt Diagram Infographic Design Of Measuring Flask Powerpoint Template
We are proud to present our 0314 business ppt diagram infographic design of measuring flask powerpoint template. Use Our 0314 Business Ppt Diagram Infographic Design Of Measuring Flask Powerpoint Template Power Point Templates To Steer Your Racing Mind. Hit The Right Buttons And Spur On Your Audience. Embellish Your Thoughts By Using Our Measuring Power Point Templates. They Will Help You Illustrate The Brilliance Of Your Ideas.
-
 0514 Five Measuring Test Tube Graphic Medical Images For Powerpoint
We are proud to present our 0514 five measuring test tube graphic medical images for powerpoint. This is a 3d graphic of five measuring test tubes Power Point template. This Power Point template is very useful for scientific measurement display of any liquid quantity. Use this slide in your medical or science related presentation.
-
 0514 Four Measuring Test Tubes For Medical Use Medical Images For Powerpoint
We are proud to present our 0514 four measuring test tubes for medical use medical images for powerpoint. To show the measurement concepts use this 3d graphic four measuring test tubes Power Point template. This Power Point template is very useful for scientific measurement display of any liquid quantity. Use this slide in your medical or science related presentation.
-
 0514 Three Liquid Measuring Cylinders Medical Images For Powerpoint
We are proud to present our 0514 three liquid measuring cylinders medical images for powerpoint. To display the liquid measurement techniques use our three liquid measuring cylinders Power Point template. This Power Point template is very useful for scientific measurement display of any liquid quantity. To display any measurement related data you can use this template in your presentation and create a good impression during presentation.
-
 0514 Three Value Measuring Flasks For Science Medical Images For Powerpoint
We are proud to present our 0514 three value measuring flasks for science medical images for powerpoint. For displaying science related measurement use this three value measuring flasks Power Point template. This Power Point template is very useful for scientific measurement display of any liquid quantity. To display any measurement related data you can use this template in your presentation .
-
 3d Measuring Tape For Distance Measurement Stock Photo
We are proud to present our 3d measuring tape for distance measurement stock photo. This image is in .jpg format and is available in size 2000x2000 This image is crafted with graphic of 3d measuring tape. This image displays the theme and concept of engineering measurement. Show distance measurement in any engineering and dimension related presentations using this image.
-
 0814 3d Yellow And Black Measuring Tape For Professional Use Image Graphics For Powerpoint
We are proud to present our 0814 3d yellow and black measuring tape for professional use image graphics for powerpoint. This is a wonderful image slide of yellow and black measuring tape for professional use. This image has been crafted with 3d graphic of industrial measuring tape. Use this template for presentations related to architecture, blue print and construction. Concepts of business which can be measured may also be explained using this image slide. This image slide is 100 percent editable. Charm your audience with this image slide.
-
 0914 Big Data Technology Icons Analytics Storage Replication Dashboard Magnify Ppt Slide
Gracefully and delicately designed PPT visual. Convenience to modify the design as per the communal constraint. Spotless quality of pictures and images used in the designing. Access to add business details such as insignia, design or portrait. Brisk download and easy to share with large set of viewers. Flexible presentation background as slickly adjustable into JPG and PDF format. Presentation illustration downloadable in standard and widescreen display view.
-
 1114 Kpis Scorecards And Dashboards Powerpoint Presentation
We are proud to present our 1114 kpis scorecards and dashboards powerpoint presentation. Interconnected text box diagram has been used to decorate this power point template slide. This PPT diagram slide contains the concept of displaying KPIS score card. We have also used dashboard graphic to decorate this PPT slide.
-
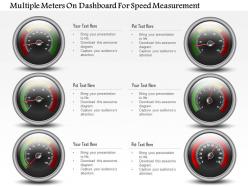 1214 Multiple Meters On Dashboard For Speed Measurement Powerpoint Slide
This template with speed meters is convenient to use. You can easily insert or remove any kind of figures or illustrations as per your requirements by simply following the instructions that have been given in the sample slides. The font size, font color and the font style that you use in the slides is 100% editable and can be changed easily as per your needs. You can get these slides in widescreen display with ratio of 16:9 by just a click. You can even upload these slides to Google Slides and they will work automatically. Also you can save the template in JPG or PDF format.
-
 Industrial Measuring Tape Flat Powerpoint Design
We are proud to present our industrial measuring tape flat powerpoint design. Graphic of industrial measuring tape has been used to craft this power point template diagram. This PPT diagram contains the concept of measurement. Use this PPT diagram for business and marketing related presentation.
-
 Four Dashboards Snapshot And Percentage Diagram Powerpoint Slides
It consists of high resolution ppt slides to address all business and finance related concepts. Appealing background, color, layout and font. Can be easily converted into PDF or JPG. Alluring graphs for comparison and fascinating figures to illustrate the concepts. Useful for corporate people, researchers and business professionals..
-
 Measuring Success Pmi Project Management Ppt Example
Presenting measuring success pmi project management ppt example. This is a measuring success pmi project management ppt example. This is a five stage process. The stages in this process are business, icons, process.
-
 Techniques Of Measuring Data Quality Ppt Example
Presenting techniques of measuring data quality ppt example. This is a techniques of measuring data quality ppt example. This is a three stage process. The stages in this process are data quality, measure validity, measure validity.
-
 Supply Chain Kpi Dashboard Powerpoint Presentation Slides
Presenting our supply chain KPI dashboard PowerPoint presentation slides. This PowerPoint design contains fifty-nine slides in it which can be completely customized and edited. It is available for both standard as well as for widescreen formats. This PowerPoint template is compatible with all the presentation software like Microsoft Office, Google Slides, etc. You can download this PPT layout from below.
-
 Kpi Dashboard Powerpoint Slide Images
Presenting kpi dashboard powerpoint slide images. This is a kpi dashboard powerpoint slide images. This is a one stage process. The stages in this process are sold products, earned revenue, outcasts, successful adverts, operations, target, compare.
-
 Kpi Dashboard Snapshot Powerpoint Ideas
Fabulously composed PPT design useful for business professionals, organizational experts or researchers , students and many more from diverse areas , Comprehensive and convenient PPT Images with ductile dummy data options, Consonant with all available graphic software’s and Google slides, Accessible to other file configurations like PDF or JPG. Multi-color options, background images, styles and other characteristics are fully editable, Expeditious downloading process, Allows to introduce your company logo or brand name in the PPT slides.
-
 Weighing Scale For Measuring Performances Powerpoint Templates
Presenting weighing scale for measuring performances powerpoint templates. This is a weighing scale for measuring performances powerpoint templates. This is a two stage process. The stages in this process are this standard relates to the direction of the organization, business, strategy.
-
 Key Human Resource Metrics Dashboard Snapshot Ppt Slide
Presenting key human resource metrics dashboard snapshot ppt slide. This is a key human resource metrics dashboard ppt slide. This is a four stage process. The stages in this process are key health metrics, previous 4 quarters, change year over year, voluntary, turnover rate, involuntary, q, registration rate, manager instability rate, top talent turnover rate, top 3 potential areas of concern, for smb services in vancouver, for products in u k, for human resources in denver, key health metrics, previous 4 quarters, change year over year, flow through rate, headcount flow, out, in, span of control, direct compensation change.
-
 Action Plan Dashboard Example Of Ppt
Offering action plan dashboard example of PPT slide. This presentation template has been professionally designed and is fully editable in PowerPoint. You can customize the font type, font size, colors of the diagram and background color as per your requirement. The slide is fully compatible with Google Slides and can be saved in JPG or PDF format without any hassle. High quality graphics and icons ensure that there is no deteriorating in quality on enlarging their size.
-
 Procurement Kpi Dashboard Total Spend Analysis Ppt Samples
Presenting procurement kpi dashboard total spend analysis ppt samples. This is a procurement kpi dashboard total spend analysis ppt samples. This is a five stage process. The stages in this process are business, strategy, growth, finance, chart and graph.
-
 Achieving Sales Target Sales Kpi Editable Dashboard Snapshot Ppt Diagrams
Presenting achieving sales target sales kpi editable dashboard PPT diagrams. Simple data input like company logo, name or trademark. This PowerPoint theme is fully supported by Google slides. Picture quality of these slides does not change even when projected on large screen. Fast downloading speed and formats can be easily changed to JPEG and PDF applications. This template is suitable for marketing, sales persons, business managers and entrepreneurs. Adjust PPT layout, font, text and color as per your necessity.
-
 Achieving Sales Target Sales Performance And Sales Kpi Dashboard Snapshot Ppt Icon
Presenting Achieving Sales Target Sales Performance and Sales KPI Dashboard Snapshot PPT Icon. This presentation includes five stage processes with all the instructions to customize as per your needs and preferences. The stages in this process are sales objectives, sales goal, achieving sales target. You can add your brand’s name, logo or label for that extra impact. The Complete information and Enhanced Visuals are the strongest points of this Sales KPI Dashboard PPT.
-
 Data Driven Sales Kpi Dashboard Snapshot For Achieving Sales Target Ppt Samples
This PPT can be downloaded very conveniently on a click of a button. Your business presentation looks very professional with its use. The images used in this PPT template are 100% editable. The color, size and orientation of any icon can easily be changed in this presentation as you wish. The excel-linked chart can be edited as the shapes automatically adjusts according to your data. You can select from thousands of editable icons on each and every topic. Personalize the presentation with individual company name and logo. It can be viewed and saved in JPG or PDF format. It is fully compatible with Google slides as well.
-
 Measuring High Medium Low Risk For Project Management
Presenting this set of slides with name - Measuring High Medium Low Risk For Project Management. This is a threee stage process. The stages in this process are High Medium Low, High Moderate Low, Top Medium Low.
-
 Project Dashboard Snapshot With Kpi Status Risks Project Area Issues
Presenting this set of slides with name - Project Dashboard Snapshot With Kpi Status Risks Project Area Issues. This is a four stage process. The stages in this process are Project Review, Project Analysis, Project Performance management.
-
 Hr Dashboard Number Of Employees Employee Structure
Presenting this set of slides with name - Hr Dashboard Number Of Employees Employee Structure. This is a four stage process. The stages in this process are Hr Dashboard, Human Resource Dashboard, Hr Kpi.
-
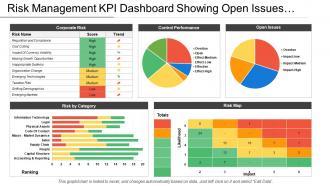 Risk Management Kpi Dashboard Showing Open Issues And Control Performance
Presenting this set of slides with name - Risk Management Kpi Dashboard Showing Open Issues And Control Performance. This is a five stage process. The stages in this process are Risk Management, Risk Assessment, Project Risk.
-
 Project Status Kpi Dashboard Snapshot Showing Completed Tasks And Task In Progress
Presenting, project status kpi dashboard snapshot showing completed tasks and task in progress. This PowerPoint slide can be used by businesses experts for their business performance related presentations. The topics and the similar data shown in the flat design can be easily edited in terms of color, text, and fonts by just by heeding few steps. The color and orientation of the elements can also be changed easily. These PPT slides are cooperative with google slides.
-
 Project Status Kpi Dashboard Showing Schedule And Alignment
Presenting this set of slides with name - Project Status Kpi Dashboard Showing Schedule And Alignment. This is a seven stage process. The stages in this process are Project Health Card, Project Performance, Project Status.
-
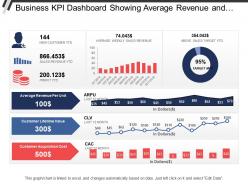 Business Kpi Dashboard Showing Average Revenue And Clv
Presenting this set of slides with name - Business Kpi Dashboard Showing Average Revenue And Clv. This is a three stage process. The stages in this process are Business Dashboard, Business Kpi, Business Performance.
-
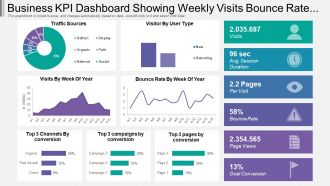 Business Kpi Dashboard Snapshot Showing Weekly Visits Bounce Rate And Traffic Source
Presentation graphic is totally compatible with Google slides. Multiple display options i.e. standard and widescreen. 100 percent editable designs to show your creativity. Similar designs available with different nodes and stages. Easy to download and convert into JPEG or PDF format. Alteration can be done in color, text and shape. Pre-designed PPT slide just download and insert it in the presentation. Quick download with easy to save. Choice to add company logo and replace text as required. High resolution quality ensures no pixilation.
-
 Compliance And Legal Kpi Dashboard Showing Cases By Due Date
Presenting this set of slides with name - Compliance And Legal Kpi Dashboard Showing Cases By Due Date. This is a four stage process. The stages in this process are Compliance And Legal, Legal Governance, Risk Management.
-
 Supply Chain Management Kpi Dashboard Showing Cost Reduction And Procurement Roi
Presenting this set of slides with name - Supply Chain Management Kpi Dashboard Showing Cost Reduction And Procurement Roi. This is a five stage process. The stages in this process are Demand Forecasting, Predicting Future Demand, Supply Chain Management.
-
Good research work and creative work done on every template.
-
Excellent Designs.
-
Topic best represented with attractive design.
-
Great quality slides in rapid time.
-
Amazing product with appealing content and design.
-
Great quality slides in rapid time.
-
Great designs, Easily Editable.
-
Understandable and informative presentation.
-
Best way of representation of the topic.
-
Topic best represented with attractive design.


