Charts, Graphs PowerPoint Designs, Presentation Charts Designs & PPT Graphics
- Sub Categories
-
- Arrows and Targets
- Bullet and Text Slides
- Charts and Graphs
- Circular Cycle Diagrams
- Concepts and Shapes
- Custom Flat Designs
- Dashboards and Measuring
- Flow Process
- Funnels
- Gears
- Growth
- Harvey Balls
- Idea Innovation and Light Bulbs
- Leadership
- Linear Process Diagrams
- Magnifying Glass
- Misc Other Graphics
- Opportunity and Handshake
- Organization Charts
- Puzzles
- Pyramids
- Roadmaps and Timelines
- Silhouettes
- Steps
- Strategic Planning Analysis
- SWOT Analysis
- Tables and Matrix
- Teamwork
- Technology and Communication
- Venn Diagrams
- Visuals and Illustrations
-
 Campaign performance report powerpoint presentation
Presenting campaign performance report powerpoint presentation. This is a campaign performance report powerpoint presentation. This is a four stage process. The stages in this process are industry snapshot, viewability, ad fraud, brand safety, tra score.
-
 Company sales analysis powerpoint slide ideas
Presenting company sales analysis powerpoint slide ideas. This is a company sales analysis powerpoint slide ideas. This is a eight stage process. The stages in this process are business, bar graph, time planning, strategy.
-
 Marketing expenditures pie chart powerpoint slide deck
Presenting marketing expenditures pie chart powerpoint slide deck. This is a marketing expenditures pie chart powerpoint slide deck. This is a five stage process. The stages in this process are business, finance, process, strategy, chart and graph.
-
 Types of media spending direction considerations powerpoint ideas
Presenting types of media spending direction considerations powerpoint ideas. This is a types of media spending direction considerations powerpoint ideas. This is a four stage process. The stages in this process are digital video, mobile video, advanced tv, broadcast cable ott tv.
-
 Brand development dashboard ppt slide themes
Presenting brand development dashboard ppt slide themes. This is a brand development dashboard ppt slide themes. This is a three stage process. The stages in this process are implementation, discovery, conception.
-
 Business growth and development example of ppt
Presenting business growth and development example of ppt. This is a business growth and development example of ppt. This is a six stage process. The stages in this process are new business deals, knowledge, experience, expertise, insight, application, success.
-
 Chart for economic growth factors ppt design templates
Presenting chart for economic growth factors ppt design templates. This is a chart for economic growth factors ppt design templates. This is a four stage process. The stages in this process are housing, casually analysis, management of risk, approaches of statement.
-
 Wealth comparison and economic analysis ppt design
Presenting wealth comparison and economic analysis ppt design. This is a wealth comparison and economic analysis ppt design. This is a three stage process. The stages in this process are evaluation, analytics, financial balance.
-
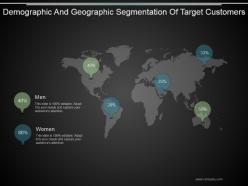 Demographic and geographic segmentation of target customers ppt ideas
Presenting demographic and geographic segmentation of target customers ppt ideas. This is a demographic and geographic segmentation of target customers ppt ideas. This is a five stage process. The stages in this process are business, marketing, location, geographical, compatibility.
-
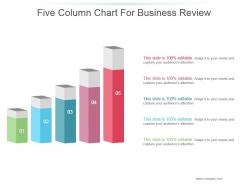 Five column chart for business review powerpoint slide designs
Presenting five column chart for business review powerpoint slide designs. This is a five column chart for business review powerpoint slide designs. This is a five stage process. The stages in this process are business, marketing, growth, chart, management.
-
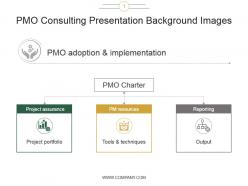 Pmo consulting presentation background images
Presenting pmo consulting presentation background images. This is a pmo consulting presentation background images. This is a three stage process. The stages in this process are project assurance, pm resources, reporting, project portfolio, tools and techniques, output.
-
 Seo for ecommerce website powerpoint topics
Presenting seo for ecommerce website powerpoint topics. This is a seo for ecommerce website powerpoint topics. This is a three stage process. The stages in this process are monthly newsletters, blog and social media, levels of helpdesk support.
-
 Yield gross revenue and net income powerpoint slide
Presenting yield gross revenue and net income powerpoint slide. This is a yield gross revenue and net income powerpoint slide. This is a three stage process. The stages in this process are business, marketing, compare, net income, management.
-
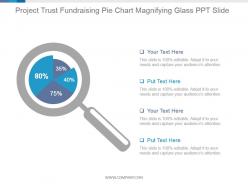 Project trust fundraising pie chart magnifying glass ppt slide
Presenting project trust fundraising pie chart magnifying glass ppt slide. This is a project trust fundraising pie chart magnifying glass ppt slide. This is a four stage process. The stages in this process are percentage, pie, magnifying glass, search, business, marketing.
-
 Quality assurance growth bar graph ppt slides
Presenting quality assurance growth bar graph ppt slides. This is a quality assurance growth bar graph ppt slides. This is a five stage process. The stages in this process are graph, bar chart, chart, business, marketing.
-
 Banking innovation sample of ppt
Presenting banking innovation sample of ppt. This is a banking innovation sample of ppt. This is a five stage process. The stages in this process are world of e banking, credit scoring, retail services, business banking, global services, send money.
-
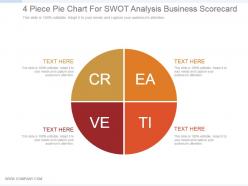 4 piece pie chart for swot analysis business scorecard ppt sample
Presenting 4 piece pie chart for swot analysis business scorecard ppt sample. This is a 4 piece pie chart for swot analysis business scorecard ppt sample. This is a four stage process. The stages in this process are pie, piece, chart, swot, analysis.
-
 Bar chart for media usage preferences powerpoint slide rules
Presenting bar chart for media usage preferences powerpoint slide rules. This is a bar chart for media usage preferences powerpoint slide rules. This is a four stage process. The stages in this process are digital video, mobile video, advanced tv, broad cast cable tv.
-
 Doughnut chart for data visualization comparison of percentages powerpoint slides design
Presenting doughnut chart for data visualization comparison of percentages powerpoint slides design. This is a doughnut chart for data visualization comparison of percentages powerpoint slides design. This is a four stage process. The stages in this process are business, marketing, financial, percentage, increase.
-
 Doughnut chart for numbers comparison data analysis slide powerpoint topics
Presenting doughnut chart for numbers comparison data analysis slide powerpoint topics. This is a doughnut chart for numbers comparison data analysis slide powerpoint topics. This is a six stage process. The stages in this process are circular, process, percentage, financial, business.
-
 Financial slide showing budget allocation ppt background
Presenting financial slide showing budget allocation ppt background. This is a financial slide showing budget allocation ppt background. This is a seven stage process. The stages in this process are circular, process, percentage, financial, budget.
-
 Funnel and column chart dashboard for campaign results ppt background images
Presenting funnel and column chart dashboard for campaign results ppt background images. This is a funnel and column chart dashboard for campaign results ppt background images. This is a two stage process. The stages in this process are brand, leads, sales, loyalty.
-
 Line graph for market analysis ppt slide
Presenting line graph for market analysis ppt slide. This is a line graph for market analysis ppt slide. This is a seven stage process. The stages in this process are complaint.
-
 Monthly financial statement graph ppt examples slides
Presenting monthly financial statement graph ppt examples slides. This is a monthly financial statement graph ppt examples slides. This is a two stage process. The stages in this process are jan, feb, mar, apr, may.
-
 5 business person silhouettes for team profile sample ppt presentation
Presenting 5 business person silhouettes for team profile sample ppt presentation. This is a 5 business person silhouettes for team profile sample ppt presentation. This is a five stage process. The stages in this process are silhouettes, management, communication, business, marketing.
-
 Business kpis performance dashboard snapshot powerpoint slide clipart
Presenting business kpis performance dashboard snapshot powerpoint slide clipart. This is a business kpis performance dashboard powerpoint slide clipart. This is a four stage process. The stages in this process are series, qtr.
-
 Business target evaluation with bar graph powerpoint slide download
Presenting business target evaluation with bar graph powerpoint slide download. This is a business target evaluation with bar graph powerpoint slide download. This is a five stage process. The stages in this process are step.
-
 Company timeline history with charts powerpoint slide introduction
Presenting company timeline history with charts powerpoint slide introduction. This is a company timeline history with charts powerpoint slide introduction. This is a six stage process. The stages in this process are business, planning, process, icons, strategy.
-
 Performance measurement and comparison dashboard snapshot ppt design
Presenting performance measurement and comparison dashboard snapshot ppt design. This is a performance measurement and comparison dashboard ppt design. This is a three stage process. The stages in this process are series, qtr.
-
 Pie chart graph for business performance review ppt design templates
Presenting pie chart graph for business performance review ppt design templates. This is a pie chart graph for business performance review ppt design templates. This is a four stage process. The stages in this process are pie, percentage, business, finance, marketing.
-
 Three series line graph for yearly trend comparison ppt background images
Presenting three series line graph for yearly trend comparison ppt background images. This is a three series line graph for yearly trend comparison ppt background images. This is a three stage process. The stages in this process are series.
-
 Business performance dashboard powerpoint slides
Presenting business performance dashboard powerpoint slides. This is a business performance dashboard powerpoint slides. This is a four stage process. The stages in this process are business, chart and graph, strategy, success, line graph.
-
 Business performance four point dashboard snapshot ppt slide
Presenting business performance four point dashboard snapshot ppt slide. This is a business performance four point dashboard ppt slide. This is a four stage process. The stages in this process are business, success, dashboard, finance, strategy.
-
 Performance of marketing channels ppt diagrams
Presenting performance of marketing channels ppt diagrams. This is a performance of marketing channels ppt diagrams. This is a ten stage process. The stages in this process are price incentives, events, merchandising display, contests, premiums, loyalty program, referral program.
-
 Bar graph to show sales growth ppt model
Presenting bar graph to show sales growth ppt model. This is a bar graph to show sales growth ppt model. This is a five stage process. The stages in this process are business, marketing, process, success, strategy.
-
 Agency performance evaluation report ppt design
Presenting agency performance evaluation report ppt design. This is a agency performance evaluation report ppt design. This is a four stage process. The stages in this process are industry snapshot, brand safety, viewability.
-
 Campaign performance analysis report powerpoint guide
Presenting campaign performance analysis report powerpoint guide. This is a campaign performance analysis report powerpoint guide. This is a four stage process. The stages in this process are brand, leads, sales, loyalty.
-
 Media budget allocation pie chart ppt example file
Presenting media budget allocation pie chart ppt example file. This is a media budget allocation pie chart ppt example file. This is a five stage process. The stages in this process are business, marketing, strategy, management, success.
-
 Pie chart for financial analysis ppt examples
Presenting pie chart for financial analysis ppt examples. This is a pie chart for financial analysis ppt examples. This is a seven stage process. The stages in this process are business, marketing, strategy, management, success.
-
 Spending direction considerations report ppt slides
Presenting spending direction considerations report ppt slides. This is a spending direction considerations report ppt slides. This is a four stage process. The stages in this process are digital video, mobile video, adavance tv, bordcast.
-
 Business sales report presentation powerpoint shapes
Presenting business sales report presentation powerpoint shapes. This is a business sales report presentation powerpoint shapes. This is a four stage process. The stages in this process are finance, growth, success, business, marketing.
-
 Calculating market size powerpoint templates
Presenting calculating market size powerpoint templates. This is a calculating market size powerpoint templates. This is a eight stage process. The stages in this process are growth rate, market size.
-
 Competitor positioning analysis powerpoint slide
Presenting competitor positioning analysis powerpoint slide. This is a competitor positioning analysis powerpoint slide. This is a six stage process. The stages in this process are gaining market share, losing market share, average market growth, company growth.
-
 Competitor revenue and profit growth report powerpoint slide
Presenting competitor revenue and profit growth report powerpoint slide. This is a competitor revenue and profit growth report powerpoint slide. This is a five stage process. The stages in this process are profit, revenue.
-
 Cost structure analysis powerpoint slide deck
Presenting cost structure analysis powerpoint slide deck. This is a cost structure analysis powerpoint slide deck. This is a seven stage process. The stages in this process are wages, purchases, rent and utilities, depreciation, other, profit, marketing.
-
 Financial reporting dashboard snapshot ppt model
Presenting financial reporting dashboard ppt model. This is a financial reporting dashboard snapshot ppt model. This is a three stage process. The stages in this process are business, dashboard, financial, measuring, meter.
-
 Market size and growth presentation deck
Presenting market size and growth presentation deck. This is a market size and growth presentation deck. This is a two stage process. The stages in this process are asia pacific, the largest market.
-
 Market size growth and trends presentation layouts
Presenting market size growth and trends presentation layouts. This is a market size growth and trends presentation layouts. This is a seven stage process. The stages in this process are latin america, canada, japan, europe, asia pacific, us, rest of world.
-
 Market size variance presentation outline
Presenting market size variance presentation outline. This is a market size variance presentation outline. This is a seven stage process. The stages in this process are africa, middle east, latin america, eastern europe, north america, asia, western europe.
-
 Relative market share of different competitors ppt diagrams
Presenting relative market share of different competitors ppt diagrams. This is a relative market share of different competitors ppt diagrams. This is a six stage process. The stages in this process are competitor, market share.
-
 Competitors analysis marketing report powerpoint slide background image
Presenting competitors analysis marketing report powerpoint slide background image. This is a competitors analysis marketing report powerpoint slide background image. This is a five stage process. The stages in this process are revenue, profit.
-
 Identifying market trends current number powerpoint slide clipart
Presenting identifying market trends current number powerpoint slide clipart. This is a identifying market trends current number powerpoint slide clipart. This is a seven stage process. The stages in this process are latin america, canada, japan, europe, asia pacific, us, rest of the world.
-
 Industry cost structure market analysis powerpoint slide deck
Presenting industry cost structure market analysis powerpoint slide deck. This is a industry cost structure market analysis powerpoint slide deck. This is a seven stage process. The stages in this process are profit, wages, purchases, depreciation, marketing, rent and utilities, other.
-
 Market share of different competitors powerpoint slide download
Presenting market share of different competitors powerpoint slide download. This is a market share of different competitors powerpoint slide download. This is a six stage process. The stages in this process are business, marketing, competitors, percentage, compare.
-
 Market size vs growth rate bar graph powerpoint slide images
Presenting market size vs growth rate bar graph powerpoint slide images. This is a market size vs growth rate bar graph powerpoint slide images. This is a eight stage process. The stages in this process are business, marketing, growth, timeline, bar graph.
-
 Market trends analysis percentage spending by region powerpoint slide introduction
Presenting market trends analysis percentage spending by region powerpoint slide introduction. This is a market trends analysis percentage spending by region powerpoint slide introduction. This is a two stage process. The stages in this process are western europe, asia, north america, eastern europe, latin america, middle east, africa.
-
 Market trends in business plan powerpoint slide presentation examples
Presenting market trends in business plan powerpoint slide presentation examples. This is a market trends in business plan powerpoint slide presentation examples. This is a five stage process. The stages in this process are business, marketing, growth, demand, planning.
-
 Salesforce dashboard powerpoint slide presentation tips
Presenting salesforce dashboard powerpoint slide presentation tips. This is a salesforce dashboard powerpoint slide presentation tips. This is a two stage process. The stages in this process are business, marketing, dashboard, management, planning.
-
 Brand campaign performance analysis powerpoint graphics
Presenting brand campaign performance analysis powerpoint graphics. This is a brand campaign performance analysis powerpoint graphics. This is a four stage process. The stages in this process are business case brand, leads, sales, loyalty.
-
 Brand marketing campaign report powerpoint guide
Presenting brand marketing campaign report powerpoint guide. This is a brand marketing campaign report powerpoint guide. This is a four stage process. The stages in this process are brand safety, industry snapshot, viewability, tra score, ad fraud.
-
Innovative and Colorful designs.
-
Very well designed and informative templates.
-
Excellent products for quick understanding.
-
Awesome use of colors and designs in product templates.
-
Top Quality presentations that are easily editable.
-
Colors used are bright and distinctive.
-
Top Quality presentations that are easily editable.
-
Really like the color and design of the presentation.
-
Wonderful templates design to use in business meetings.
-
Great product with highly impressive and engaging designs.


