Charts, Graphs PowerPoint Designs, Presentation Charts Designs & PPT Graphics
- Sub Categories
-
- Arrows and Targets
- Bullet and Text Slides
- Charts and Graphs
- Circular Cycle Diagrams
- Concepts and Shapes
- Custom Flat Designs
- Dashboards and Measuring
- Flow Process
- Funnels
- Gears
- Growth
- Harvey Balls
- Idea Innovation and Light Bulbs
- Leadership
- Linear Process Diagrams
- Magnifying Glass
- Misc Other Graphics
- Opportunity and Handshake
- Organization Charts
- Puzzles
- Pyramids
- Roadmaps and Timelines
- Silhouettes
- Steps
- Strategic Planning Analysis
- SWOT Analysis
- Tables and Matrix
- Teamwork
- Technology and Communication
- Venn Diagrams
- Visuals and Illustrations
-
 Customer acquisition market goods consumption use ecosystem services
Presenting this set of slides with name - Customer Acquisition Market Goods Consumption Use Ecosystem Services. This is an editable four graphic that deals with topics like Customer Acquisition, Market Goods, Consumption Use, Ecosystem Services to help convey your message better graphically. This product is a premium product available for immediate download, and is 100 percent editable in Powerpoint. Download this now and use it in your presentations to impress your audience.
-
 Project Dashboard Snapshot With Kpi Status Risks Project Area Issues
Presenting this set of slides with name - Project Dashboard Snapshot With Kpi Status Risks Project Area Issues. This is a four stage process. The stages in this process are Project Review, Project Analysis, Project Performance management.
-
 Machine maintenance downtime facilities management dashboard with icons
Presenting this set of slides with name - Machine Maintenance Downtime Facilities Management Dashboard With Icons. This is a two stage process. The stages in this process are Facilities Management, FM, Support Management.
-
 Project progress showing burn down chart start and finish date
Presenting this set of slides with name - Project Progress Showing Burn Down Chart Start And Finish Date. This is a one stage process. The stages in this process are Project Progress, Project Growth, Project Management.
-
 Project progress showing completed deferred not started
Presenting this set of slides with name - Project Progress Showing Completed Deferred Not Started. This is a four stage process. The stages in this process are Project Progress, Project Growth, Project Management.
-
 Project progress with actual completion slippage planned completion
Presenting this set of slides with name - Project Progress With Actual Completion Slippage Planned Completion. This is a three stage process. The stages in this process are Project Progress, Project Growth, Project Management.
-
 Project progress with task assign priority status and meter with different rating
Presenting this set of slides with name - Project Progress With Task Assign Priority Status And Meter With Different Rating. This is a three stage process. The stages in this process are Project Progress, Project Growth, Project Management.
-
 Stack bar with coins and bit coins heap
Presenting this set of slides with name - Stack Bar With Coins And Bit Coins Heap. This is a four stage process. The stages in this process are Stacked Bar, Pile Bar, Heap Bar.
-
 Stacked bar of money with white silhouette
Presenting this set of slides with name - Stacked Bar Of Money With White Silhouette. This is a three stage process. The stages in this process are Stacked Bar, Pile Bar, Heap Bar.
-
 Stacked bar with coins and jar full of coins
Presenting this set of slides with name - Stacked Bar With Coins And Jar Full Of Coins. This is a four stage process. The stages in this process are Stacked Bar, Pile Bar, Heap Bar.
-
 Stacked bar with currency notes and seven heaps of steps
Presenting this set of slides with name - Stacked Bar With Currency Notes And Seven Heaps Of Steps. This is a seven stage process. The stages in this process are Stacked Bar, Pile Bar, Heap Bar.
-
 Stacked bar with iron triangle
Presenting this set of slides with name - Stacked Bar With Iron Triangle. This is a four stage process. The stages in this process are Stacked Bar, Pile Bar, Heap Bar.
-
 Stacked gold bars as the bank gold
Presenting this set of slides with name - Stacked Gold Bars As The Bank Gold. This is a four stage process. The stages in this process are Stacked Bar, Pile Bar, Heap Bar.
-
 Staked bar of dollar currency with funds and finance
Presenting this set of slides with name - Staked Bar Of Dollar Currency With Funds And Finance. This is a five stage process. The stages in this process are Stacked Bar, Pile Bar, Heap Bar.
-
 Business plan comparison chart with per month price
Presenting this set of slides with name - Business Plan Comparison Chart With Per Month Price. This is a three stage process. The stages in this process are Comparison Chart, Comparison Table, Comparison Matrix.
-
 Comparison chart with essentials deluxe and platinum package
Presenting this set of slides with name - Comparison Chart With Essentials Deluxe And Platinum Package. This is a four stage process. The stages in this process are Comparison Chart, Comparison Table, Comparison Matrix.
-
 Comparison chart with four plans and there basic benefits
Presenting this set of slides with name - Comparison Chart With Four Plans And There Basic Benefits. This is a four stage process. The stages in this process are Comparison Chart, Comparison Table, Comparison Matrix.
-
 Comparison chart with free and premium characteristics
Presenting this set of slides with name - Comparison Chart With Free And Premium Characteristics. This is a two stage process. The stages in this process are Comparison Chart, Comparison Table, Comparison Matrix.
-
 Comparison chart with good better best product and features
Presenting this set of slides with name - Comparison Chart With Good Better Best Product And Features. This is a seven stage process. The stages in this process are Comparison Chart, Comparison Table, Comparison Matrix.
-
 Comparison chart with our business competitors and real time testing
Presenting this set of slides with name - Comparison Chart With Our Business Competitors And Real Time Testing. This is a six stage process. The stages in this process are Comparison Chart, Comparison Table, Comparison Matrix.
-
 Comparison chart with product its features and comments
Presenting this set of slides with name - Comparison Chart With Product Its Features And Comments. This is a ten stage process. The stages in this process are Comparison Chart, Comparison Table, Comparison Matrix.
-
 Comparison chart with product name competitors and features
Presenting this set of slides with name - Comparison Chart With Product Name Competitors And Features. This is a three stage process. The stages in this process are Comparison Chart, Comparison Table, Comparison Matrix.
-
 Life insurance product comparison chart with term and whole life plan
Presenting this set of slides with name - Life Insurance Product Comparison Chart With Term And Whole Life Plan. This is a four stage process. The stages in this process are Comparison Chart, Comparison Table, Comparison Matrix.
-
 Product feature comparison chart with brand and price
Presenting this set of slides with name - Product Feature Comparison Chart With Brand And Price. This is a two stage process. The stages in this process are Comparison Chart, Comparison Table, Comparison Matrix.
-
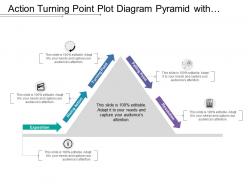 Action turning point plot diagram pyramid with arrow
Presenting this set of slides with name - Action Turning Point Plot Diagram Pyramid With Arrow. This is a five stage process. The stages in this process are Scatter Plot, Probability Plots, Plot Diagram.
-
 Beginning action climax plot diagram with boxes
Presenting this set of slides with name - Beginning Action Climax Plot Diagram With Boxes. This is a five stage process. The stages in this process are Scatter Plot, Probability Plots, Plot Diagram.
-
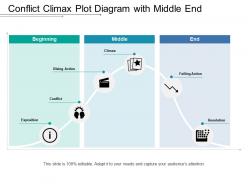 Conflict climax plot diagram with middle end
Presenting this set of slides with name - Conflict Climax Plot Diagram With Middle End. This is a three stage process. The stages in this process are Scatter Plot, Probability Plots, Plot Diagram.
-
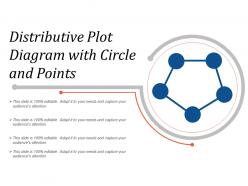 Distributive plot diagram with circle and points
Presenting this set of slides with name - Distributive Plot Diagram With Circle And Points. This is a one stage process. The stages in this process are Scatter Plot, Probability Plots, Plot Diagram.
-
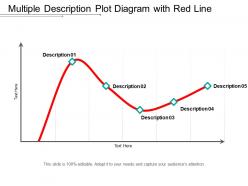 Multiple description plot diagram with red line
Presenting this set of slides with name - Multiple Description Plot Diagram With Red Line. This is a five stage process. The stages in this process are Scatter Plot, Probability Plots, Plot Diagram.
-
 Plot diagram with coloured bars
Presenting this set of slides with name - Plot Diagram With Coloured Bars. This is a three stage process. The stages in this process are Scatter Plot, Probability Plots, Plot Diagram.
-
 Product quality plot diagram with quadrant
Presenting this set of slides with name - Product Quality Plot Diagram With Quadrant. This is a three stage process. The stages in this process are Scatter Plot, Probability Plots, Plot Diagram.
-
 Resolution action coloured plot diagram with icons
Presenting this set of slides with name - Resolution Action Coloured Plot Diagram With Icons. This is a five stage process. The stages in this process are Scatter Plot, Probability Plots, Plot Diagram.
-
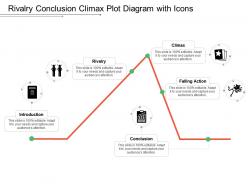 Rivalry conclusion climax plot diagram with icons
Presenting this set of slides with name - Rivalry Conclusion Climax Plot Diagram With Icons. This is a five stage process. The stages in this process are Scatter Plot, Probability Plots, Plot Diagram.
-
 Scattered plot diagram with multiple points
Presenting this set of slides with name - Scattered Plot Diagram With Multiple Points. This is a five stage process. The stages in this process are Scatter Plot, Probability Plots, Plot Diagram.
-
 Start incident midpoint plot diagram with obstacle
Presenting this set of slides with name - Start Incident Midpoint Plot Diagram With Obstacle. This is a six stage process. The stages in this process are Scatter Plot, Probability Plots, Plot Diagram.
-
 Profit patterns with increasing bar graphs showing quarter
Presenting this set of slides with name - Profit Patterns With Increasing Bar Graphs Showing Quarter. This is a three stage process. The stages in this process are Engineering, Procurement And Construction, Construction Management, Engineering, Purchasing And Construction .
-
 Profit patterns with years and profits line charts
Presenting this set of slides with name - Profit Patterns With Years And Profits Line Charts. This is a one stage process. The stages in this process are Profit Pattern, Profit Design, Profit Order.
-
 6 piece colored pie chart with numbers
Presenting this set of slides with name - 6 Piece Colored Pie Chart With Numbers. This is a six stage process. The stages in this process are 6 Piece Pie Chart, 6 Parts Pie Chart, 6 Segment Pie Chart.
-
 6 piece green pie chart with numbers
Presenting this set of slides with name - 6 Piece Green Pie Chart With Numbers. This is a six stage process. The stages in this process are 6 Piece Pie Chart, 6 Parts Pie Chart, 6 Segment Pie Chart.
-
 6 piece multicolored pie chart with icons and boxes
Presenting this set of slides with name - 6 Piece Multicolored Pie Chart With Icons And Boxes. This is a six stage process. The stages in this process are 6 Piece Pie Chart, 6 Parts Pie Chart, 6 Segment Pie Chart.
-
 6 piece pie chart with boxes and numbers
Presenting this set of slides with name - 6 Piece Pie Chart With Boxes And Numbers. This is a six stage process. The stages in this process are 6 Piece Pie Chart, 6 Parts Pie Chart, 6 Segment Pie Chart.
-
 6 piece pie chart with magnifying glass and boxes
Presenting this set of slides with name - 6 Piece Pie Chart With Magnifying Glass And Boxes. This is a six stage process. The stages in this process are 6 Piece Pie Chart, 6 Parts Pie Chart, 6 Segment Pie Chart.
-
 7 piece colored pie chart with numbers
Presenting this set of slides with name - 7 Piece Colored Pie Chart With Numbers. This is a seven stage process. The stages in this process are 6 Piece Pie Chart, 6 Parts Pie Chart, 6 Segment Pie Chart.
-
 7 piece green pie chart with numbers
Presenting this set of slides with name - 7 Piece Green Pie Chart With Numbers. This is a seven stage process. The stages in this process are 6 Piece Pie Chart, 6 Parts Pie Chart, 6 Segment Pie Chart.
-
 7 piece multicolored pie chart with icons and boxes
Presenting this set of slides with name - 7 Piece Multicolored Pie Chart With Icons And Boxes. This is a seven stage process. The stages in this process are 6 Piece Pie Chart, 6 Parts Pie Chart, 6 Segment Pie Chart.
-
 7 piece pie chart with boxes and numbers
Presenting this set of slides with name - 7 Piece Pie Chart With Boxes And Numbers. This is a seven stage process. The stages in this process are 6 Piece Pie Chart, 6 Parts Pie Chart, 6 Segment Pie Chart.
-
 7 piece pie chart with magnifying glass and boxes
Presenting this set of slides with name - 7 Piece Pie Chart With Magnifying Glass And Boxes. This is a seven stage process. The stages in this process are 6 Piece Pie Chart, 6 Parts Pie Chart, 6 Segment Pie Chart.
-
 8 piece colored pie chart with numbers
Presenting this set of slides with name - 8 Piece Colored Pie Chart With Numbers. This is a eight stage process. The stages in this process are 6 Piece Pie Chart, 6 Parts Pie Chart, 6 Segment Pie Chart.
-
 8 piece green pie chart with numbers
Presenting this set of slides with name - 8 Piece Green Pie Chart With Numbers. This is a eight stage process. The stages in this process are 6 Piece Pie Chart, 6 Parts Pie Chart, 6 Segment Pie Chart.
-
 8 piece multicolored pie chart with icons and boxes
Presenting this set of slides with name - 8 Piece Multicolored Pie Chart With Icons And Boxes. This is a eight stage process. The stages in this process are 6 Piece Pie Chart, 6 Parts Pie Chart, 6 Segment Pie Chart.
-
 8 piece pie chart with boxes and numbers
Presenting this set of slides with name - 8 Piece Pie Chart With Boxes And Numbers. This is a eight stage process. The stages in this process are 6 Piece Pie Chart, 6 Parts Pie Chart, 6 Segment Pie Chart.
-
 8 piece pie chart with magnifying glass and boxes
Presenting this set of slides with name - 8 Piece Pie Chart With Magnifying Glass And Boxes. This is a eight stage process. The stages in this process are 6 Piece Pie Chart, 6 Parts Pie Chart, 6 Segment Pie Chart.
-
 Deliver offers catalog price 6 piece pie chart
Presenting this set of slides with name - Deliver Offers Catalog Price 6 Piece Pie Chart. This is a six stage process. The stages in this process are 6 Piece Pie Chart, 6 Parts Pie Chart, 6 Segment Pie Chart.
-
 Deliver offers catalog price 7 piece pie chart
Presenting this set of slides with name - Deliver Offers Catalog Price 7 Piece Pie Chart. This is a seven stage process. The stages in this process are 6 Piece Pie Chart, 6 Parts Pie Chart, 6 Segment Pie Chart.
-
 Deliver offers catalog price 8 piece pie chart
Presenting this set of slides with name - Deliver Offers Catalog Price 8 Piece Pie Chart. This is a eight stage process. The stages in this process are 6 Piece Pie Chart, 6 Parts Pie Chart, 6 Segment Pie Chart.
-
 Break even analysis chart showing fixed and total costs
Presenting this set of slides with name - Break Even Analysis Chart Showing Fixed And Total Costs. This is a four stage process. The stages in this process are Break Even Analysis, Break Even Point, Break Even Level.
-
 Break even analysis chart showing total cost and revenue
Presenting this set of slides with name - Break Even Analysis Chart Showing Total Cost And Revenue. This is a three stage process. The stages in this process are Break Even Analysis, Break Even Point, Break Even Level.
-
 Break even analysis showing fixed costs with margin on variable costs
Presenting this set of slides with name - Break Even Analysis Showing Fixed Costs With Margin On Variable Costs. This is a two stage process. The stages in this process are Break Even Analysis, Break Even Point, Break Even Level.
-
 Break even analysis showing sales volume analysis
Presenting this set of slides with name - Break Even Analysis Showing Sales Volume Analysis. This is a eleven stage process. The stages in this process are Break Even Analysis, Break Even Point, Break Even Level.
-
 Break even analysis table showing products total costs and revenue
Presenting this set of slides with name - Break Even Analysis Table Showing Products Total Costs And Revenue. This is a two stage process. The stages in this process are Break Even Analysis, Break Even Point, Break Even Level.
-
Graphics are very appealing to eyes.
-
Wonderful templates design to use in business meetings.
-
Wonderful templates design to use in business meetings.
-
Understandable and informative presentation.
-
Innovative and Colorful designs.
-
Illustrative design with editable content. Exceptional value for money. Highly pleased with the product.
-
Amazing product with appealing content and design.
-
Enough space for editing and adding your own content.
-
Topic best represented with attractive design.
-
Great quality slides in rapid time.


