Charts, Graphs PowerPoint Designs, Presentation Charts Designs & PPT Graphics
- Sub Categories
-
- Arrows and Targets
- Bullet and Text Slides
- Charts and Graphs
- Circular Cycle Diagrams
- Concepts and Shapes
- Custom Flat Designs
- Dashboards and Measuring
- Flow Process
- Funnels
- Gears
- Growth
- Harvey Balls
- Idea Innovation and Light Bulbs
- Leadership
- Linear Process Diagrams
- Magnifying Glass
- Misc Other Graphics
- Opportunity and Handshake
- Organization Charts
- Puzzles
- Pyramids
- Roadmaps and Timelines
- Silhouettes
- Steps
- Strategic Planning Analysis
- SWOT Analysis
- Tables and Matrix
- Teamwork
- Technology and Communication
- Venn Diagrams
- Visuals and Illustrations
-
 Digital marketing big data media content measurement
Presenting Digital Marketing Big Data Media Content Measurement PowerPoint slide. This easy to download PPT theme can be easily opened and saved in various formats like JPG, PDF, and PNG. You can alter the font size, font type, font color, and shape used according to your needs as this PPT layout is 100% customizable. This PowerPoint template is Google Slides compatible and is easily accessible.
-
 Digital marketing conversions traffic sessions measurement dashboard
Presenting digital marketing conversions traffic sessions measurement dashboard. This is a digital marketing conversions traffic sessions measurement dashboard. This is a four stage process. The stages in this process are digital marketing, digital marketing dashboard, digital marketing funnel.
-
 Area chart sample presentation ppt
Presenting area chart sample presentation ppt. This is a area chart sample presentation ppt. This is a two stage process. The stages in this process are business, marketing, strategy, planning, finance.
-
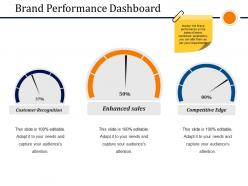
 Brand performance dashboard snapshot ppt sample presentations
Presenting brand performance dashboard ppt sample presentations. This is a brand performance dashboard Snapshot ppt sample presentations. This is a three stage process. The stages in this process are customer recognition, enhanced sales, competitive edge
-
 Donut pie chart presentation visual aids
Presenting donut pie chart presentation visual aids. This is a donut pie chart presentation visual aids. This is a four stage process. The stages in this process are business, marketing, strategy, planning, finance.
-
 Logo designing sources presentation powerpoint
Presenting logo designing sources presentation powerpoint. This is a logo designing sources presentation powerpoint. This is a four stage process. The stages in this process are business, marketing, strategy, planning, finance.
-
 Scatter with smooth lines and markers presentation powerpoint
Presenting scatter with smooth lines and markers presentation powerpoint. This is a scatter with smooth lines and markers presentation powerpoint. This is a nine stage process. The stages in this process are business, marketing, line, planning, finance
-
 Stacked bar presentation powerpoint example
Presenting this set of slides with name - Stacked Bar Presentation Powerpoint Example. This is a four stage process. The stages in this process are Business, Marketing, Finance, Slide Bar, Analysis.
-
 Stacked bar presentation powerpoint templates
Presenting stacked bar presentation powerpoint templates. This is a stacked bar presentation powerpoint templates. This is a four stage process. The stages in this process are business, marketing, bar graph, planning, finance
-
 Clustered bar powerpoint slide backgrounds
Presenting clustered bar powerpoint slide backgrounds. This is a clustered bar powerpoint slide backgrounds. This is a four stage process. The stages in this process are business, marketing, strategy, planning, bar.
-
 Dashboard powerpoint slide rules
Presenting dashboard powerpoint slide rules. This is a dashboard powerpoint slide rules. This is a three stage process. The stages in this process are business, marketing, strategy, planning, dashboard.
-
 Donut pie chart powerpoint slide show
Presenting donut pie chart powerpoint slide show. This is a donut pie chart powerpoint slide show. This is a four stage process. The stages in this process are business, marketing, strategy, planning, finance.
-
 Financial powerpoint slides design
Presenting financial powerpoint slides design. This is a financial powerpoint slides design. This is a three stage process. The stages in this process are business, marketing, strategy, planning, finance.
-
 Line chart powerpoint templates
Presenting Line Chart PowerPoint Templates. You can alter the font size, font type, font color, and shape used according to your needs as this PPT layout is 100% customizable. This PowerPoint template is Google Slides compatible and is easily accessible. This easy to download PPT theme can be easily opened and saved in various formats like JPG, PDF, and PNG.
-
 Scatter chart ppt sample presentations
Presenting scatter chart ppt sample presentations. This is a scatter chart ppt sample presentations. This is a nine stage process. The stages in this process are scatter, marketing, strategy, planning, finance.
-
 Circular pie chart with eight icons
Presenting circular pie chart with eight icons. This is a circular pie chart with eight icons. This is a eight stage process. The stages in this process are customer insight, consumer insight, customer experience.
-
 Circular pie chart with four divisions
Presenting circular pie chart with four divisions. This is a circular pie chart with four divisions. This is a four stage process. The stages in this process are customer insight, consumer insight, customer experience.
-
 Circular pie chart with six icons
Presenting circular pie chart with six icons. This is a circular pie chart with six icons. This is a six stage process. The stages in this process are customer insight, consumer insight, customer experience.
-
 Consumer insights analysis
Presenting this Consumer Insights Analysis PowerPoint presentation. The PPT is fully editable in PowerPoint and compatible with Google Slides. You can easily alter the font style, font color, and other parts. Save this template into popular document or image formats including PDF or JPEG. High-quality graphics always retain the original quality of the slide.
-
 Consumer insights offerings
Presenting this Consumer Insights Offerings PowerPoint presentation. The slide is 100% adaptable in PowerPoint and compatible with Google Slides. Modify the font style, font color, and other components with ease. Convert this template into common document or image formats such as PDF or JPEG. High-quality graphics always ensure that quality is not affected.
-
 Turnaround business factors with icon in center
Presenting turnaround business factors with icon in center. This is a turnaround business factors with icon in center. This is a eight stage process. The stages in this process are turnaround, looking back, u turn.
-
 Box plot days and time
Presenting box plot days and time. This is a box plot days and time. This is a four stage process. The stages in this process are box plot, statistical data, whiskers plot, statistical distribution.
-
 Box plot fair to ideal stages
Presenting box plot fair to ideal stages. This is a box plot fair to ideal stages. This is a five stage process. The stages in this process are box plot, statistical data, whiskers plot, statistical distribution.
-
 Box plot iqr lower middle and upper percentage
Presenting Box Plot Iqr Lower Middle And Upper Percentage template. This template supports both the widescreen (16:9) and the standard screen aspect ratios(4:3). Add appealing content like charts and graphs to the presentation. The slide is also compatible with Google Slides. This slide can be converted into common image formats like JPEG, PNG or document formats such as PDF. High-quality graphics will prevent the deterioration of slide components.
-
 Box plot marketing and research
Presenting Box Plot Marketing And Research template. This template supports both the widescreen (16:9) and the standard screen aspect ratios(4:3). Add appealing content like charts and graphs to the presentation. The slide is also compatible with Google Slides. This PPT can be converted into common image formats like JPEG, PNG or document formats such as PDF. High-quality graphics will prevent the deterioration of slide components.
-
 Box plot maximum minimum values chart
Presenting Box Plot Maximum Minimum Values Chart template. Add appealing content like charts and graphs to the presentation. This template supports both the widescreen (16:9) and the standard screen aspect ratios(4:3). The slide is also compatible with Google Slides. This slide can be converted into common image formats like JPEG, PNG or document formats such as PDF. High-quality graphics will prevent the deterioration of slide components.
-
 Box plot median quartile and interquartile range
Presenting Box Plot Median Quartile And Interquartile Range template. This slide supports both the widescreen (16:9) and the standard screen aspect ratios(4:3). Add appealing content like charts and graphs to the presentation. The slide is also compatible with Google Slides. This PPT can be converted into common image formats like JPEG, PNG or document formats such as PDF. High-quality graphics will prevent the deterioration of slide components.
-
 Box plot showing four green color sample
Presenting box plot showing four green color sample. This is a box plot showing four green color sample. This is a four stage process. The stages in this process are box plot, statistical data, whiskers plot, statistical distribution.
-
 Box plot three in graphical form
Presenting the Box Plot Three In Graphical Form. Add appealing content like charts and graphs to the presentation. This template supports both the widescreen (16:9) and the standard screen aspect ratios(4:3). The slide is also compatible with Google Slides. This slide can be converted into common image formats like JPEG, PNG or document formats such as PDF. High-quality graphics will prevent the deterioration of slide components.
-
 Box plot upper and lower extreme in linear manner
Presenting box plot upper and lower extreme in linear manner. This is a box plot upper and lower extreme in linear manner. This is a one stage process. The stages in this process are box plot, statistical data, whiskers plot, statistical distribution.
-
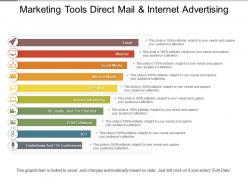
 Marketing tools direct mail and internet advertising
Presenting Marketing Tools Direct Mail And Internet Advertising. Save this into common images or document formats such as JPEG and PDF. The PPT also supports both the standard (4:3) and widescreen(16:9) aspect ratios. It is also compatible with Google Slides and MS PowerPoint. Alter the style, size, background and other attributes of the PPT. High-quality graphics will ensure that quality is not affected at any cost.
-
 Customer acquisition cost by channel powerpoint ideas
Presenting customer acquisition cost by channel powerpoint ideas. This is a customer acquisition cost by channel powerpoint ideas. This is a five stage process. The stages in this process are direct mail, email, online, search, dollar.
-
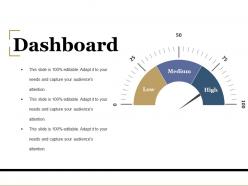
 Dashboard powerpoint presentation
Presenting dashboard powerpoint presentation. This is a dashboard powerpoint presentation. This is a three stage process. The stages in this process are low, medium, high, pie, percentage.
-
 Pie chart powerpoint slide backgrounds
Presenting this Pie Chart PowerPoint Slide Backgrounds PowerPoint presentation. The PPT can be downloaded and saved in common images or document formats like JPEG and PDF. The PPT supports both the standard(4:3) and widescreen(16:9) sizes. It is compatible with Google Slides and other related software. Alter the style, size, and the background of the slides. High-quality graphics ensure that distortion does not occur.
-
 Scatter chart powerpoint slide designs download
Presenting scatter chart powerpoint slide designs download. This is a scatter chart powerpoint slide designs download. This is a eight stage process. The stages in this process are profit, product, in percentage, growth, business.
-
 Stacked column powerpoint slide ideas
Presenting stacked column powerpoint slide ideas. This is a stacked column powerpoint slide ideas. This is a nine stage process. The stages in this process are profit, product, graph, growth, business.
-
 Stock chart powerpoint slide images
Presenting stock chart powerpoint slide images. This is a stock chart powerpoint slide images. This is a five stage process. The stages in this process are high, volume, low, open, close, product.
-
 Area chart ppt examples slides template 1
Presenting area chart ppt examples slides template 1. This is a area chart ppt examples slides template 1. This is a two stage process. The stages in this process are profit, product, area chart, growth, success.
-
 Brand performance dashboard powerpoint slide ideas
Presenting brand performance dashboard powerpoint slide ideas. This is a brand performance dashboard powerpoint slide ideas. This is a three stage process. The stages in this process are low, medium, high, dashboard, measurement.
-
 Clustered column line powerpoint templates template 1
Presenting clustered column line powerpoint templates template 1. This is a clustered column line powerpoint templates template 1. This is a three stage process. The stages in this process are profit, product, bar graph, year, success.
-
 Comparison powerpoint topics template 1
Presenting comparison powerpoint topics template 1. This is a comparison powerpoint topics template 1. This is a two stage process. The stages in this process are male, female, compare, in percentage, business.
-
 Financial ppt background designs template 1
Presenting financial ppt background designs template 1. This is a financial ppt background designs template 1. This is a three stage process. The stages in this process are icons, strategy, finance, percentage, business.
-
 Logo designing sources ppt background graphics
Presenting logo designing sources ppt background graphics. This is a logo designing sources ppt background graphics. This is a five stage process. The stages in this process are self employed, online design firm, local design, others, friends.
-
 Radar chart ppt design template 1
Presenting radar chart ppt design template 1. This is a radar chart ppt design template 1. This is a two stage process. The stages in this process are product, radar chart, shapes, business.
-
 Stacked line chart ppt design templates template 1
Presenting stacked line chart ppt design templates template 1. This is a stacked line chart ppt design templates template 1. This is a two stage process. The stages in this process are product, profit, line chart, year, growth.
-
 Stacked line with markers ppt images gallery
Presenting stacked line with markers ppt images gallery. This is a stacked line with markers ppt images gallery. This is a one stage process. The stages in this process are product, profit, growth, success, business.
-
 Customer acquisition cost by channel powerpoint slide designs download
Presenting customer acquisition cost by channel powerpoint slide designs download. This is a customer acquisition cost by channel powerpoint slide designs download. This is a five stage process. The stages in this process are business, marketing, graph, growth, icons.
-
 Customer acquisition cost by channel powerpoint slide design ideas
Presenting customer acquisition cost by channel powerpoint slide design ideas. This is a customer acquisition cost by channel powerpoint slide design ideas. This is a five stage process. The stages in this process are business, marketing, growth, graph, online.
-
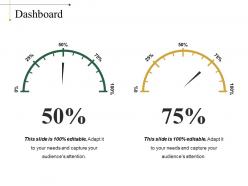
 Dashboard powerpoint slide presentation tips
Presenting dashboard powerpoint slide presentation tips. This is a dashboard powerpoint slide presentation tips. This is a two stage process. The stages in this process are dashboard, percentage, business, marketing, process.
-
 Radar with markers ppt sample presentations
Presenting radar with markers ppt sample presentations. This is a radar with markers ppt sample presentations. This is a two stage process. The stages in this process are business, marketing, chart, finance, strategy.
-
 Comparison powerpoint slide background designs
Presenting comparison powerpoint slide background designs. This is a comparison powerpoint slide background designs. This is a two stage process. The stages in this process are comparison, business, marketing, planning, strategy.
-
 Dashboard powerpoint slide presentation sample
Presenting dashboard powerpoint slide presentation sample. This is a dashboard powerpoint slide presentation sample. This is a three stage process. The stages in this process are dashboard, business, marketing, process.
-
 Filled area powerpoint slide templates download
Presenting filled area powerpoint slide templates download. This is a filled area powerpoint slide templates download. This is a five stage process. The stages in this process are business, marketing, finance, radar, chart.
-
 Area chart sample of ppt
Presenting Area Chart Sample Of Ppt. The slide is extremely easy to download and can be saved in the popular image or document formats such as JPEG and PDF. The slideshow supports both the standard and widescreen sizes. It is having compatibility with Google Slides and other office suites. Alter the style, size, and background of the slides. High-quality graphics ensure that pixelation does not occur.
-
 Bar chart sample ppt presentation
Presenting Bar Chart Sample Ppt Presentation Presentation. Our PPT layout is compatible with Google Slides. You can download this PPT theme in various formats like PDF, PNG, and JPG. This PowerPoint template is completely editable and you can modify the font size, font type, and shapes as per your requirements. This PPT slide is available at 4:3 and 16:9 aspect ratios.
-
 Comparison powerpoint graphics
Presenting comparison powerpoint graphics. This is a comparison powerpoint graphics. This is a two stage process. The stages in this process are male, female, percentage, compare, business.
-
 Customer acquisition cost by channel powerpoint layout
Presenting customer acquisition cost by channel powerpoint layout. This is a customer acquisition cost by channel powerpoint layout. This is a five stage process. The stages in this process are search, yellow pages, online, email, direct mail.
-
 Dashboard snapshot powerpoint shapes
Presenting dashboard snapshot powerpoint shapes. This is a dashboard powerpoint shapes. This is a three stage process. The stages in this process are low, medium, high, dashboard, measurement.
-
 Radar chart powerpoint slide inspiration
Presenting radar chart powerpoint slide inspiration. This is a radar chart powerpoint slide inspiration. This is a two stage process. The stages in this process are product, shapes, business, marketing.
-
 Scatter chart powerpoint slide introduction
Presenting scatter chart powerpoint slide introduction. This is a scatter chart powerpoint slide introduction. This is a two stage process. The stages in this process are product, in percentage, growth, success, business.
-
Amazing product with appealing content and design.
-
Colors used are bright and distinctive.
-
Excellent template with unique design.
-
Awesomely designed templates, Easy to understand.
-
Easily Editable.
-
It saves your time and decrease your efforts in half.
-
Easy to edit slides with easy to understand instructions.
-
Illustrative design with editable content. Exceptional value for money. Highly pleased with the product.
-
Design layout is very impressive.
-
Illustrative design with editable content. Exceptional value for money. Highly pleased with the product.


