Charts, Graphs PowerPoint Designs, Presentation Charts Designs & PPT Graphics
- Sub Categories
-
- Arrows and Targets
- Bullet and Text Slides
- Charts and Graphs
- Circular Cycle Diagrams
- Concepts and Shapes
- Custom Flat Designs
- Dashboards and Measuring
- Flow Process
- Funnels
- Gears
- Growth
- Harvey Balls
- Idea Innovation and Light Bulbs
- Leadership
- Linear Process Diagrams
- Magnifying Glass
- Misc Other Graphics
- Opportunity and Handshake
- Organization Charts
- Puzzles
- Pyramids
- Roadmaps and Timelines
- Silhouettes
- Steps
- Strategic Planning Analysis
- SWOT Analysis
- Tables and Matrix
- Teamwork
- Technology and Communication
- Venn Diagrams
- Visuals and Illustrations
-
 Economic trade cycle with quarterly growth percentage
This graph or chart is linked to excel, and changes automatically based on data. Just left click on it and select edit data. Introducing our Economic Trade Cycle With Quarterly Growth Percentage set of slides. The topics discussed in these slides are Stable Growth, Recession, Economy. This is an immediately available PowerPoint presentation that can be conveniently customized. Download it and convince your audience.
-
 Market returns through economic cycle
This graph or chart is linked to excel, and changes automatically based on data. Just left click on it and select edit data. Introducing our Market Returns Through Economic Cycle set of slides. The topics discussed in these slides are Economic Growth, Skills, Market Average. This is an immediately available PowerPoint presentation that can be conveniently customized. Download it and convince your audience.
-
 Dashboard Snapshot of business support team performance report
This graph or chart is linked to excel, and changes automatically based on data. Just left click on it and select edit data. Introducing our Dashboard Snapshot Of Business Support Team Performance Report set of slides. The topics discussed in these slides are Dashboard Of Business Support Team Performance Report. This is an immediately available PowerPoint presentation that can be conveniently customized. Download it and convince your audience.
-
 Manager report to identify the problems in the team
This graph or chart is linked to excel, and changes automatically based on data. Just left click on it and select edit data. Introducing our Manager Report To Identify The Problems In The Team set of slides. The topics discussed in these slides are Project Completion, Overdue Tasks, Completion. This is an immediately available PowerPoint presentation that can be conveniently customized. Download it and convince your audience.
-
 Balancing Decision Charts Powerpoint Presentation Slides
These high quality, editable pre-designed powerpoint slides have been carefully created by our professional team to help you impress your audience. Each graphic in every slide is vector based and is 100% editable in powerpoint. Each and every property of any slide - color, size, shading etc can be modified to build an effective powerpoint presentation. Use these slides to convey complex business concepts in a simplified manner. Any text can be entered at any point in the powerpoint slide. Simply DOWNLOAD, TYPE and PRESENT!
-
 Performance Charts Side By Side Text Boxes In Line Powerpoint Diagram Templates Graphics 712
These high quality, editable pre-designed performance charts side by side text boxes in line powerpoint diagram templates graphics 712 powerpoint slides and powerpoint templates have been carefully created by our professional team to help you impress your audience. Each graphic in every powerpoint slide is vector based and is 100% editable in powerpoint.
-
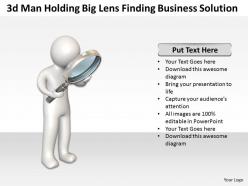 3d Man Holding Big Lens Finding Business Solution Ppt Graphic Icon
High resolution PPT slides addressing business solutions in depth. Modifiable background with color, font and layout. Authentic and relevant content with flexible data. Can be easily converted into JPG or PDF format. Beautiful 3D man holding big lens PowerPoint info graphics with alluring graph for comparison and fascinating figures to illustrate the concept. Benefitted for students, researchers and business professionals.
-
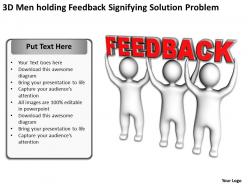 3d Men Holding Feedback Signifying Solution Problem Ppt Graphic Icon
We are proud to present our 3d men holding feedback signifying solution problem ppt graphic icon. Use this PowerPoint Diagram which shows three men standing together holding feedback. It portrays the concept of response, reaction, comment, criticism, advice, pointer, opinion, view and reply etc. They will enhance the essence of your viable ideas.
-
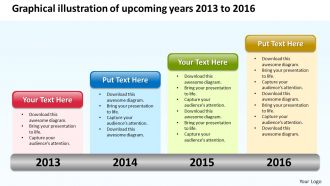 Product Roadmap Timeline Graphical Illustration Of Upcoming Years 2013 To 2016 Powerpoint Templates Slides
This timeline graph designed deck of slides is fully favorable for professionals, all you have to do is just download it and edit the text used in it. The font size, font style and font color is also customizable and you make changes to it according to your own requirements. You can also add or remove any kind of graphical illustration that is used in this slideshow depicting the product roadmap. This template can be saved in PDF or JPG format easily. When you download this graphical illustration, you get both widescreen i.e. ratio of 16:9 and standard screen i.e. ratio of 4:3 PPT files.
-
 Business Flowcharts Visual Representation Of Strategy Roadmaps Powerpoint Templates
We are proud to present our business flowcharts visual representation of strategy roadmaps powerpoint templates. Business PowerPoint Diagram slideshows six arrows representing year timeline. It shows a plan that matches short-term and long-term goals with specific technology solutions to help meet those goals. Deliver amazing presentations to mesmerize your audience.
-
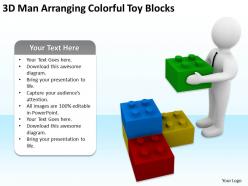 3d Man Arranging Colorful Toy Blocks Ppt Graphics Icons Powerpoint
High resolution PPT template. Highly prompt content that are logical, accurate with flexible data. Amendable background with color, layout and font. We have designed 3D man colorful toy PowerPoint info graphics with alluring graph for comparison and fascinating figures to illustrate the concept. Can be easily converted into JPG or PDF format. Benefitted for students, researchers and business professionals.
-
 Bar Graphs And Histograms Success Powerpoint Templates Themes
We are proud to present our bar graphs and histograms success powerpoint templates themes. Our bar graphs and histograms success PowerPoint templates themes will provide weight to your words. They will bring out the depth of your thought process. Words like arrows fly straight and true. Use our bar graphs and histograms success PowerPoint templates themes to make them hit bulls eye every time.
-
 Bar Graphs And Pie Charts Arrow Business Powerpoint Templates Themes
We are proud to present our bar graphs and pie charts arrow business powerpoint templates themes. Our bar graphs and pie charts arrow business PowerPoint templates themes give you the basic framework of your talk. Give it the shape you desire with your wonderful views. Our bar graphs and pie charts arrow business PowerPoint templates themes are the lungs of your talk. Fill them with the oxygen of your in-depth thought process.
-
 Bar Graphs And Pie Charts Sale Business Powerpoint Templates Themes
Pixel-friendly images and graphics in the icons. No effect on picture quality when used on a wide screen display. Attune well with the major online and offline softwares. Provided instructions to customize the content and the slide icons. Useful for the business entrepreneurs and the professional presenters.
-
 Bar Graphs Powerpoint Chart Structure Templates And Themes
We are proud to present our bar graphs powerpoint chart structure templates and themes. You have all the ingredients to create the taste of success. Garnish your recipe with our bar graphs PowerPoint chart structure templates and themes and enhance its flavor. Our bar graphs PowerPoint chart structure templates and themes are created by innovative young minds. Guaranteed to fit presentations of all kinds.
-
 3d Man Holds Puzzle To Reach Team Business Powerpoint Templates Ppt Themes And Graphics 0113
We are proud to present our 3d man holds puzzle to reach team business powerpoint templates ppt themes and graphics 0113. Use our people powerpoint templates to steer your racing mind. Hit the right buttons and spur on your audience. Embellish your thoughts by using our business powerpoint templates. They will help you illustrate the brilliance of your ideas.
-
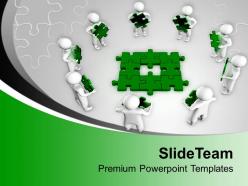 3d Team Found Solution Teamwork Concept Powerpoint Templates Ppt Themes And Graphics 0113
We are proud to present our 3d team found solution teamwork concept powerpoint templates ppt themes and graphics 0113. Our business powerpoint templates are the sinews of your lecture. Give them the muscle of your vibrant thoughts. Our success powerpoint templates give you the basic framework of your talk. Give it the shape you desire with your wonderful views.
-
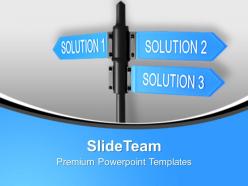 Business Solution Signpost Powerpoint Templates Ppt Themes And Graphics 0113
We are proud to present our business solution signpost powerpoint templates ppt themes and graphics 0113. Our success powerpoint templates are stepping stones to success. Climb them steadily and reach the top. Our marketing powerpoint templates are the strands of your mental loom. Weave them together and produce a magical tapestry.
-
 Org Charts In Powerpoint Demonstration Of Hierarchy Relationships Templates 0515
Amazing top notch visuals. Pictures don't pixelate when anticipated on wide screen. Aftereffect of inborn research and conceptualizing done by our specialists. Straight forward presentation slides concept. Perfect with various programming and configuration choices. 100 percent editable slide outline. Customize the substance with organization particular name and logo. Utilized by the examination office, IT office, advertisers, understudies, instructors and deals proficient.
-
 Management Consulting Charts For Monthly Report Powerpoint Templates Ppt Backgrounds Slides 0618
Superior quality and professionally arranged PowerPoint visual. Utilization of astonishing and extraordinary tones for most outrageous visual intrigue. Simplicity of changing each fragment of the PPT design. Direction for executing the movements has been suited offer assistance. Change and alter the presentation by including the association name and logo. Perfect with moved number of association decisions. Perfect with various item choices open both on the web and detached. Generally used by business visionaries, business strategists, business examiners, advertisers, dealers, accomplices, understudies and teachers.
-
 0314 Business Charts Dashboard Design
Supreme Quality PPT presentation layouts. Makes the entire information look interesting and relevant. Helps to make any comparisons ion order to make better decisions and strategies. Well matched framework with Google. Result and performance oriented PPT presentation layouts. Can fit into any presentation seamlessly. Allows widescreen view for enhanced vision. Completely amendable by the user by following simple instructions.
-
 0414 Donut And Column Business Charts Powerpoint Graph
Entirely editable PowerPoint presentation slide. Adaptable with several software programs like JPEG and PDF. Preference to include and remove content as per the commerce need. Available in both standard as well as in widescreen slide. Gives a professional perspective to your PowerPoint slide. Personalization of PPT template is possible as per your requirement. Similar samples available with different nodes and stages.
-
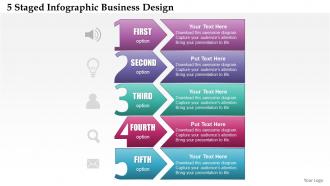 0514 Business Consulting Diagram 5 Staged Infographic Business Design Powerpoint Slide Template
They have an infinite PPT designs. They are also steep and high quality PowerPoint graphics. These are also handy for the management studies, technology researchers, business professionals etc. These PPT slides have rewrite able contents, symbols, formats and PowerPoint Image etc. These are fully factual with plenty of room to add relevant title or subtitle, Consistent with Google slides, compatible with other file layouts as PDF or JPG.
-
 0514 Gantt Charts In Project Management Powerpoint Presentation
High definition PPT presentation diagrams. Organises the complex data in a well-arranged manner to enable easy understanding and memorising of the information. Packed with advanced presentation patterns and icons they will surely stun the viewers. Extremely versatile and dynamic PPT presentation templates. Changeable format which provides no compatibility issues. Downloads instantly to save your valuable time. Allows complete modification by any user at any time without any issues.
-
 1214 Four Colored Pie Charts For Result Analysis Data Driven Powerpoint Slide
We are proud to present our 1214 four colored pie charts for result analysis data driven powerpoint slide. Four colored pie charts are used to craft this power point template slide. This PPT slide contains the concept of data driven result analysis. This PPT can be used for business and finance related presentations
-
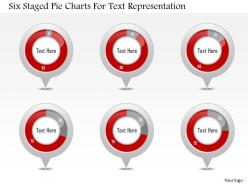 1214 six staged pie charts for text representation powerpoint slide
We are proud to present our 1214 six staged pie charts for text representation powerpoint slide. six staged pie charts are used to craft this power point template slide. This PPT slide contains the concept of process analysis. This analysis can be used for business and marketing related presentations.
-
 0115 3d Timeline Infographics With Multiple Icons Powerpoint Template
Easy access to convert the slide into JPEG and PDF document. Presentation design comes in standard and widescreen view. PowerPoint slide created with high quality resolution design. 100% editable Presentation design as can be edited with ease. Downloadable with different nodes and stages. Download is quick and can be easily inserted in the presentation. Suitable for event managers, project managers, business leaders.
-
 0115 Target Dart With Growth Arrow And Bar Graph Powerpoint Template
The slides are equipped with the superior quality resolution to give you the best experience of visual play. The affinity of the slide with Google slides and other software options is it's another attractive feature. Customize endlessly with colour, grouping and orientation arrangement. The option to download the template extends to file format of JPG and PDF.
-
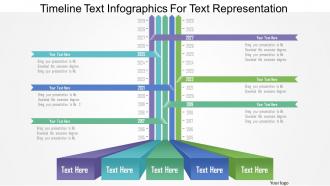 Ap timeline text infographics for text representation powerpoint template
Fully compatible with Google slides and other commonly used softwares. Useful for every single company who maintains a timeline of events. High quality graphics retain excellent quality on bigger and wider screens. No pixilation. Slide is changeable into common formats like PDF or JPEG. Add company logo or trade name to prevent plagiarism. Customisable color schemes and option to change font sizes.
-
 Business Man Leading Team For Process Management Ppt Graphics Icons
We are proud to present our business man leading team for process management ppt graphics icons. This power point template diagram has been crafted with graphic of 3d men and gears. This PPT diagram contains the concept of team leadership and process management. Use this PPT diagram for business presentations and show related topics in a graphical manner.
-
 Discussion On New Idea For Success Ppt Graphics Icons
We are proud to present our discussion on new idea for success ppt graphics icons. Add this PPT diagram in your business presentations to show the concept of new idea generation. This PPT diagram contains the graphic of 3d man and board with bulb sketch. Use this PPT diagram for business success related topics in any presentations.
-
 Multiple Business Idea Generation Ppt Graphics Icons
We are proud to present our multiple business idea generation ppt graphics icons. This power point template diagram has been crafted with graphic of gears and one man. This PPT diagram contains the concept of idea generation. Use this PPT diagram for business presentations.
-
 Reach On Top For Success Ppt Graphics Icons
We are proud to present our reach on top for success ppt graphics icons. Red colored graphic of 3d man over the cubes has been used to craft this PPT diagram. This PPT diagram contains the concept of success. Use this PPT diagram for business and leadership related presentations.
-
 Right Idea Selection Techniques Ppt Graphics Icons
We are proud to present our right idea selection techniques ppt graphics icons. This power point template has been crafted with graphic of gears and 3d man. This PPT diagram contains the concept of idea selection techniques. Use this PPTdiagram for business and sales related presentations.
-
 Right Selection For Skilled People Ppt Graphics Icons
We are proud to present our right selection for skilled people ppt graphics icons. Concept of right selection of skilled people has been displayed in this PPT diagram. This PPT diagram contains the graphic of peoples and magnifier. Use this PPT diagram for business presentations.
-
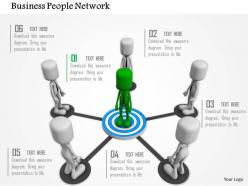 Target Achievement Network For Business Ppt Graphics Icons
We are proud to present our target achievement network for business ppt graphics icons. Concept of target achievement has been displayed in this PPT diagram. To show this concept we have used graphic of target board and team network. Use this PPT diagram for business and marketing presentations.
-
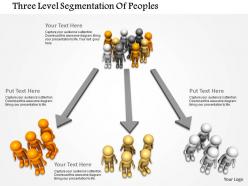 Three Level Segmentation Of Peoples Ppt Graphics Icons
We are proud to present our three level segmentation of peoples ppt graphics icons. Three level segmentation has been displayed in this power point template with suitable graphics. This PPT diagram contains the graphics of groups. Use this PPT diagram for business and sales strategy related topics in any presentation.
-
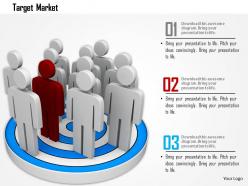 Unique And Skilled Leader For Target Achievement Ppt Graphics Icons
We are proud to present our unique and skilled leader for target achievement ppt graphics icons. This power point template diagram has been crafted with graphic of team of skilled peoples and one leader. Concept of target achievement and leadership has been defined in this PPT diagram. Use this PPT for business and marketing related presentations.
-
 Two Charts Pros And Cons Indication Flat Powerpoint Design
Presenting two charts pros and cons indication flat PowerPoint design. This PPT slide offers you plenty of space to put in titles and sub titles. High resolution based presentation layout, does not change the image quality even after resizing. This presentation is fully compatible with Google slides. Quick downloading speed and simple editing options in color text and fonts. PPT icons can easily be changed into JPEG and PDF applications. This diagram has been designed for entrepreneurs, corporate and business managers. Easy to use, edit and you can design attractive slides within few minutes.
-
 Notepad Partnership Introduction Bar Graph Ppt Icons Graphics
All graphics are hundred percent adaptable in the layout slides. Great quality pictures can be used to compliment message. Functions outstandingly in Windows 7, 8, 10, XP, Vista and all PowerPoint form. Altering in presentation slide show ought to be conceivable from wherever by any device. Similarity with Google slides. PPT sensible offers content measurement which can be examined from a division.
-
 Business Team With Pie Charts For Data Driven Strategy Powerpoint Slides
Hassle free download in quick and easy steps. Change orientation and sizes of PPT images to suit your need. Insert company name, brand name, tagline, logo etc. and suitable text to personalize. Fully modifiable color scheme and contrast of PPT infographics. Easily convertible to JPG or PDF and runs smoothly with Google slides. No change in the high resolution post editing.
-
 Five Staged Modern Infographics Management Flat Powerpoint Design
It contains complete set of high resolution ppt slides to address management and business related concept. Content is relevant and flexible. It can easily be converted to JPG and PDF format. Editable background with color, layout and font. Beneficial for business professional, students and researchers. Appealing graphs for comparison and fabulous figure to illustrate the concept.
-
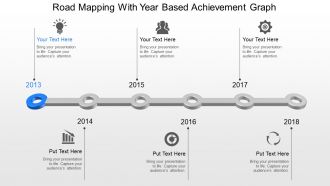 Rm Road Mapping With Year Based Achievement Graph Powerpoint Template
Presenting rm road mapping with year-based achievement graph PowerPoint template. Plentiful color choices, briskness and effects. Text and graphics can be placed on the slide. PPT diagram is 100% compatible with Google slide. Freely edit the icons, color, size and orientation. Supports to work offline and later upload the changes. Businessmen, stock market, sales and management professionals can put to use the presentation slide show.
-
 Stack Of Dollar Coins Rising Graph To Dos Ppt Icons Graphics
This PPT slide is a reliable way to present your company's financial matters and its practice related ideas. Engaging figures shown in this template can be resized and their colors can be changed according to your liking. Downloading this slide will give you access to its full version. You can be easily convert it into PDF or JPG formats.
-
 Percentage Pie Charts For Merger And Acquisitions Powerpoint Slides
Maintenance of overwhelming quality visuals all through the presentation. Compatible with wide screen yield. Can be satisfactorily used with any number of on the web and detached programming. The business slide outline is concordant with various courses of action decisions. Give it a more modified look with your association logo and name. Edit the PPT shape, tones, shade, substance and then some. Used by advancing guides, agents, advertisers, merchants, and business people.
-
 Pie Charts Graph With Percentage Analysis Powerpoint Slides
Icons can be resized and colored. Color, style and position can be standardized, supports font size which can be read from a distance. PPT slide is compatible with Microsoft 2010 and 2013 versions. Beneficial for businessman, representatives of big or small organizations for setting the business or meeting agendas for analysis. Background in PPT graphic is subtle and consistent to avoid presentation look flashy or vibrant.
-
 Three Meters Dashboard Charts For Analysis Powerpoint Slides
These designs create a never-ending connection between the presentation and the audience. For the Delivery of the Organisational objective these patterns act as a perfect medium. They are entirely editable. They can be viewed on big screens for more clarity and better vision. As an outcome the audience experience top notch quality presentations.
-
 Three Dashboard Snapshot Charts For Business Data Powerpoint Slides
High caliber of pictures and symbols. Strikingly wonderful Presentation slide. Effectively amendable PowerPoint configuration as can be altered easily. Access to exhibit the PPT format in widescreen see. Versatile outlines as good with Google slides. Downloading is simple and can be changed into JPEG and PDF. Ideal for business moderators, administration and the business people.
-
 Three Dashboard Snapshot Charts For Data Segmentation Powerpoint Slides
Presenting three dashboard snapshot charts for data segmentation powerpoint slides. This Power Point template slide has been crafted with graphic of three dashboard chart and percentage. This PPT diagram slide contains the concept of data segmentation. Use this PPT slide for business and marketing related presentations.
-
 Comparison Charts With Percentage Powerpoint Slides
Presenting, comparison charts with the percentage of PowerPoint slides. Adjust the infographics according to your data. Personalize the percentage value and color schemes. Convenient and fast to download with ease. Adjust the size and orientation of presentation infographics to your liking. Alter the text to suit the context. Include your own logo, company mane, trademark, brand-name etc. No alteration in original high resolution of PPT images after editing. Convert into JPEG/PDF as per requirement.
-
 Four Percentage Charts For Comparison Powerpoint Slides
The slides are equipped with superior resolution. Modify the slide outlook by changing the colors, size, and placement of graphics. The option of easy downloading is accompanied with the convenient saving of the template in multiple formats. Play the Ppt template in Google slides anytime anywhere. Remove the Slide-Team's watermark after completing the downloading process. Utilize the ample space for the content addition.
-
 Five Staged Pie Charts With Percentage Analysis Powerpoint Slides
Capture the interest of your audience with a vibrant showcase of supreme quality visuals. Customize on the colour part, orientation scheme, and size restructuring to cast a suitable interface of the slide. Play it on Google Slides with a convenient download option in multiple file formats. Utilize the ample text space for an explanatory write-up. A complete user guide follows the slide for easy transformation.
-
 Four Staged Tags And Pie Charts Percentage Analysis Powerpoint Slides
Presenting four staged tags and pie charts percentage analysis powerpoint slides. This Power Point template slide has been crafted with graphic of four staged tags and pie charts. This PPT slide contains the concept of percentage analysis. Use this PPT slide for business and marketing related presentations.
-
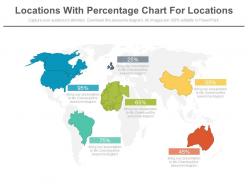 Five Locations With Percentage Charts For Locations Powerpoint Slides
Presenting five locations with percentage charts for locations powerpoint slides. This Power Point template slide has been crafted with graphic of five locations and percentage chart. This PPT slide contains the concept of company locations representation. Use this PPT slide for business and marketing related presentations.
-
 Web Development Seo Monitoring Content Optimization Web Design Ppt Icons Graphics
Presenting web development seo monitoring content optimization web design ppt icons graphics. This Power Point icon template diagram has been crafted with graphic of web and technology icons. This icon PPT diagram contains the concept of SEO monitoring and content optimization. Use this icon PPT for web and technology related presentations.
-
 Bank Safe Debit Credit Card Calendar Ppt Icons Graphics
Presenting bank safe debit credit card calendar ppt icons graphics. This Power Point icon template diagram has been crafted with graphic of bank, safe and debit card icons. This icon PPT diagram contains the concept of financial management. Use this icon PPT for business and finance related presentations.
-
 Business Idea Generation Process Flow Currency Loss Ppt Icons Graphics
Presenting business idea generation process flow currency loss ppt icons graphics. This Power Point icon template diagram has been crafted with graphic of business icons. This icon PPT diagram contains the concept of business idea generation and process flow indication. Use this icon PPT for business and finance related presentations.
-
 Clipboard Time Based Report Application Ppt Icons Graphics
Presenting clipboard time based report application ppt icons graphics. This Power Point icon template diagram has been crafted with graphic of clipboard, pictogram and data chart icons. This icon PPT diagram contains the concept of business report formation. Use this icon PPT for business and finance related presentations.
-
 Communication Network Time Management News Announcement Ppt Icons Graphics
Presenting communication network time management news announcement ppt icons graphics. This Power Point icon template diagram has been crafted with graphic of communication, network and news icons. This icon PPT diagram contains the concept of news announcement and time management .Use this icon PPT for business and finance related presentations.
-
 Date Scheduler Global Financial Matters Checklist Report Ppt Icons Graphics
Presenting date scheduler global financial matters checklist report ppt icons graphics. This Power Point icon template diagram has been crafted with graphic of date scheduler, globe and checklist icons. This icon PPT diagram contains the concept of global financial matters analysis and checklist formation .Use this icon PPT for business and finance related presentations.
-
Really like the color and design of the presentation.
-
Unique design & color.
-
Content of slide is easy to understand and edit.
-
Nice and innovative design.
-
Commendable slides with attractive designs. Extremely pleased with the fact that they are easy to modify. Great work!
-
Awesomely designed templates, Easy to understand.
-
Easily Editable.
-
Understandable and informative presentation.
-
Very unique and reliable designs.
-
Innovative and attractive designs.


