- Sub Categories
-
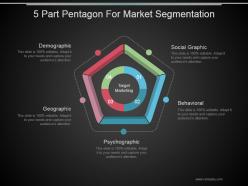 5 part pentagon for market segmentation ppt slide design
Presenting 5 part pentagon for market segmentation ppt slide design. This is a 5 part pentagon for market segmentation ppt slide design. This is a five stage process. The stages in this process are demographic, geographic, psychographic, behavioral, social graphic.
-
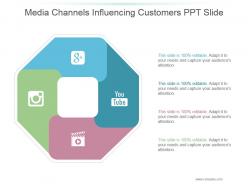 Media channels influencing customers ppt slide
Presenting media channels influencing customers ppt slide. This is a media channels influencing customers ppt slide. This is a four stage process. The stages in this process are business, marketing, social sites, management, channels.
-
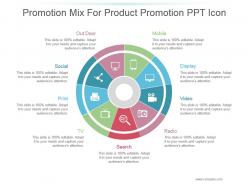 Promotion mix for product promotion ppt icon
Presenting promotion mix for product promotion ppt icon. This is a promotion mix for product promotion ppt icon. This is a nine stage process. The stages in this process are social, out door, print, tv, search, radio, video, display, mobile.
-
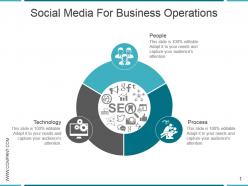 Social media for business operations powerpoint slides design
Presenting social media for business operations powerpoint slides design. This is a social media for business operations powerpoint slides design. This is a three stage process. The stages in this process are people, process, technology.
-
 Cost reduction action plan ppt examples
Presenting cost reduction action plan ppt examples. This is a cost reduction action plan ppt examples. This is a six stage process. The stages in this process are business, marketing, process, management, circle.
-
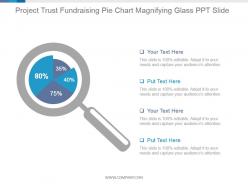 Project trust fundraising pie chart magnifying glass ppt slide
Presenting project trust fundraising pie chart magnifying glass ppt slide. This is a project trust fundraising pie chart magnifying glass ppt slide. This is a four stage process. The stages in this process are percentage, pie, magnifying glass, search, business, marketing.
-
 Banking innovation sample of ppt
Presenting banking innovation sample of ppt. This is a banking innovation sample of ppt. This is a five stage process. The stages in this process are world of e banking, credit scoring, retail services, business banking, global services, send money.
-
 Business progress chart sample ppt presentation
Presenting business progress chart sample ppt presentation. This is a business progress chart sample ppt presentation. This is a four stage process. The stages in this process are factors for financial success, manpower, setting goals, success, team strategy.
-
 Marketing matrix powerpoint presentation templates
Presenting marketing matrix powerpoint presentation templates. This is a marketing matrix powerpoint presentation templates. This is a four stage process. The stages in this process are marketing planning tool, brand integrity, experience, brand image, marketing, positioning, brand interaction, differentiation, brand identity.
-
 6 staged circular diagram donut ppt sample
Presenting 6 staged circular diagram donut ppt sample. This is a 6 staged circular diagram donut ppt sample. This is a six stage process. The stages in this process are process, icon, communication, cycle, business.
-
 Pie chart for business opportunity ppt slide
Presenting pie chart for business opportunity ppt slide. This is a pie chart for business opportunity ppt slide. This is a seven stage process. The stages in this process are pie, chart, percentage, financials, process.
-
 Information security example of ppt presentation
Presenting information security example of ppt presentation. This is a information security example of ppt presentation. This is a six stage process. The stages in this process are data discovery, application security, cloud assessment, digital forensics, rapid response, smart credentials, maturity of platforms simplifies the development process.
-
 Doughnut chart for data visualization comparison of percentages powerpoint slides design
Presenting doughnut chart for data visualization comparison of percentages powerpoint slides design. This is a doughnut chart for data visualization comparison of percentages powerpoint slides design. This is a four stage process. The stages in this process are business, marketing, financial, percentage, increase.
-
 Doughnut chart for numbers comparison data analysis slide powerpoint topics
Presenting doughnut chart for numbers comparison data analysis slide powerpoint topics. This is a doughnut chart for numbers comparison data analysis slide powerpoint topics. This is a six stage process. The stages in this process are circular, process, percentage, financial, business.
-
 Financial slide showing budget allocation ppt background
Presenting financial slide showing budget allocation ppt background. This is a financial slide showing budget allocation ppt background. This is a seven stage process. The stages in this process are circular, process, percentage, financial, budget.
-
 5 business person silhouettes for team profile sample ppt presentation
Presenting 5 business person silhouettes for team profile sample ppt presentation. This is a 5 business person silhouettes for team profile sample ppt presentation. This is a five stage process. The stages in this process are silhouettes, management, communication, business, marketing.
-
 Pie chart graph for business performance review ppt design templates
Presenting pie chart graph for business performance review ppt design templates. This is a pie chart graph for business performance review ppt design templates. This is a four stage process. The stages in this process are pie, percentage, business, finance, marketing.
-
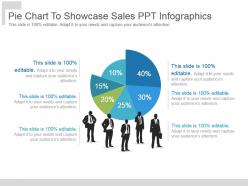 Pie chart to showcase sales ppt infographics
Presenting pie chart to showcase sales ppt infographics. This is a pie chart to showcase sales ppt infographics. This is a six stage process. The stages in this process are business, marketing, strategy, success, percentage.
-
 Media budget allocation pie chart ppt example file
Presenting media budget allocation pie chart ppt example file. This is a media budget allocation pie chart ppt example file. This is a five stage process. The stages in this process are business, marketing, strategy, management, success.
-
 Pie chart for financial analysis ppt examples
Presenting pie chart for financial analysis ppt examples. This is a pie chart for financial analysis ppt examples. This is a seven stage process. The stages in this process are business, marketing, strategy, management, success.
-
 Business process management life cycle powerpoint images
Presenting business process management life cycle powerpoint images. This is a business process management life cycle powerpoint images. This is a five stage process. The stages in this process are icons, strategy, pie, process, management.
-
 Circular diagram to show business management process powerpoint slide
Presenting circular diagram to show business management process powerpoint slide. This is a circular diagram to show business management process powerpoint slide. This is a six stage process. The stages in this process are business, marketing, management, process, strategy.
-
 Media objectives for business powerpoint slides templates
Presenting media objectives for business powerpoint slides templates. This is a media objectives for business powerpoint slides templates. This is a four stage process. The stages in this process are values, communication, satisfaction, product, engage, our objectives.
-
 Target market segment strategy ppt examples slides
Presenting target market segment strategy ppt examples slides. This is a target market segment strategy ppt examples slides. This is a four stage process. The stages in this process are socialgraphic, behavioral, psychographic, geographic, demographic, target marketing.
-
 5 product life cycle steps powerpoint slide templates
Presenting 5 product life cycle steps powerpoint slide templates. This is a 5 product life cycle steps powerpoint slide templates. This is a five stage process. The stages in this process are market analysis, define user need, mix segmentation, inventory stratification, product utilization.
-
 Business analysis framework sample ppt presentation
Presenting business analysis framework sample ppt presentation. This is a business analysis framework sample ppt presentation. This is a four stage process. The stages in this process are market share, winners, breakup targets, losers, take overs targets, revenue growth.
-
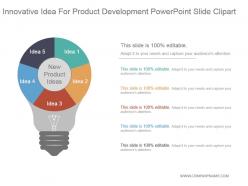 Innovative idea for product development powerpoint slide clipart
Presenting innovative idea for product development powerpoint slide clipart. This is a innovative idea for product development powerpoint slide clipart. This is a five stage process. The stages in this process are idea, new product ideas.
-
 Project feasibility report powerpoint graphics
Presenting project feasibility report powerpoint graphics. This is a project feasibility report powerpoint graphics. This is a five stage process. The stages in this process are technical feasibility, operational feasibility, economic feasibility, legal requirement feasibility, scheduling requirement feasibility, summary of gathered results, recommendations for business, project analysis.
-
 Cost structure analysis powerpoint slide deck
Presenting cost structure analysis powerpoint slide deck. This is a cost structure analysis powerpoint slide deck. This is a seven stage process. The stages in this process are wages, purchases, rent and utilities, depreciation, other, profit, marketing.
-
 Relative market share of different competitors ppt diagrams
Presenting relative market share of different competitors ppt diagrams. This is a relative market share of different competitors ppt diagrams. This is a six stage process. The stages in this process are competitor, market share.
-
 Market trends analysis percentage spending by region powerpoint slide introduction
Presenting market trends analysis percentage spending by region powerpoint slide introduction. This is a market trends analysis percentage spending by region powerpoint slide introduction. This is a two stage process. The stages in this process are western europe, asia, north america, eastern europe, latin america, middle east, africa.
-
 Campaign budget plan pie chart powerpoint ideas
Presenting campaign budget plan pie chart powerpoint ideas. This is a campaign budget plan pie chart powerpoint ideas. This is a seven stage process. The stages in this process are business, success, finance, strategy, management.
-
 Pie chart to showcase sales of different brand products powerpoint slide images
Presenting pie chart to showcase sales of different brand products powerpoint slide images. This is a pie chart to showcase sales of different brand products powerpoint slide images. This is a five stage process. The stages in this process are business, success, strategy, finance, presentation.
-
 Pie chart for media spend categories presentation portfolio
Presenting pie chart for media spend categories presentation portfolio. This is a pie chart for media spend categories presentation portfolio. This is a six stage process. The stages in this process are business, success, strategy, finance, circular.
-
 Pie chart for user behavior studies presentation slide
Presenting pie chart for user behavior studies presentation slide. This is a pie chart for user behavior studies presentation slide. This is a six stage process. The stages in this process are business, success, strategy, finance, circular.
-
 Pie chart with percentage analysis ppt template slide
Presenting pie chart with percentage analysis ppt template slide. This is a pie chart with percentage analysis ppt template slide. This is a six stage process. The stages in this process are pie chart, analysis, process, management, business.
-
 5 connected circular diagram for business strategy powerpoint layout
Presenting 5 connected circular diagram for business strategy powerpoint layout. This is a 5 connected circular diagram for business strategy powerpoint layout. This is a five stage process. The stages in this process are arrows, process, diagram, business, marketing, success.
-
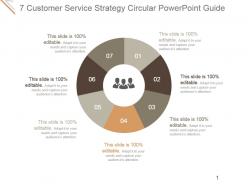 7 customer service strategy circular powerpoint guide
Presenting 7 customer service strategy circular powerpoint guide. This is a 7 customer service strategy circular powerpoint guide. This is a seven stage process. The stages in this process are circular, strategy, analysis, process, marketing.
-
 Budget allocation for different services pie chart example of ppt
Presenting budget allocation for different services pie chart example of ppt. This is a budget allocation for different services pie chart example of ppt. This is a seven stage process. The stages in this process are pie chart, finance, marketing, strategy, business, success, percentage.
-
 Pie chart for market research and analysis powerpoint ideas
Presenting pie chart for market research and analysis powerpoint ideas. This is a pie chart for market research and analysis powerpoint ideas. This is a seven stage process. The stages in this process are pie chart, percentage, analysis, marketing, strategy, business, success.
-
 Business growth comparison pie chart powerpoint topics
Presenting business growth comparison pie chart powerpoint topics. This is a business growth comparison pie chart powerpoint topics. This is a two stage process. The stages in this process are business, meter, measure, growth, comparison.
-
 Marketing analytics software comparison pie chart powerpoint images
Presenting marketing analytics software comparison pie chart powerpoint images. This is a marketing analytics software comparison pie chart powerpoint images. This is a three stage process. The stages in this process are marketing, analysis, measure, pie chart, comparison.
-
 Technology big data benefits pie chart ppt templates
Presenting technology big data benefits pie chart ppt templates. This is a technology big data benefits pie chart ppt templates. This is a four stage process. The stages in this process are increased efficiency, better business decision making, improved customer experience and engagement, achieved financial savings.
-
 Market analysis business plan ppt slide template
Presenting market analysis business plan ppt slide template. This is a market analysis business plan ppt slide template. This is a six stage process. The stages in this process are brand.
-
 Industry analysis framework pie chart powerpoint slide show
Presenting industry analysis framework pie chart powerpoint slide show. This is a industry analysis framework pie chart powerpoint slide show. This is a six stage process. The stages in this process are industry analysis framework pie chart,market analysis market share brand.
-
 Project cost feasibility study ppt example
Presenting project cost feasibility study ppt example. This is a project cost feasibility study ppt example. This is a two stage process. The stages in this process are project cost feasibility study,our cost.
-
 Project planning and feasibility study ppt example
Presenting project planning and feasibility study ppt example. This is a project planning and feasibility study ppt example. This is a three stage process. The stages in this process are technical feasibility, operational feasibility, economic feasibility, project analysis, scheduling requirement feasibility, legal requirement feasibility.
-
 Sources of product innovation ppt background images
Presenting sources of product innovation ppt background images. This is a sources of product innovation ppt background images. This is a six stage process. The stages in this process are market research, long range studies, market gap analysis, consumer activity analysis, learning from, competitors.
-
 Business model assessment powerpoint graphics
Presenting business model assessment powerpoint graphics. This is a business model assessment powerpoint graphics. This is a three stage process. The stages in this process are business model, assessment, financial, presentation.
-
 Spending plan pie chart ppt slide examples
Presenting spending plan pie chart ppt slide examples. This is a spending plan pie chart ppt slide examples. This is a twelve stage process. The stages in this process are spending plan, pie chart, presentation, process, icons.
-
 Circular chart to show business process ppt samples
Presenting circular chart to show business process ppt samples. This is a circular chart to show business process ppt samples. This is a five stage process. The stages in this process are business, marketing, strategy, process, icons.
-
 Magnifying glass for sales performance review powerpoint slide themes
Presenting magnifying glass for sales performance review powerpoint slide themes. This is a magnifying glass for sales performance review powerpoint slide themes. This is a four stage process. The stages in this process are magnifier glass, pie, finance, percentage, research.
-
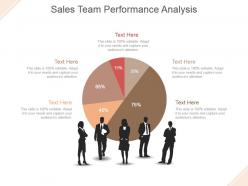 Sales team performance analysis powerpoint slide template
Presenting sales team performance analysis powerpoint slide template. This is a sales team performance analysis powerpoint slide template. This is a five stage process. The stages in this process are pie, finance, people, communication, percentage.
-
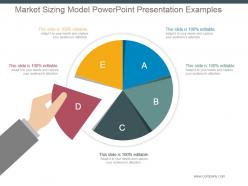 Market sizing model powerpoint presentation examples
Presenting market sizing model powerpoint presentation examples. This is a market sizing model powerpoint presentation examples. This is a five stage process. The stages in this process are pie, business, opportunity, hand, communication.
-
 Market size and segments ppt example professional
Presenting market size and segments ppt example professional. This is a market size and segments ppt example professional. This is a five stage process. The stages in this process are business, process, management, marketing, analysis.
-
 Employee satisfaction survey results pie chart powerpoint presentation examples
Presenting employee satisfaction survey results pie chart powerpoint presentation examples. This is a employee satisfaction survey results pie chart powerpoint presentation examples. This is a four stage process. The stages in this process are employee satisfaction with workforce, satisfaction by income level.
-
 Employees who leave within first 6 months powerpoint shapes
Presenting employees who leave within first 6 months powerpoint shapes. This is a employees who leave within first 6 months powerpoint shapes. This is a three stage process. The stages in this process are employees left job within the first 6 months, felt their boss was a jerk, work was different than they expected, changed their mind on work type.
-
 Managers training hours doughnut chart powerpoint slide
Presenting managers training hours doughnut chart powerpoint slide. This is a managers training hours doughnut chart powerpoint slide. This is a four stage process. The stages in this process are open positions by divisions, key metrics, total employees, employee churn.
-
 Types of employee training provided doughnut chart powerpoint slide clipart
Presenting types of employee training provided doughnut chart powerpoint slide clipart. This is a types of employee training provided doughnut chart powerpoint slide clipart. This is a four stage process. The stages in this process are in person, hybrid, on-line, hands on.
-
 Why people leave an organization pie chart powerpoint slide deck samples
Presenting why people leave an organization pie chart powerpoint slide deck samples. This is a why people leave an organization pie chart powerpoint slide deck samples. This is a six stage process. The stages in this process are management general work environment, unsatisfied with pay and benefits, lack of fit to job, lack of job security, lack of flexibility scheduling, limited career advancement promotional opportunities.
-
Excellent work done on template design and graphics.
-
Great quality product.
-
Thanks for all your great templates they have saved me lots of time and accelerate my presentations. Great product, keep them up!
-
Very well designed and informative templates.
-
Great designs, Easily Editable.
-
Great quality product.
-
Presentation Design is very nice, good work with the content as well.
-
Very unique and reliable designs.
-
Great quality product.
-
Great quality slides in rapid time.


