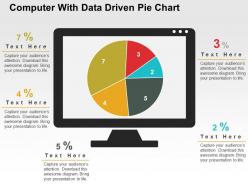
Computer with data driven pie chart powerpoint slides
Back your ideas with the power of facts and research on the market trends with a data driven PowerPoint slide that showcases the scope of returns from investment in different sectors, the market share of various products of your company and how it can be improved and multifarious other parameters within a pie chart projected on to a computer screen in a unique graphic. Financial allocation under various heads, manpower planning, components of product design and development and project execution within set timelines by allocating subtasks efficiently can be appealingly depicted within our exquisite PPT slide template along with related information that may be relevant to the audience. Capture the financial situation of all business units within the organization for the benefit of the management or shareholders or the spread of your business operations across services and manufacturing sectors through this innovative PowerPoint presentation slide and earn your place in the sun as a professional. Expect the best from our Computer With Data Driven Pie Chart Powerpoint Slides. They have a habit of being brilliant.
You must be logged in to download this presentation.
 Impress your
 audience
Editable
of Time
PowerPoint presentation slides
Easy and swift to download. Fully modifiable color scheme, contrast, size and orientation of PPT infographics. Insert text without any length constraints. No change in the high resolution of PPT images after editing. Easily convertible to JPG or PDF formats and runs smoothly with any software. Perfectly suited for software designers, app developers, product engineers etc.
People who downloaded this PowerPoint presentation also viewed the following :
Computer with data driven pie chart powerpoint slides with all 3 slides:
Book a good future with our Computer With Data Driven Pie Chart Powerpoint Slides. They are an assurance of great fortune.
-
Great quality slides in rapid time.
-
Graphics are very appealing to eyes.


