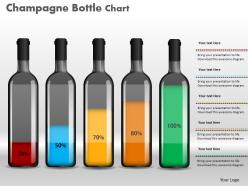
0414 champagne bottle column chart for data diaplay powerpoint graph
Are you a business man looking for PPT ideas for your champagne, beer or alcohol business? Do you want to compliment your business with beautifully crafted PPT examples slides that add beautiful, aesthetic effects and work like great Presentation visual aids for your marketing objectives? There are PPT slides available online but most of them are static and non-responsive, often leading to equally unenthusiastic response from the audience, which ultimately dampens the whole objective of presenting to them. Our website houses numerous professional sample PPT files for different subjects and purposes. Click, download and try our champagne bottle column chart for data display Presentation deck. This PPT summary can also be used as a generic slide for a congratulatory message to team mates, colleagues, co-owners or employees, displaying them profit figures for different years or for different product lines. The possibilities are endless with this efficient PowerPoint slide presentation sample. Employ this example of great PPT for peace of mind. Handle the hard with our 0414 Champagne Bottle Column Chart For Data Diaplay Powerpoint Graph. You will find the going easy.
You must be logged in to download this presentation.
 Impress your
 audience
Editable
of Time
PowerPoint presentation slides
Employ slides in numerous software smoothly and coherently. Trouble-free download and use of slide. Company logo, trademark or name can be appended for extra accuracy and specificity. PPT graphics never pixelate when projected on widescreen displays. PowerPoint Slides quite compatible with google slides. Insert more titles and sub titles without space constraints. High resolution PPT slides for clarity. Highly alterable layout including font, text, color and design.
People who downloaded this PowerPoint presentation also viewed the following :
0414 champagne bottle column chart for data diaplay powerpoint graph with all 3 slides:
Embark on your venture with confidence. Our 0414 Champagne Bottle Column Chart For Data Diaplay Powerpoint Graph will give you an auspicious start.
-
Use of icon with content is very relateable, informative and appealing.
-
Great designs, really helpful.


