Decline Concept PowerPoint Templates, Presentation Backgrounds and PPT Slides
- Sub Categories
-
 Home statistics dashboard diagram presentation background images
Presenting home statistics dashboard diagram presentation background images. This is a home statistics dashboard diagram presentation background images. This is a two stage process. The stages in this process are compare power, compare power.
-
 Changes in competitive environment sample of ppt presentation
Presenting changes in competitive environment sample of ppt presentation. Presenting changes in competitive environment sample of ppt presentation. Presenting changes in competitive environment sample of ppt presentation. This is a changes in competitive environment sample of ppt presentation. This is four stage process. The stages in this process are engagement, monthly, brand, weekly.
-
 Hiring plan powerpoint slide show
Presenting hiring plan powerpoint slide show. Presenting hiring plan powerpoint slide show. Presenting hiring plan powerpoint slide show. This is a hiring plan powerpoint slide show. This is five stage process. The stages in this process are finance, support, product, marketing, sales, engineering.
-
 Revenue by business line powerpoint slide designs download
Presenting revenue by business line powerpoint slide designs download. This is a revenue by business line powerpoint slide designs download. This is a four stage process. The stages in this process are business, management, marketing, revenue, growth.
-
 Acquisition cost per customer powerpoint presentation examples
Presenting acquisition cost per customer powerpoint presentation examples. This is a acquisition cost per customer powerpoint presentation examples. This is a three stage process. The stages in this process are rising, steady, falling.
-
 Acquisition cost per customer ppt icon
Presenting acquisition cost per customer ppt icon. This is a acquisition cost per customer ppt icon. This is a three stage process. The stages in this process are rising, steady, falling .
-
 Book value per share pat powerpoint presentation examples
Presenting book value per share pat powerpoint presentation examples. This is a book value per share pat powerpoint presentation examples. This is a one stage process. The stages in this process are gain, lost, total equity, total outstanding shares, book value per share.
-
 Pareto analysis powerpoint slide deck
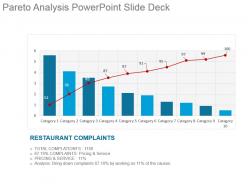
Presenting pareto analysis powerpoint slide deck. This is a pareto analysis powerpoint slide deck. This is a ten stage process. The stages in this process are restaurant complaints, total complaints, complaints pricing and service, pricing and service, analysis bring down complaints, category.
-
 Pareto chart powerpoint slide clipart
Presenting pareto chart powerpoint slide clipart. This is a pareto chart powerpoint slide clipart. This is a eight stage process. The stages in this process are category, reason.
-
 Statistical process control powerpoint slide designs
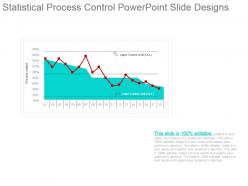
Presenting statistical process control powerpoint slide designs. This is a statistical process control powerpoint slide designs. This is a one stage process. The stages in this process are process output, upper control limit, lower control limit.
-
 Decline stage ppt templates
Presenting decline stage ppt templates. Presenting decline stage ppt templates. This is a decline stage ppt templates. This is a one stage process. The stages in this process are services sales, introduction, maturity, growth, decline, time.
-
 Decline stage powerpoint presentation
Presenting decline stage powerpoint presentation. This is a decline stage powerpoint presentation. This is a four stage process. The stages in this process are services sales, introduction, growth, maturity, decline, time, sale is declining so there are several option, maintain the product, possibly rejuvenating it by adding new features and finding new uses, reduce costs and continue the offer, discontinue the product.
-
 4 quarters track record ppt ideas
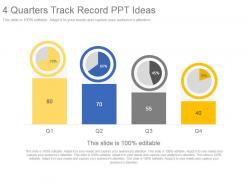
Presenting 4 quarters track record PPT template. Beneficial for the business managers, marketing professionals and the strategy designers. Access to convert the presentation design into JPG and PDF. Offer 100% access to change the size and style of the slides once downloaded and saved in the desired format. Choice to get presentation slide in standard or in widescreen view. Easy to convert in JPEG and PDF document. Compatible with Google slides. Easy and hassle-free downloading process.
-
 Chart variations to compare quarterly performance ppt icon
Presenting chart variations to compare quarterly performance ppt icon. This is a chart variations to compare quarterly performance ppt icon. This is a two stage process. The stages in this process are series.
-
 Tips for effective product launch sample ppt presentation
Presenting tips for effective product launch sample ppt presentation. This is a tips for effective product launch sample ppt presentation. This is a seven stage process. The stages in this process are ideation, business model, customer discovery, product design, launch, market planning, development.
-
 Global market trends line graph powerpoint slide
Presenting global market trends line graph powerpoint slide. This is a global market trends line graph powerpoint slide. This is a two stage process. The stages in this process are africa, middle east, latin america, eastern europe, north america, asia, western europe.
-
 Market size comparison line chart ppt slide
Presenting market size comparison line chart ppt slide. This is a market size comparison line chart ppt slide. This is a two stage process. The stages in this process are latin america, canada, japan, europe, asia pacific, us, rest of world.
-
 Product revenue comparison line graph ppt template
Presenting product revenue comparison line graph ppt template. This is a product revenue comparison line graph ppt template. This is a two stage process. The stages in this process are revenue, profit, competitor.
-
 New product launch seven stages ppt slide styles
Presenting new product launch seven stages ppt slide styles. Presenting new product launch seven stages ppt slide styles. This is a new product launch seven stages ppt slide styles. This is seven stage process. The stages in this process are ideation, business model, customer discovery, product design, launch, market planning, development.
-
 Graphical presentation of control chart ppt sample
Presenting graphical presentation of control chart ppt sample. This is a graphical presentation of control chart ppt sample. This is a three stage process. The stages in this process are upper limit, centerline, plotted points, lower limit, plot scale.
-
 Identifying market trends current number powerpoint slide clipart
Presenting identifying market trends current number powerpoint slide clipart. This is a identifying market trends current number powerpoint slide clipart. This is a seven stage process. The stages in this process are latin america, canada, japan, europe, asia pacific, us, rest of the world.
-
 Real estate prices projected appreciation ppt examples slides
Presenting real estate prices projected appreciation ppt examples slides. This is a real estate prices projected appreciation ppt examples slides. This is a four stage process. The stages in this process are business, marketing, price, management, decline.
-
 Market growth and development bar graph ppt images
Presenting market growth and development bar graph ppt images. This is a market growth and development bar graph ppt images. This is a four stage process. The stages in this process are category, series.
-
 Crowdfunding money raised by region powerpoint layout
Presenting crowdfunding money raised by region powerpoint layout. This is a crowdfunding money raised by region powerpoint layout. This is a six stage process. The stages in this process are business, marketing, bar graph, presentation, management.
-
 Service launch detailed plan checklist ppt design
Presenting service launch detailed plan checklist ppt design. This is a service launch detailed plan checklist ppt design. This is a seven stage process. The stages in this process are service launch, product launch, product rollout plan, roll out strategy, marketing plan, service launch plan.
-
 Marketing plan implementation timeline powerpoint templates
Presenting marketing plan implementation timeline powerpoint templates. This is a marketing plan implementation timeline powerpoint templates. This is a nine stage process. The stages in this process are implementation timeline, timeline, roadmap.
-
 Linear regression analytics ppt model
Presenting linear regression analytics PPT model presentation slide. The linear chart design template is 100% compatible with Google Slides and can also edit it in PowerPoint. You may insert your company's name and logo. Slide's quality remains same, even after doing modification in it, for example, edit color, font size, font type, and insert text as per requirement. The line chart design template is suitable for describing regression analysis. You can download this template easily. The slide is compatible with other formats such as JPEG and PDF.
-
 Trend line excel powerpoint graphics
Presenting trend line excel powerpoint graphics. This is a trend line excel powerpoint graphics. This is a five stage process. The stages in this process are trend line, line graph, scatter chart.
-
 3 percentage increase over time powerpoint slide show
Presenting, our 3 Percentage increase over time PowerPoint slide show. This is a fully editable PPT slide enabling you to customize your display with colors, text, fonts, photos, outcomes, and backgrounds of your selection. Personalize the layout by including your company data and business logo/trademark. We have created a sharp graphics format which does not deteriorate in quality when edited or pitched to a widescreen. These percentage icons PPT be used in 4:3 standard and full-screen version 16:9. Instantly download this design to make adjustments and export to pdf, jpg, and other formats as required.
-
 4 percentage increase over time powerpoint slides design
Presenting, percentage increase over time PowerPoint slides design. Use this layout for business performance processes and quickly convert into pdf or jpg formats and design on wide screens without pixelation. Substitute them icons with our countless options accessible online. Icons shown here can be resized and altered. Easily included your company data just by following a few steps. This PPT layout supports Google sides and is available and do not deteriorate when pitched on widescreens. Include this percentage increase layout in your meetings and use it in both standard 4:3 and widescreen format 16:9 after downloading.
-
 5 percentage increase over time powerpoint slides templates
Sharing 5 percentage increases over time PowerPoint slides templates. Easy to download and can be changed into JPG and PDF format. Fully editable presentation visual as color, text and font can be amended. PPT graphic can be shared in both standard and widescreen display. Similar designs are accessible with different nodes and stages. Ready to share PPT slide is well familiar with Google Slides and can be merged. Choice customizes the design with business name and logo.
-
 6 percentage increase over time ppt background
SlideTeam feels very happy in presenting to all of you this totally adjustable 6 percentage increase over time PPT background. This slideshow is 100% editable and user-friendly in nature thereby allowing you to edit the font color, font size and font style of the text used. The business template can be viewed in widescreen display ratio of 16:9 or standard size display ratio of 4:3 after being downloaded. The slides are also compatible with Google Slides, which makes it very easy to deal with.
-
 Communication plan strategy timeline ppt slide
Presenting communication plan strategy timeline PPT slide. This slide offers you plenty of space to place titles and subtitles. High resolution based presentation layout, does not change the image even after resizing. This presentation icon is fully compatible with Google Slides. This slideshow offers quick downloading speed and simple editing options in color text and fonts. This template can easily be changed into JPEG and PDF applications. This presentation layout has been designed for entrepreneurs, corporate and business managers.
-
 Critical success factors example ppt examples
Presenting critical success factors example PPT examples. PPT allows full editing. Modify the design as per your customized business needs. Change the design layout, structure by editing font type, color, size, shape, style, background etc. PPT can be opened with Google Slides and PowerPoint. You can view the design on normal and wide screen view. Instant and swift downloading available. Download the design into JPEG and PDF formats.
-
 Market maturity powerpoint ideas
Presenting Market Maturity PowerPoint Ideas. It is a professionally designed PowerPoint template with relevant visuals and content. You can change the color, text and font size as per your need. You can add or delete the content wherever required. This slide is available in both standard and widescreen size. Its compatibility with Google Slides makes it easily available. Convert and save this PPT slide in both PDF and JPG format.
-
 Bull market bar graph powerpoint templates
Presenting Bull Market Bar Graph PowerPoint Templates. Made up of high-resolution graphics. Easy to download and can be saved in a variety of formats. Access to open on a widescreen preview. Compatible with the Google Slides and PowerPoint software. Edit the style, size, and the background of the slide icons as per your needs. Useful for business owners and managers. It can be viewed on a standard screen and widescreen without any fear of pixelation.
-
 Market forecast graph powerpoint presentation
Presenting this slide named Market Forecast Graph PowerPoint presentation. Change the color, style, and font size. You can also modify the content as per your need and save it in PDF or JPG formats. You can make your business presentation impactful by adding high-quality graphs, charts, and diagrams provided in the slide. This PPT slide is Google Slides compatible and can be fetched anywhere. Get easy access to this well crafted PPT slide which can be availed in both standards as well as widescreen size.
-
 Market forecast reports powerpoint slide clipart
Presenting Market Forecast Reports PowerPoint Slide Clipart. A readymade, completely editable slide is easy to use. Add the desired content anywhere in the slide. This PPT slide is available in both full and standard screen sizes. Customize the font style, font color, and font size according to the requirement. The template is compatible with Google Slides. You can convert and save the slide in PDF and JPG formats. Can also be projected on widescreen without any fear of pixelation.
-
 Drill down value diagram powerpoint slide ideas
Presenting Drill Down Value Diagram Powerpoint Slide Ideas. The template can be downloaded quickly. Our templates are 100% editable. The colors, texts, fonts, images can be altered according to the theme of the organization. You can easily save the PPT in any format like PDF, JPG and PNG. It is Google Slides friendly. It is available in both the slide design sizes- 4:3 and 16:9.
-
 Economic order quantity eoq model powerpoint presentation
Presenting Economic Order Quantity EOQ Model PowerPoint Presentation. This presentation diagram is professionally designed and is completely editable in PowerPoint. You can alter the font type, font size, colors of the diagram, and background color as per your requirement. The slide is fully compatible with Google Slides and can be saved in multiple image formats such as JPG, PNG or document formats such as PDF without any hassle. Moreover, standard and widescreen ratios are supported.
-
 Bilevel optimization sample of ppt presentation
Presenting Bilevel Optimization Sample Of PPT Presentation. The slide has been professionally designed. You can include impressive and editable data visualization tools such as charts, graphs, and tables to the template. It is having compatibility with Google Slides. Save this into multiple images or document formats such as JPEG, PNG or PDF within seconds. High-quality graphics will ensure that distortion does not occur.
-
 Demand forecasting presentation visuals
Presenting Demand Forecasting Presentation Visuals which is designed by our professionals for your convenience. Save your presentation into formats like PDF, PNG, and JPG. The slide is readily available in both 4:3 and 16:9 aspect ratio. The template is compatible with Google Slides, which makes it easily accessible. You can also customize the color, fonts, font size, and font types of the template as per the requirement.
-
 Demand forecasting powerpoint images
Presenting Demand Forecasting PowerPoint Images template. The layout is 100% customizable in PowerPoint and other related office suites. You are free to alter the font type, size, and slide colors and other attributes. The layout is also compatible with Google Slides and can be saved in common image or document formats such as JPG or PDF. High-quality graphics and icons ensure that picture quality remains the same even when the user enlarges their size.
-
 Area chart ppt icon
Presenting Area Chart PPT Icon template. The slide is extremely easy to download and can be saved in the popular image or document formats such as JPEG and PDF. The slideshow supports both the standard and widescreen sizes. It is having compatibility with Google Slides and other office suites. Alter the style, size, and the background of the slides. High-quality graphics ensure that pixelation does not occur.
-
 Combo chart presentation portfolio
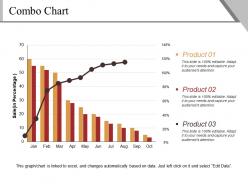
Presenting combo chart presentation portfolio. This is a combo chart presentation portfolio. This is a ten stage process. The stages in this process are business, marketing, product, sales in percentage, percentage.
-
 Competitor positioning presentation slides
Presenting competitor positioning presentation slides. This is a competitor positioning presentation slides. This is a two stage process. The stages in this process are competitor, own company, company growth, graph, donut.
-
 Area chart ppt design
Presenting area chart ppt design. This is a area chart ppt design. This is a two stage process. The stages in this process are product, in years, in percentage, percentage, finance.
-
 Pareto chart powerpoint slide images
Presenting pareto chart powerpoint slide images. This is a pareto chart powerpoint slide images. This is a seven stage process. The stages in this process are number of defects, observation, graph, finance, business.
-
 Quality control chart powerpoint topics
Presenting quality control chart powerpoint topics. This is a quality control chart powerpoint topics. This is a two stage process. The stages in this process are anatomy of control chart, upper control limit, defect rate, unstable trend, process change, lower control limit.
-
 Area chart good ppt example template 2
Presenting area chart good ppt example template 2. This is a area chart good ppt example template 2. This is a two stage process. The stages in this process are product, sales in percentage, financial year, business, finance.
-
 Combo chart powerpoint slide information
Presenting combo chart powerpoint slide information. This is a combo chart powerpoint slide information. This is a ten stage process. The stages in this process are bar, finance, business, marketing, strategy.
-
 Cash forecast in banking funds transactions outstanding checks
Presenting cash forecast in banking funds transactions outstanding checks. This is a cash forecast in banking funds transactions outstanding checks. This is a five stage process. The stages in this process are cash forecast, cash flow, money forecast, fund forecast.
-
 Stock chart powerpoint slide images
Presenting stock chart powerpoint slide images. This is a stock chart powerpoint slide images. This is a five stage process. The stages in this process are high, volume, low, open, close, product.
-
 Stacked line chart ppt design templates template 1
Presenting stacked line chart ppt design templates template 1. This is a stacked line chart ppt design templates template 1. This is a two stage process. The stages in this process are product, profit, line chart, year, growth.
-
 Assessment icon showcasing bar graph
Presenting assessment icon showcasing bar graph. This is a assessment icon showcasing bar graph. This is a three stage process. The stages in this process are feedback loop icon, evaluation icon, assessment icon.
-
 Rogers technology adoption curve presentation portfolio
Presenting rogers technology adoption curve presentation portfolio. This is a rogers technology adoption curve presentation portfolio. This is a five stage process. The stages in this process are innovators, early adopters, early majority, late majority, laggards.
-
 Stacked column presentation pictures
Presenting stacked column presentation pictures. This is a stacked column presentation pictures. This is a nine stage process. The stages in this process are business, marketing, strategy, bar, graph.
-
 Roger s technology adoption curve powerpoint slide background designs
Presenting roger s technology adoption curve powerpoint slide background designs. This is a roger s technology adoption curve powerpoint slide background designs. This is a five stage process. The stages in this process are innovators, early adopters, early majority, late majority, laggards.
-
 Define role of leadership in cm ppt background designs
Presenting define role of leadership in cm ppt background designs. This is a define role of leadership in cm ppt background designs. This is a five stage process. The stages in this process are vision, energizing people, communication, charisma, competence.
-
 Business priorities growth corporate levels
Presenting business priorities growth corporate levels. This is a business priorities growth corporate levels. This is a five stage process. The stages in this process are business priorities, business goals, business objectives.
-
Visually stunning presentation, love the content.
-
Excellent design and quick turnaround.
-
Attractive design and informative presentation.
-
Unique design & color.
-
Attractive design and informative presentation.
-
Commendable slides with attractive designs. Extremely pleased with the fact that they are easy to modify. Great work!
-
Excellent design and quick turnaround.
-
The content is very helpful from business point of view.
-
Informative design.
-
Very unique, user-friendly presentation interface.


