Business Swot Analysis Product Comparison And Competitive Landscape Powerpoint Presentation Slides
If you are looking for a new way of presenting organizational strategies, our content ready pre-designed business swot analysis product comparison and competitive landscape PowerPoint presentation slides are perfect for you. This strategic management PowerPoint template includes slides on company overview, elevator pitch, our team, problems and solutions, value proposition product / service, product roadmap, milestones achieved, traction, business model, revenue streams, expense model, growth strategy, go-to-market strategy, competitive landscape, product comparison, SWOT analysis, financial projections, break-even analysis, financing, shareholding pattern, exit strategy etc. Our professionally designed business strategy PPT graphics are widely used for topics such as SWOT analysis with portfolio analysis, competitive marketing analysis, competitive positioning, positional analysis, competitive advantage, competitive analysis tools, competitor SWOT analysis, strategic planning techniques, situation analysis, market analysis, strategic fit, corporate planning etc. Competitive intelligence PowerPoint slide can be used to present how to identify barriers and limit goals. Download our strategic market plan PowerPoint template to enhance the credibility of interpretation. Our Business Swot Analysis Product Comparison And Competitive Landscape Powerpoint Presentation Slides ensure a fair game. They adhere to accepted ethics.
You must be logged in to download this presentation.
 Impress your
 audience
Editable
of Time
PowerPoint presentation slides
Presenting Business Swot Analysis Product Comparison And Competitive Landscape Powerpoint Presentation Slides. The presentation comprises a set of 60 PowerPoint slides. The deck is fully editable in PowerPoint. Edit the font size, font type, text and color as per your requirements. The PPT gets downloaded in both widescreen (16:9) and standard (4:3) screen aspect ratio. Includes visually appealing images, charts, layouts, and icons. Compatible with Google Slides, PDF and JPG formats.
People who downloaded this PowerPoint presentation also viewed the following :
Content of this Powerpoint Presentation
Slide 1: This slide introduces Business SWOT Analysis, Product Comparison and Competitive Landscape. State Your company name and get started.
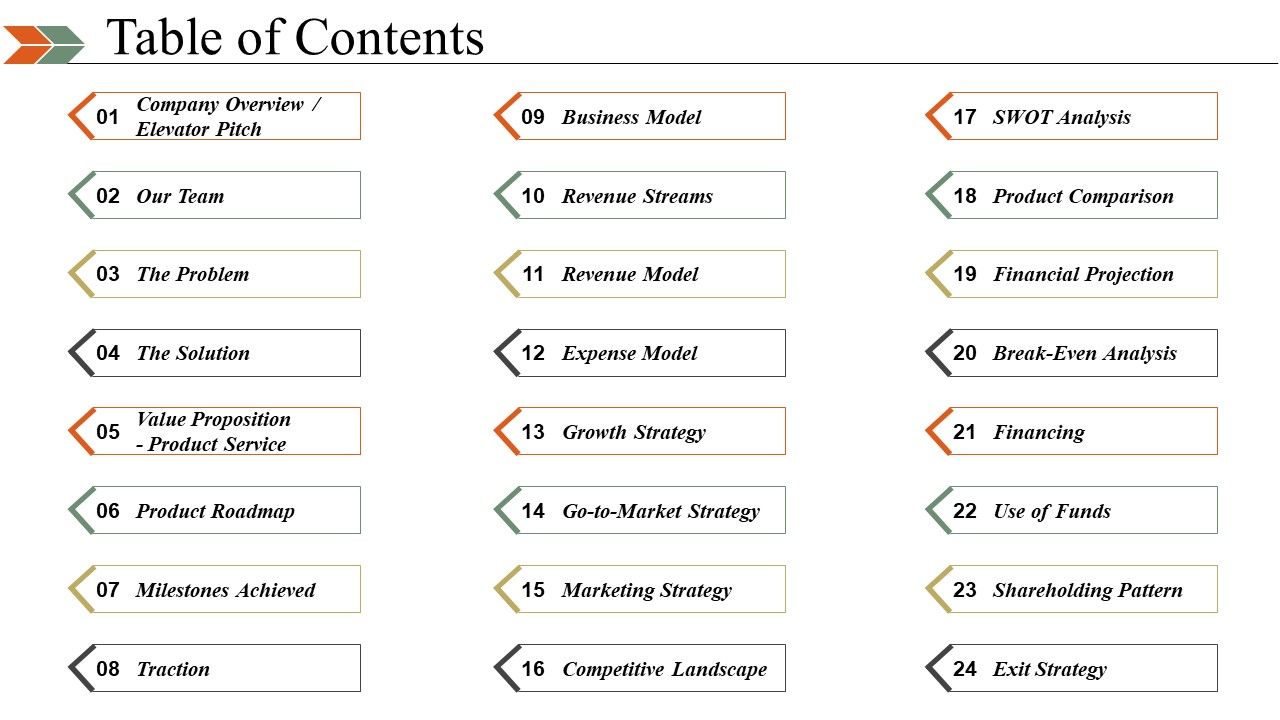
Slide 2: This slide shows Table of Contents with the following points- Company Overview / Elevator Pitch, Business Model, SWOT Analysis, Our Team, Revenue Streams, Product Comparison, The Problem, Revenue Model, Financial Projection, The Solution, Expense Model, Break-Even Analysis, Value Proposition - Product Service, Growth Strategy, Financing, Product Roadmap, Go-to-Market Strategy, Use of Funds, Milestones Achieved, Marketing Strategy, Shareholding Pattern, Traction, Competitive Landscape, Exit Strategy.
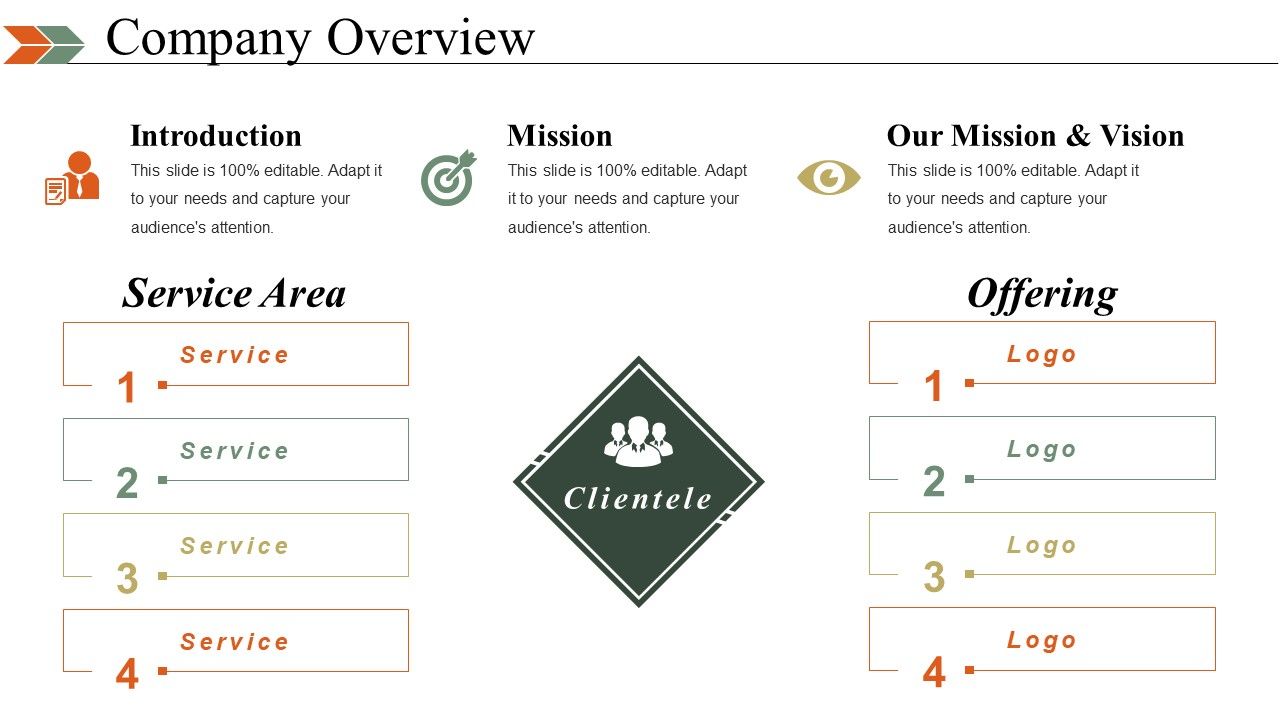
Slide 3: This slide showcases Company Overview showing- Clientele, Service, Service Area, Logo, Offering, Introduction, Our Mission & Vision.
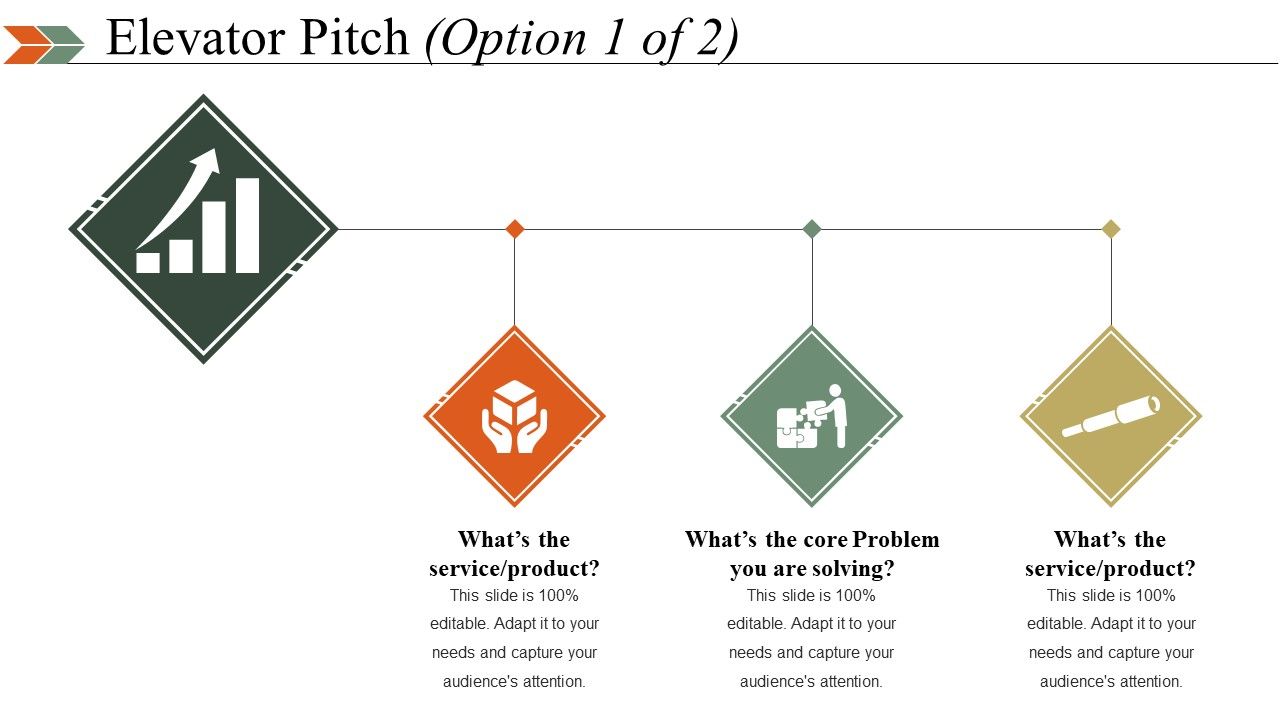
Slide 4: This slide shows Elevator Pitch presenting- What’s the service/product? What’s the core Problem you are solving? What’s the service/product?
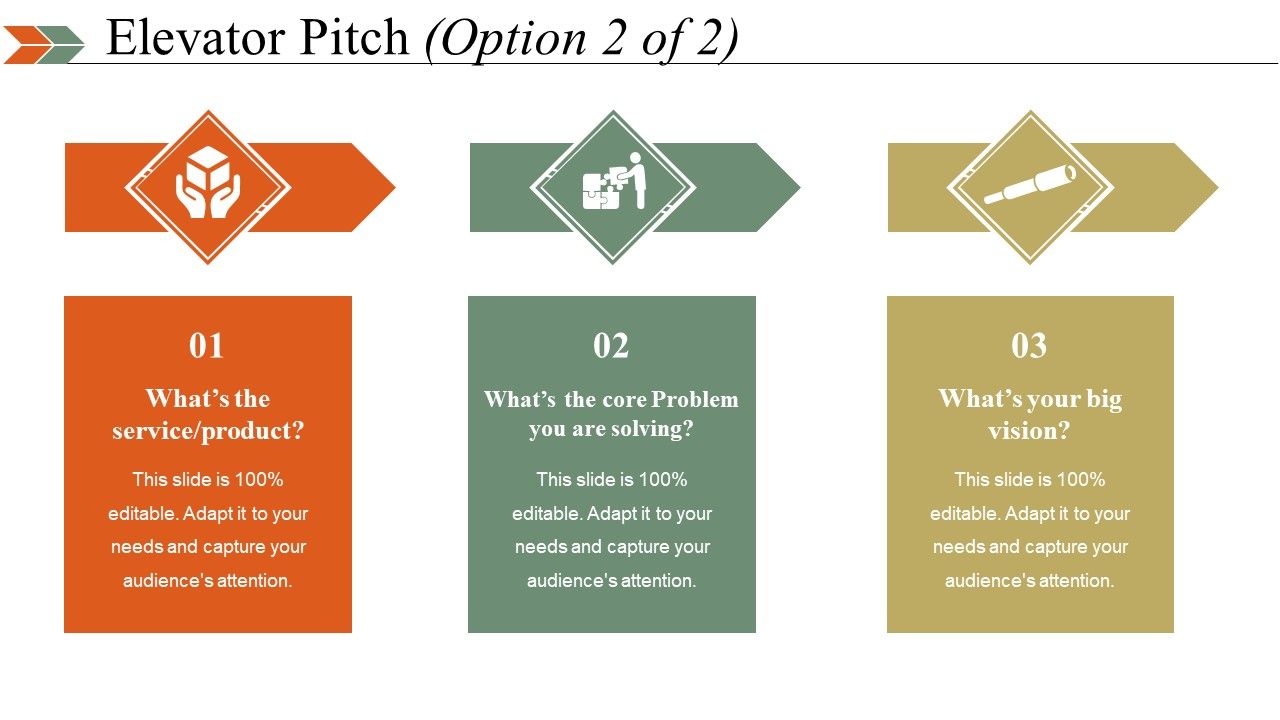
Slide 5: This slide shows Elevator Pitch presenting- What’s the service/product? What’s the core Problem you are solving? What’s your big vision?
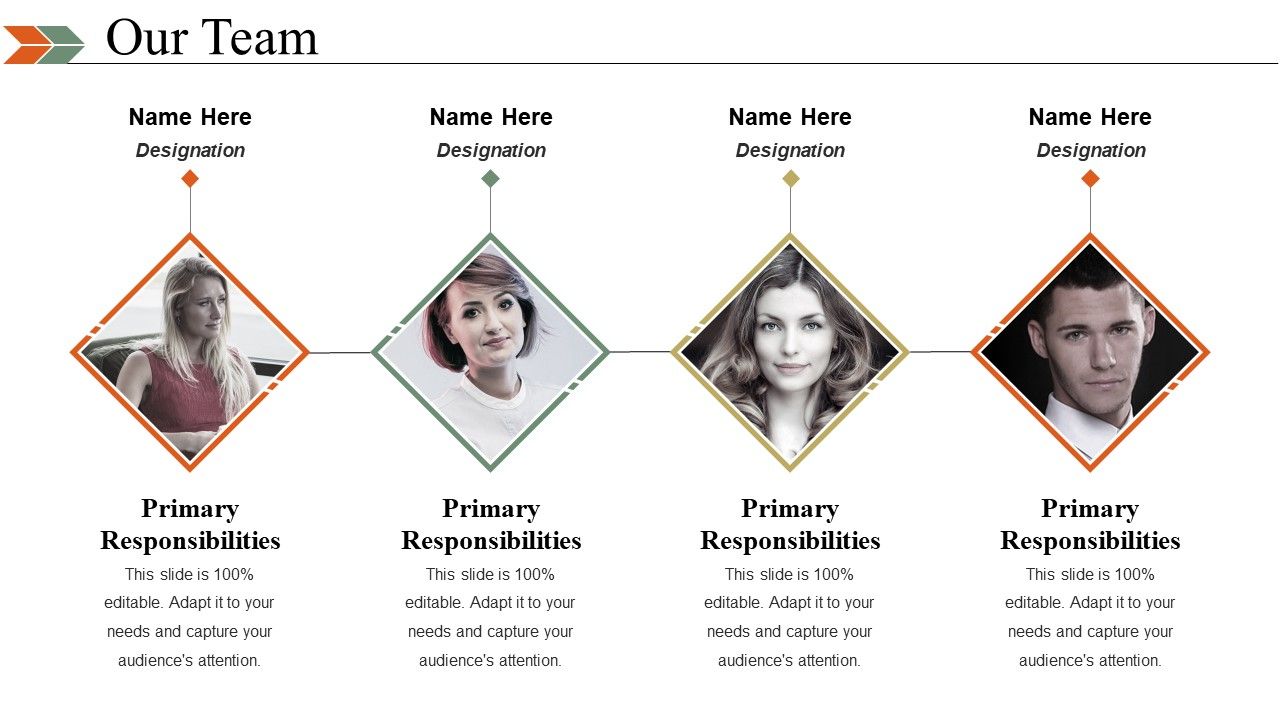
Slide 6: This is Our Team with Primary Responsibilities slide to state team specifications, roles, information, structure etc
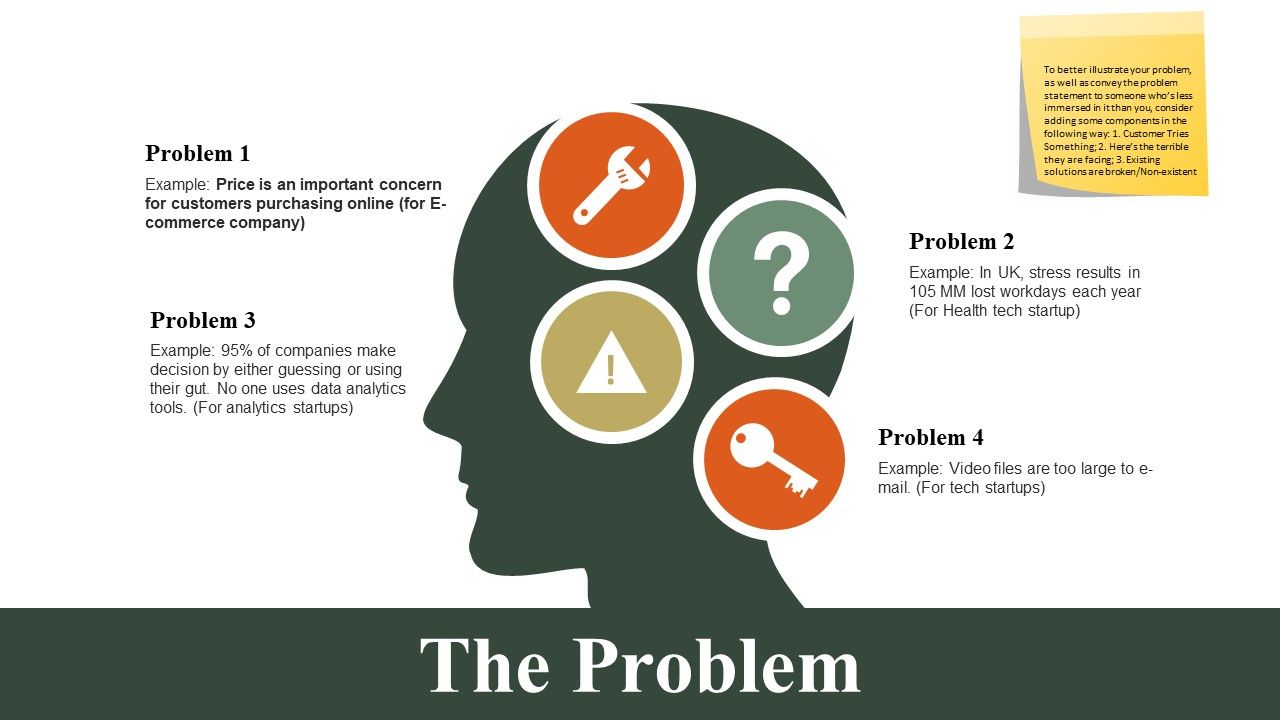
Slide 7: This slide presents The Problem with a creative imagery. To better illustrate your problem, as well as convey the problem statement to someone who’s less immersed in it than you, consider adding some components in the following way: 1. Customer Tries Something; 2. Here’s the terrible they are facing; 3. Existing solutions are broken/Non-existent
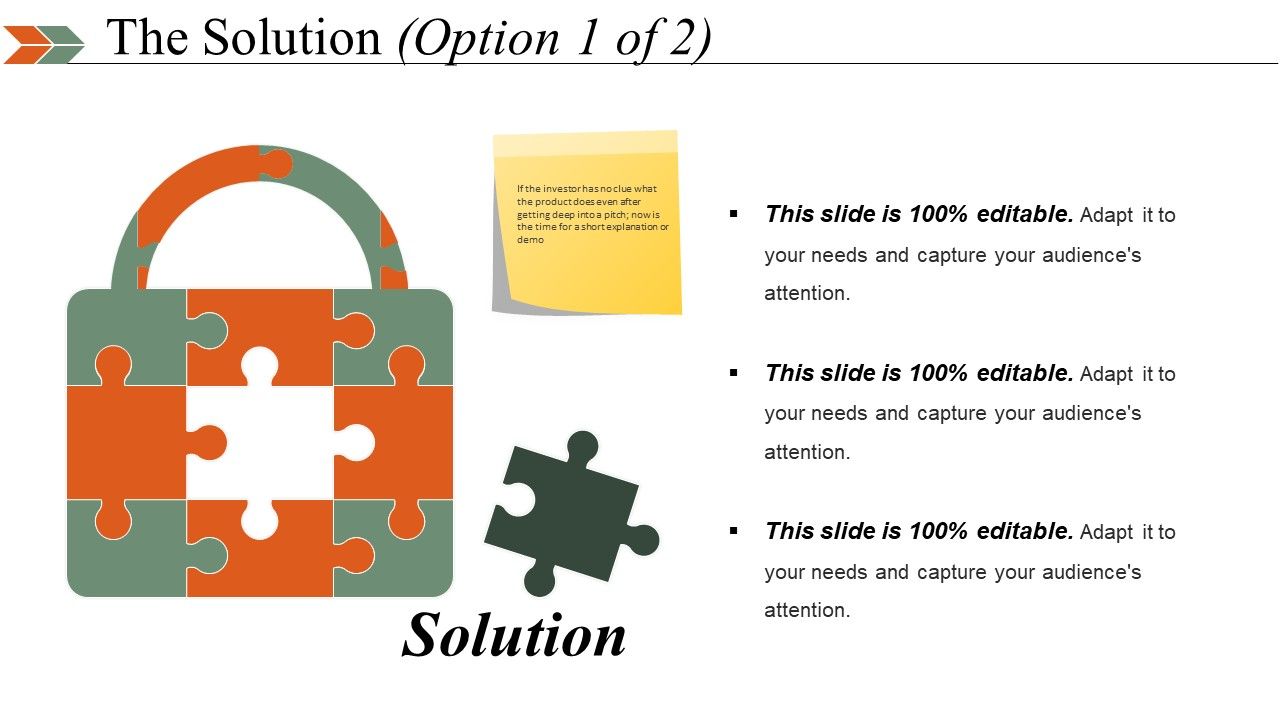
Slide 8: This slide presents The Problem with a creative lock imagery. If the investor has no clue what the product does even after getting deep into a pitch; now is the time for a short explanation or demo.
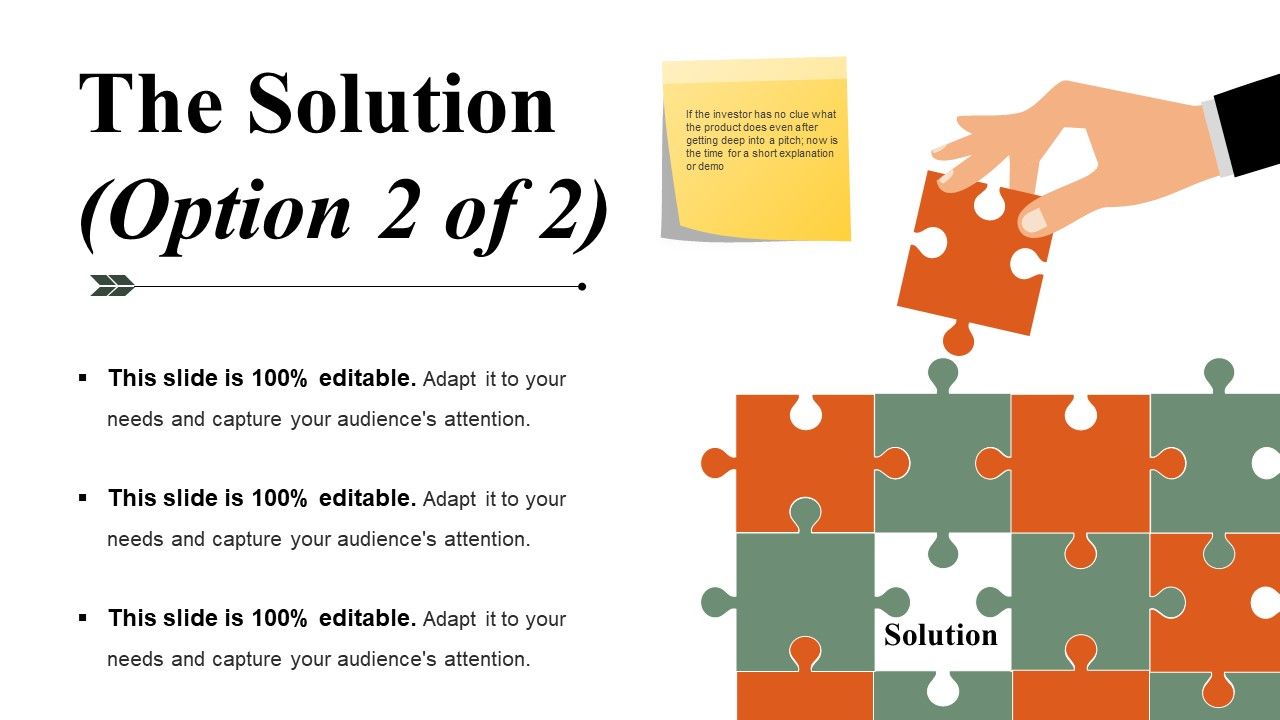
Slide 9: This slide presents The Problem with a creative puzzle imagery. State problem aspects here.
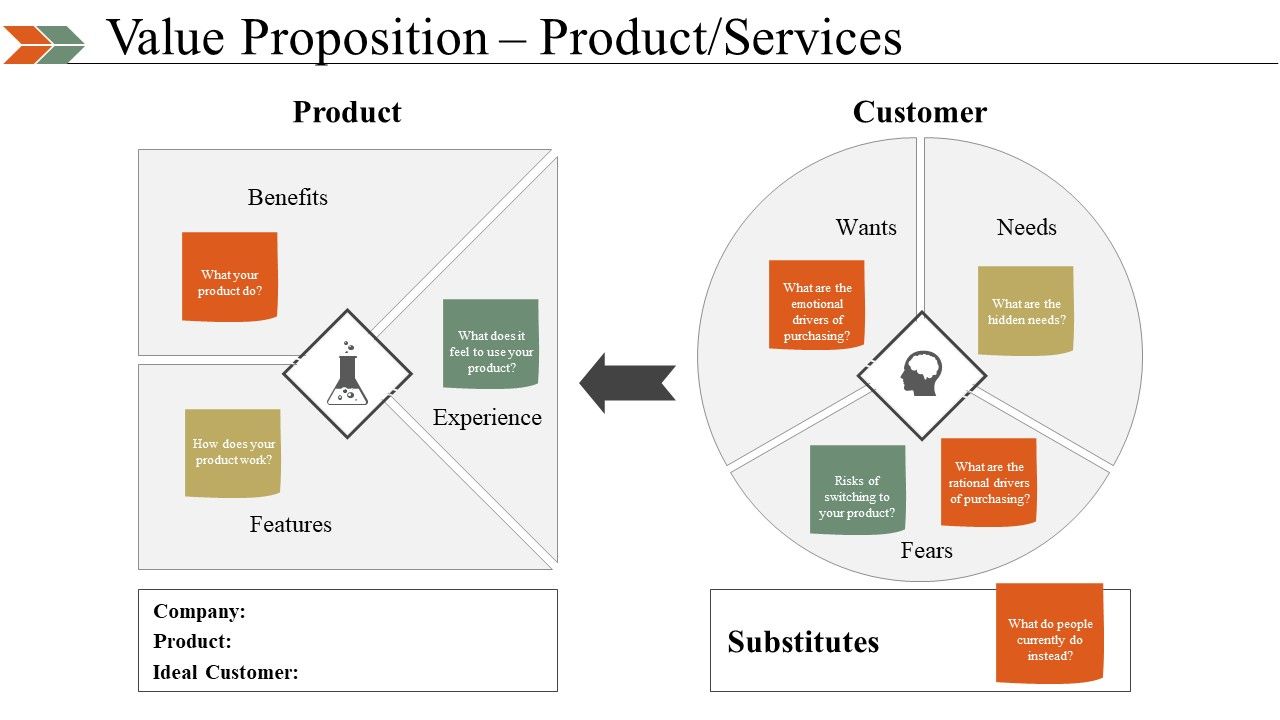
Slide 10: This slide shows Value Proposition – Product/Services in terms of- Product and Customer.
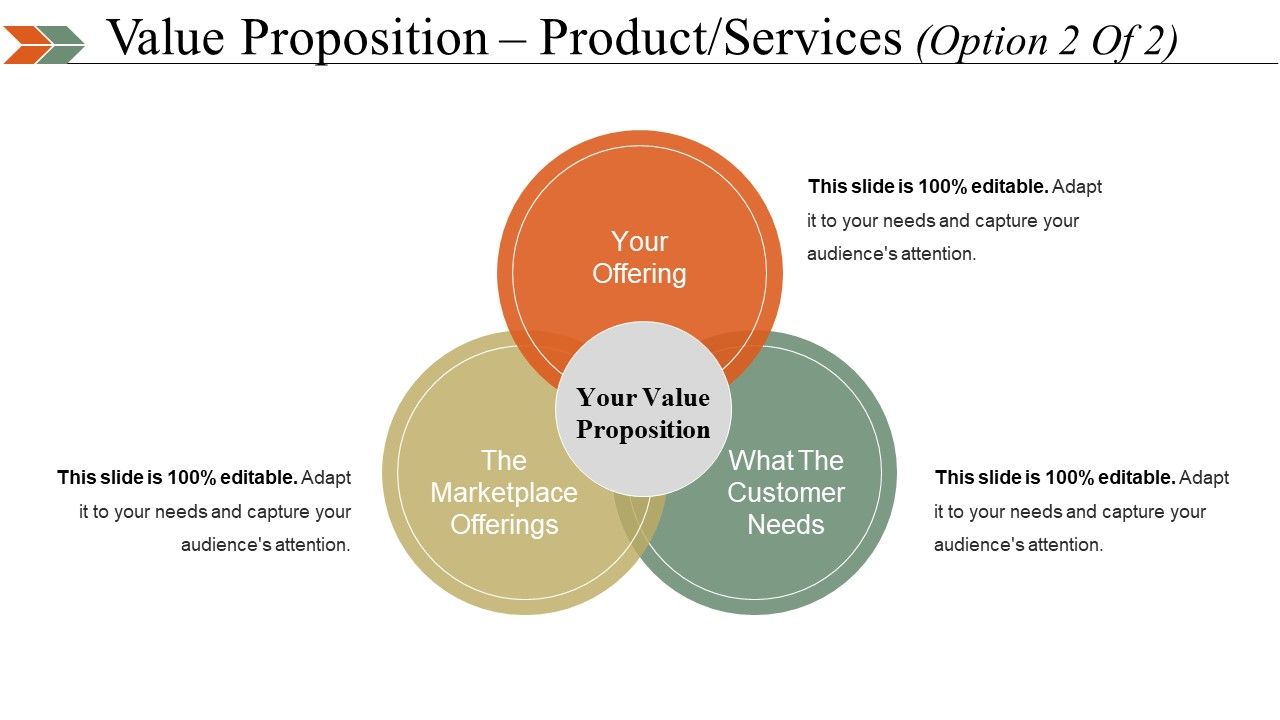
Slide 11: This slide shows Value Proposition – Product/Services in terms of- Your Offering, What The Customer Needs, The Marketplace Offerings.
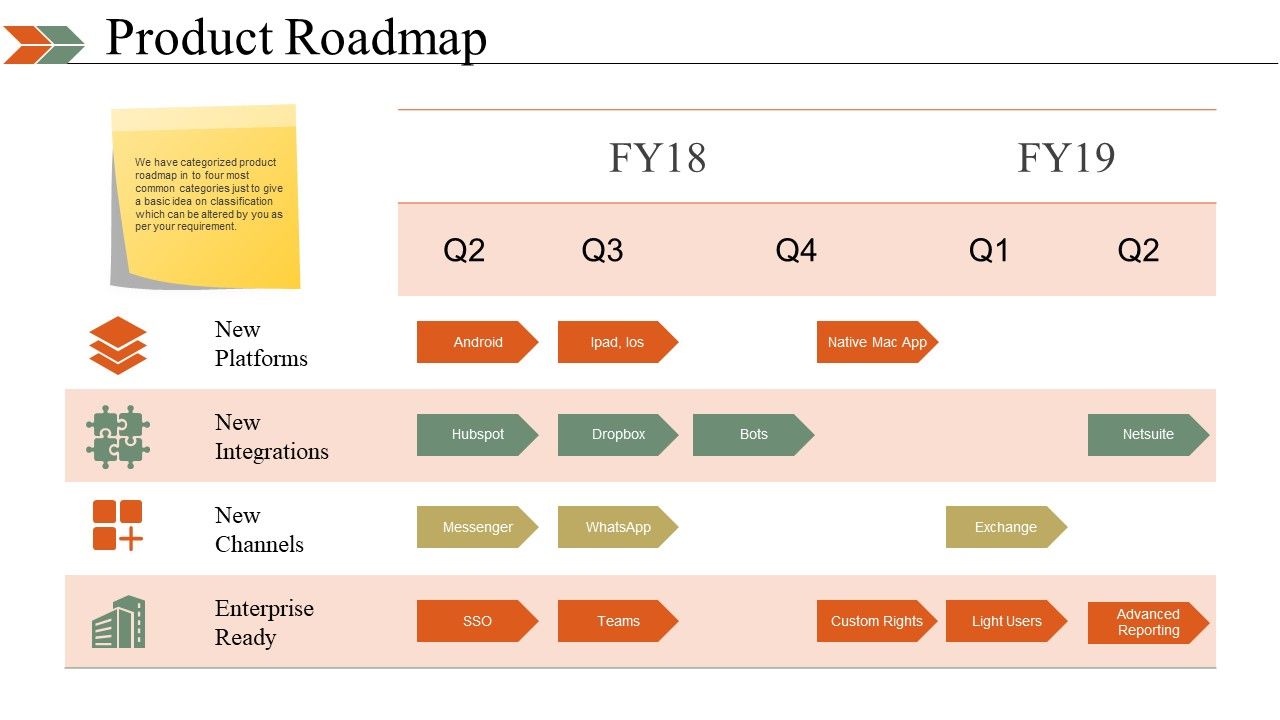
Slide 12: This slide presents a Product Roadmap showing- New Platforms, New Integrations, New Channels, Enterprise Ready. We have categorized product roadmap in to four most common categories just to give a basic idea on classification which can be altered by you as per your requirement.
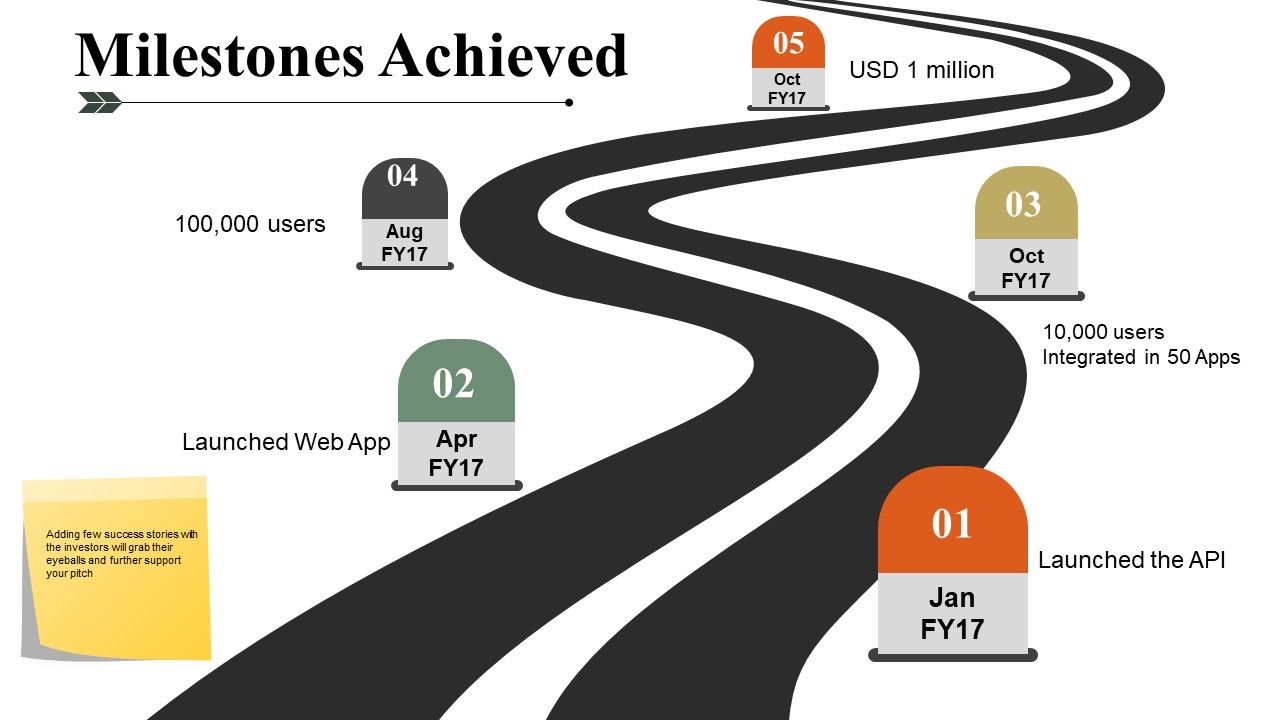
Slide 13: This slide showcases Milestones Achieved. Adding few success stories with the investors will grab their eyeballs and further support your pitch.
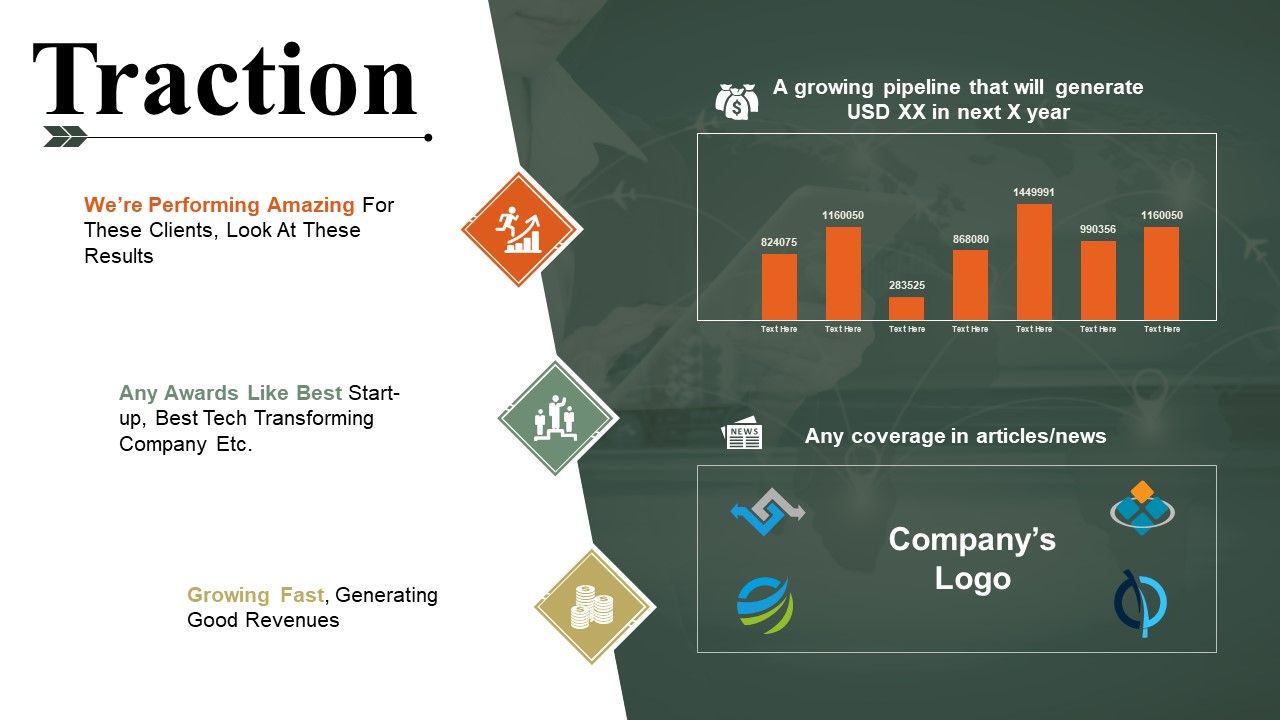
Slide 14: This slide shows Traction consisting of- A growing pipeline that will generate USD XX in next X year, Any coverage in articles/news, We’re Performing Amazing For These Clients, Look At These Results, Any Awards Like Best Start-up, Best Tech Transforming Company Etc. Growing Fast, Generating Good Revenues.
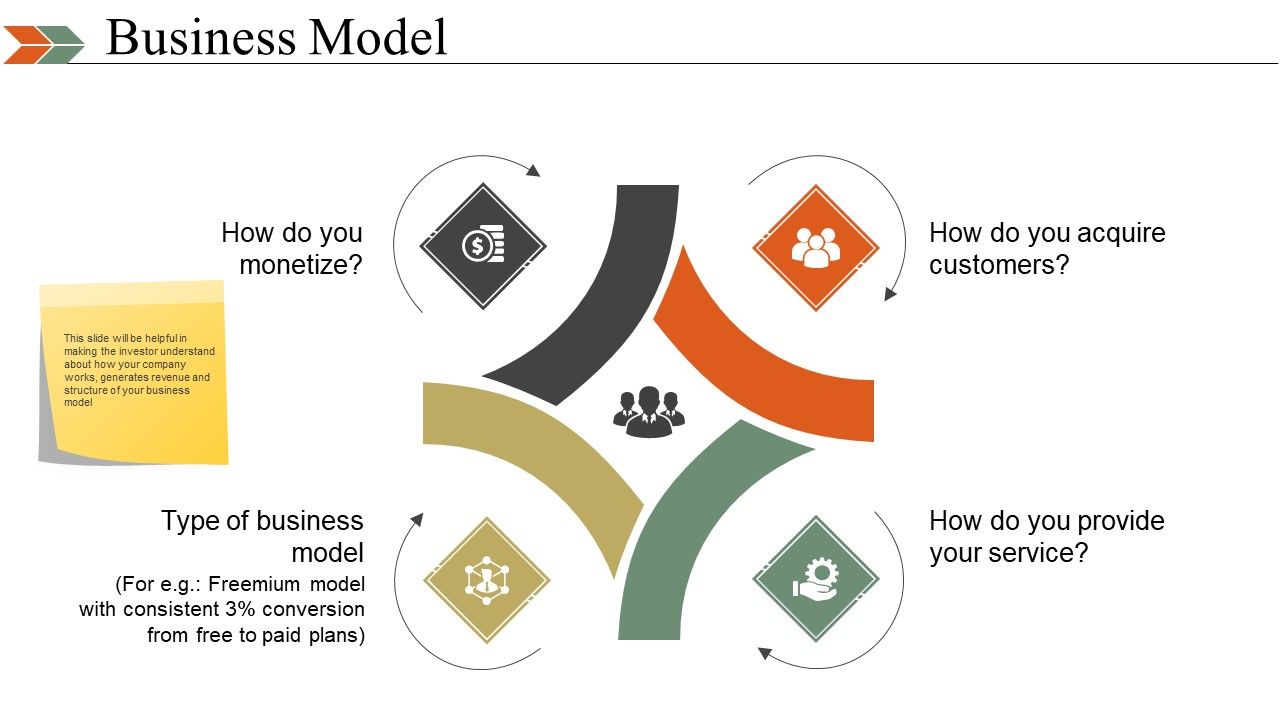
Slide 15: This slide presents the Business Model showcasing- How do you acquire customers? How do you monetize? How do you provide your service? Type of business model This slide will be helpful in making the investor understand about how your company works, generates revenue and structure of your business model.
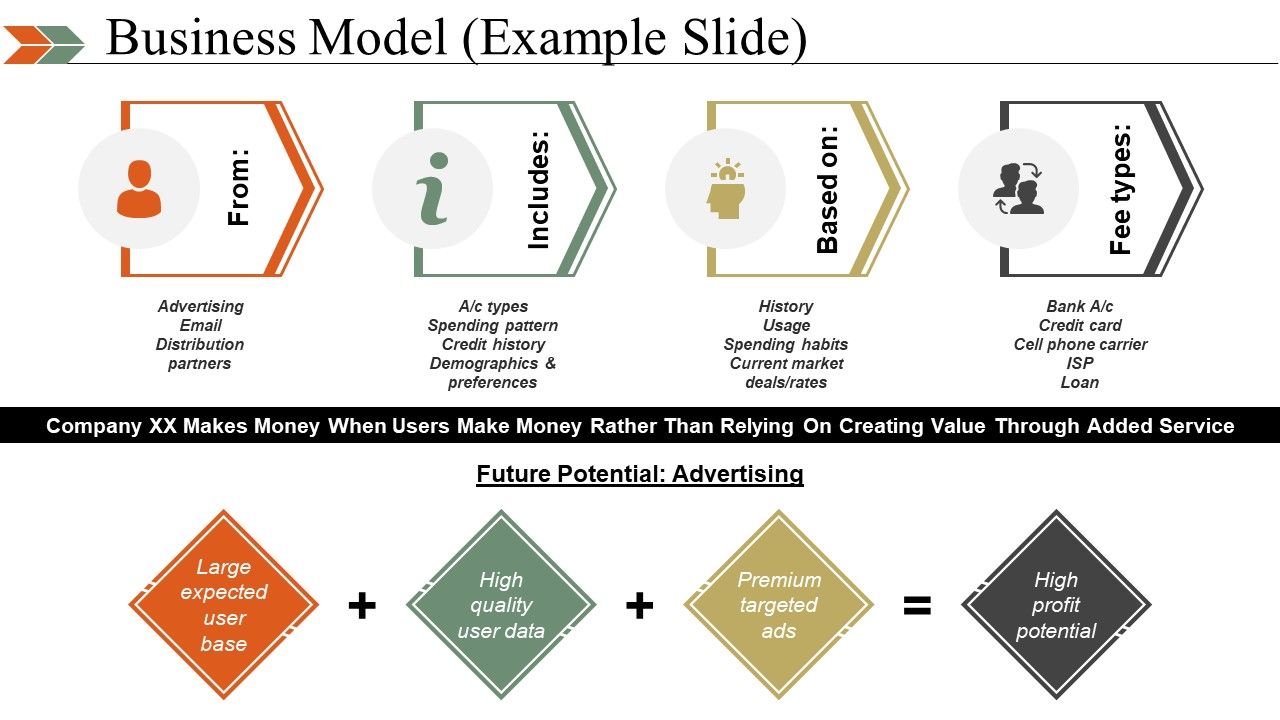
Slide 16: This slide also presents the Business Model showcasing- From: Advertising, Email, Distribution partners. Includes: A/c types, Spending pattern, Credit history, Demographics & preferences. Based on: History, Usage, Spending habits, Current market deals/rates. Fee types: Bank A/c, Credit card, Cell phone carrier, ISP, Loan, Company XX Makes Money When Users Make Money Rather Than Relying On Creating Value Through Added Service, Large expected user base, High quality user data, Premium targeted ads, High profit potential. Future Potential: Advertising.
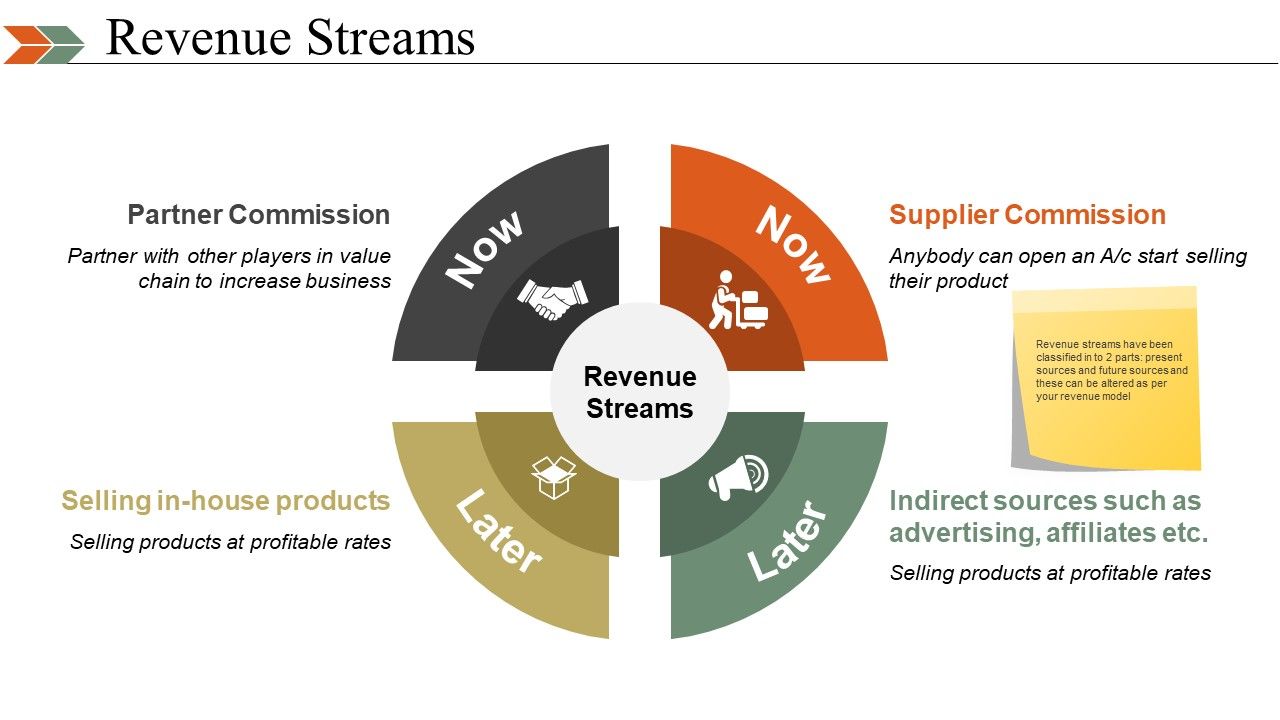
Slide 17: This slide displays Revenue Streams namely- Supplier Commission Indirect sources such as advertising, affiliates etc. Selling products at profitable rates Partner Commission Revenue streams have been classified in to 2 parts: present sources and future sources and these can be altered as per your revenue model.
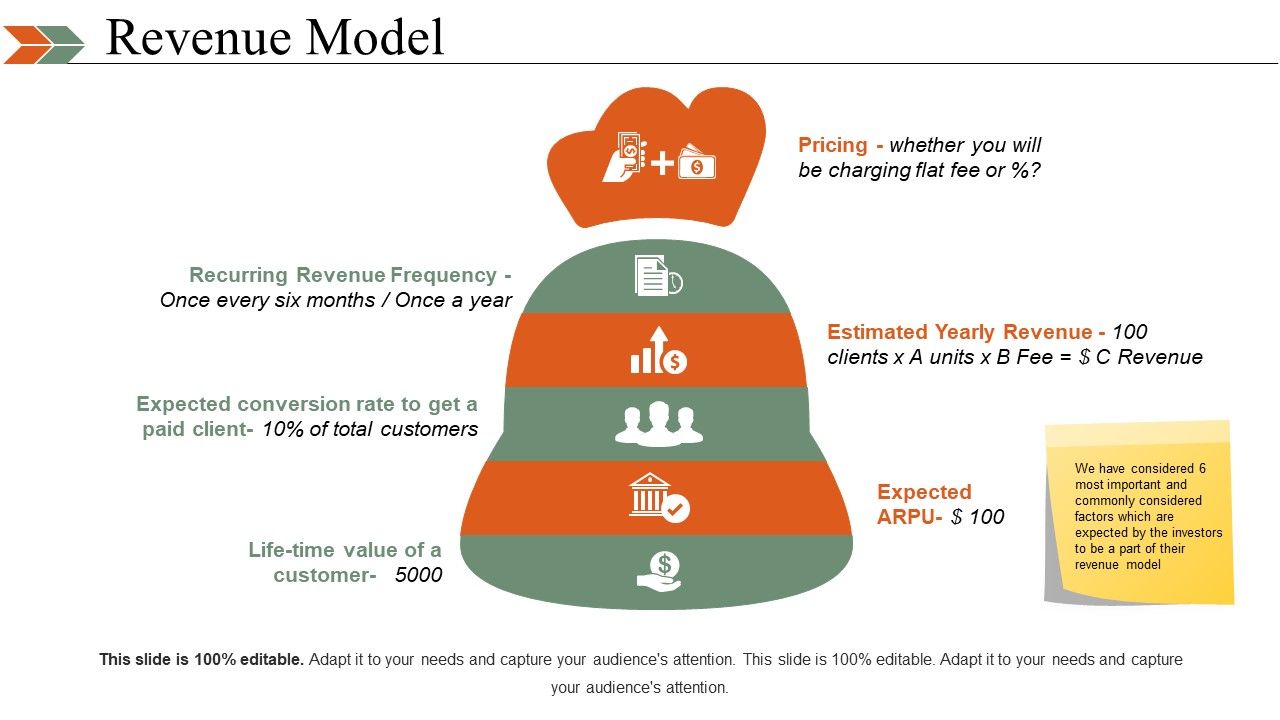
Slide 18: This slide showcases the Revenue Model showing- Life-time value of a customer, Pricing, Recurring Revenue Frequency, Estimated Yearly Revenue, Expected conversion rate to get a paid client, Expected ARPU, We have considered 6 most important and commonly considered factors which are expected by the investors to be a part of their revenue model.
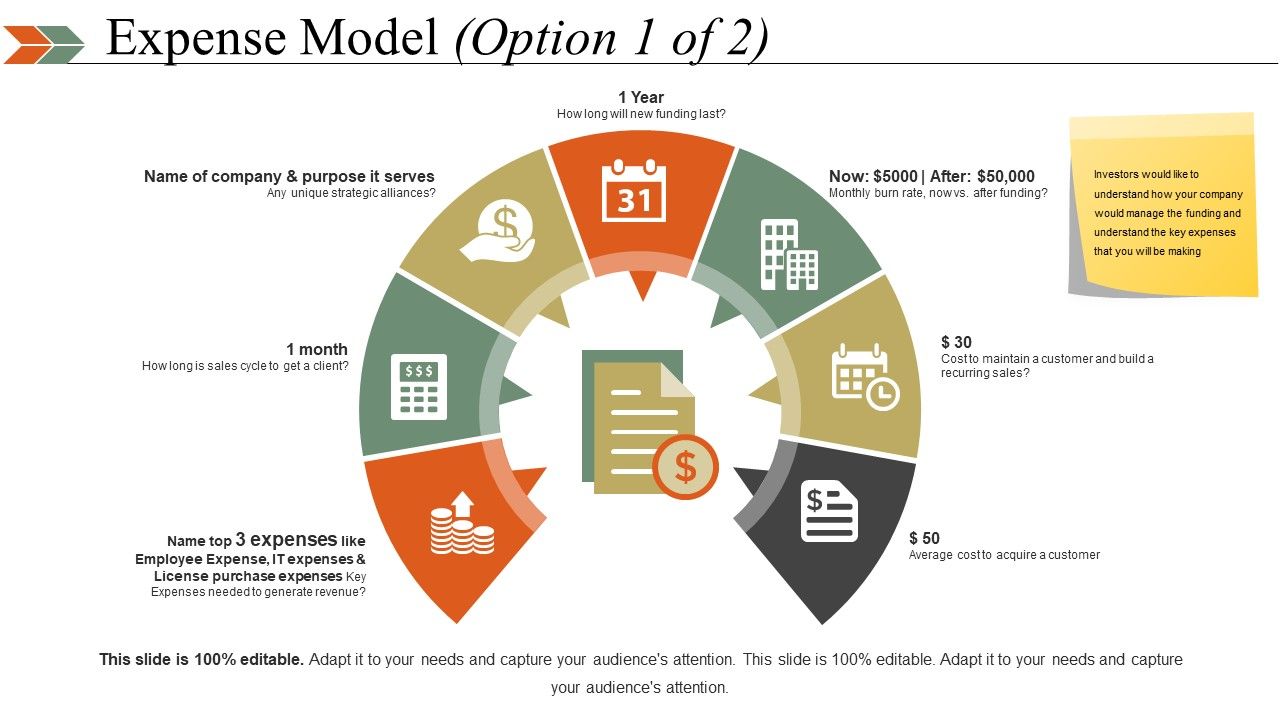
Slide 19: This slide presents an Expense Model showing- Name top 3 expenses like Employee Expense, IT expenses & License purchase expenses Key Expenses needed to generate revenue Name of company & purpose it serves Any unique strategic alliances? Average cost to acquire a customer. Cost to maintain a customer and build a recurring sales? Monthly burn rate, now vs. after funding? How long will new funding last? Investors would like to understand how your company would manage the funding and understand the key expenses that you will be making
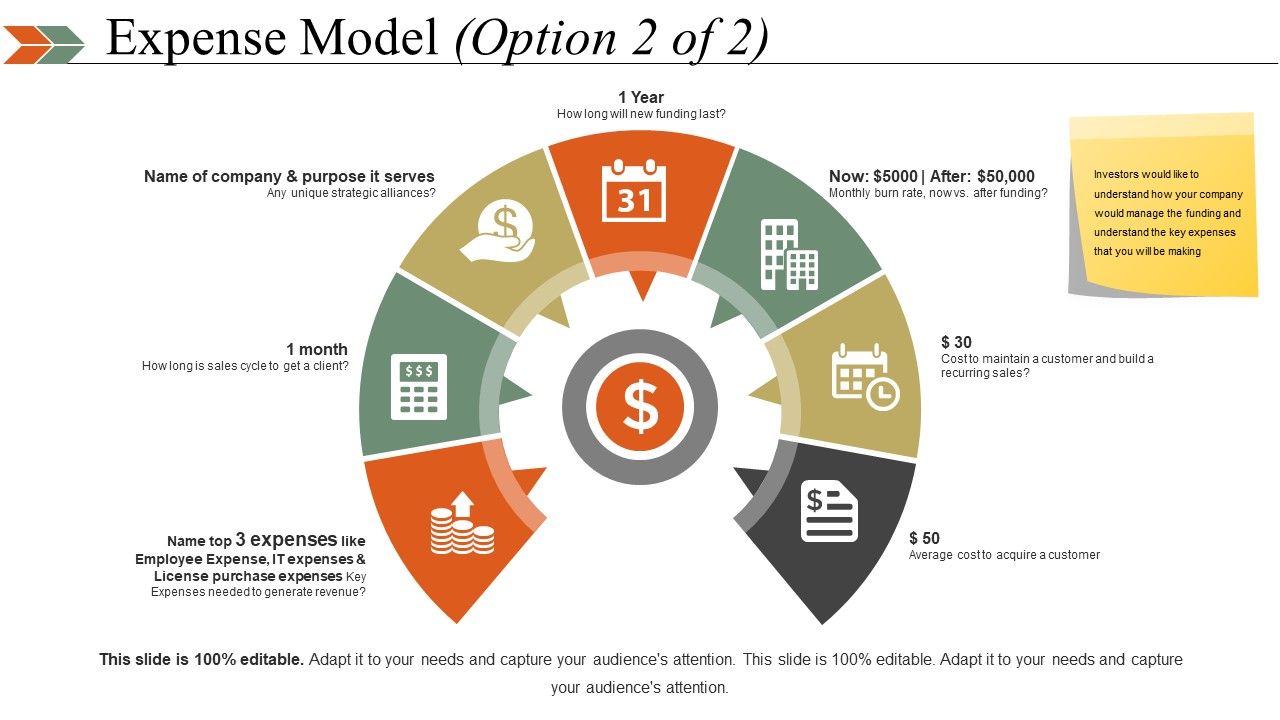
Slide 20: This slide also presents an Expense Model showing- Name top 3 expenses like Employee Expense, IT expenses & License purchase expenses Key Expenses needed to generate revenue Name of company & purpose it serves Any unique strategic alliances? Average cost to acquire a customer. Cost to maintain a customer and build a recurring sales? Monthly burn rate, now vs. after funding? How long will new funding last? Investors would like to understand how your company would manage the funding and understand the key expenses that you will be making.
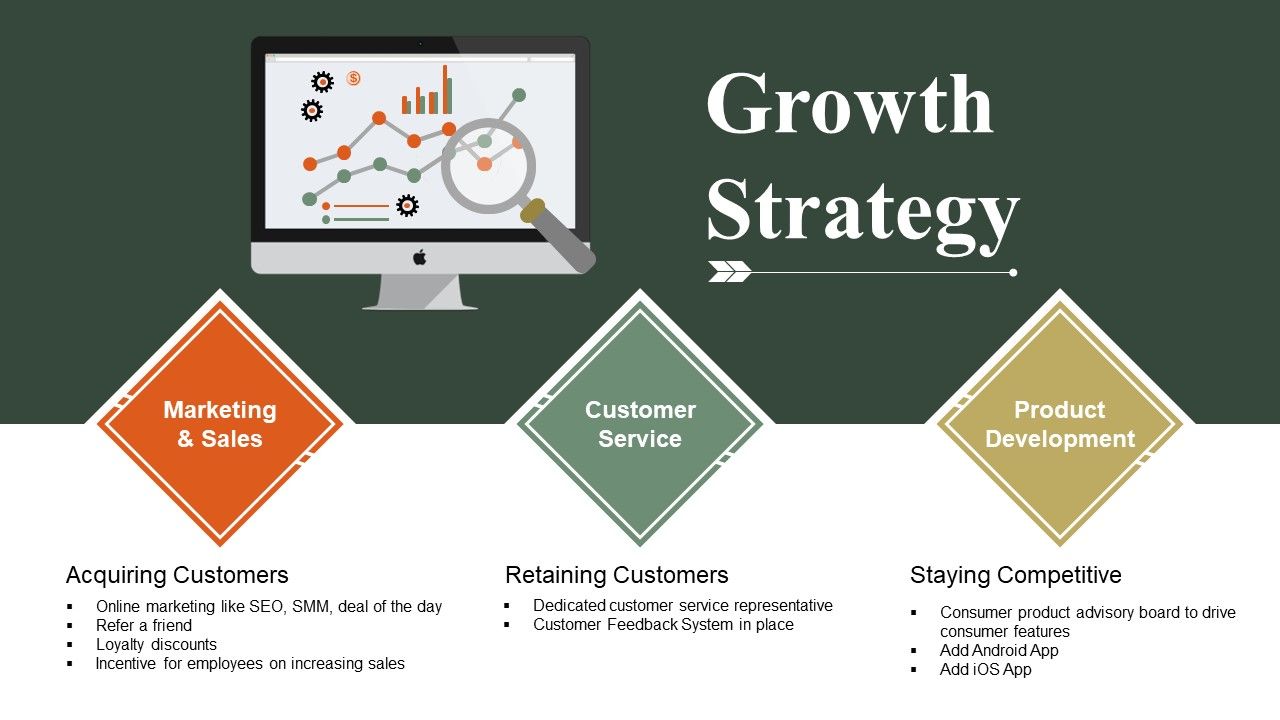
Slide 21: This slide showcases Growth Strategy shiwing- Acquiring Customers, Retaining Customers, Staying Competitive as Marketing & Sales, Customer Service, Product Development.
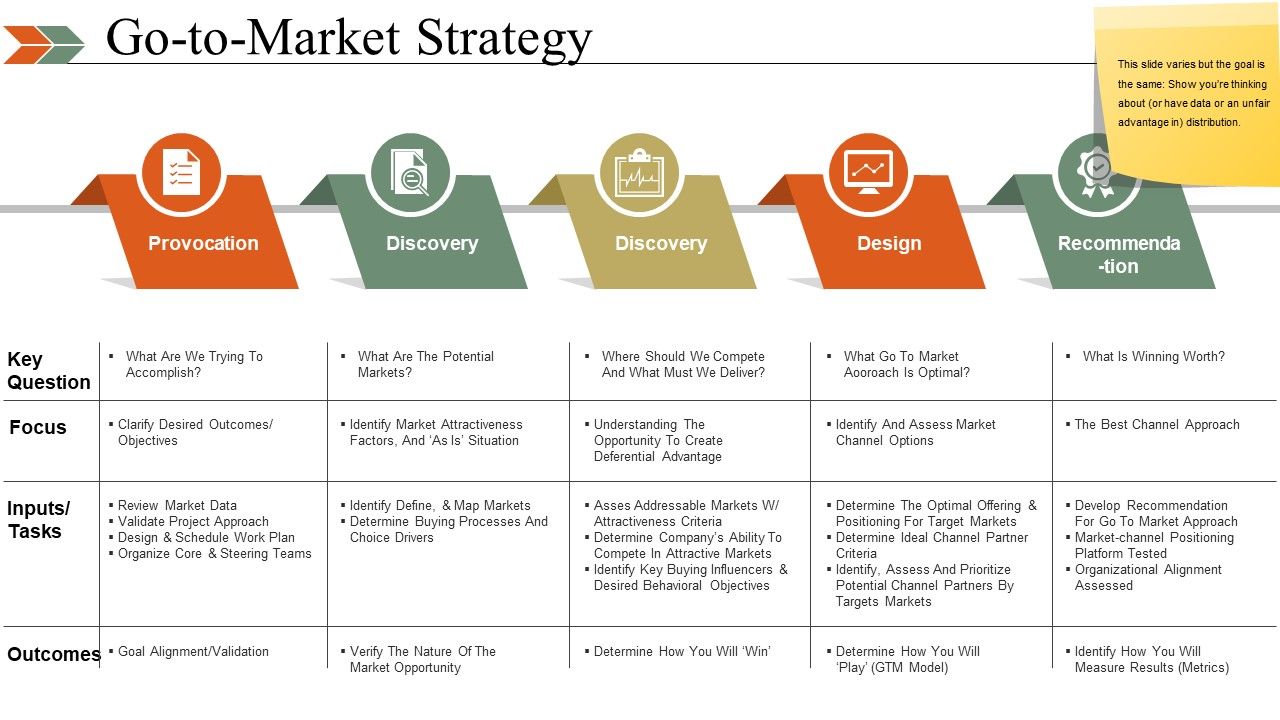
Slide 22: This slide presents Go-to-Market Strategy showing- Provocation, Discovery, Discovery, Design, Recommenda-tion, Outcomes, Goal Alignment/Validation. This slide varies but the goal is the same: Show you’re thinking about (or have data or an unfair advantage in) distribution.
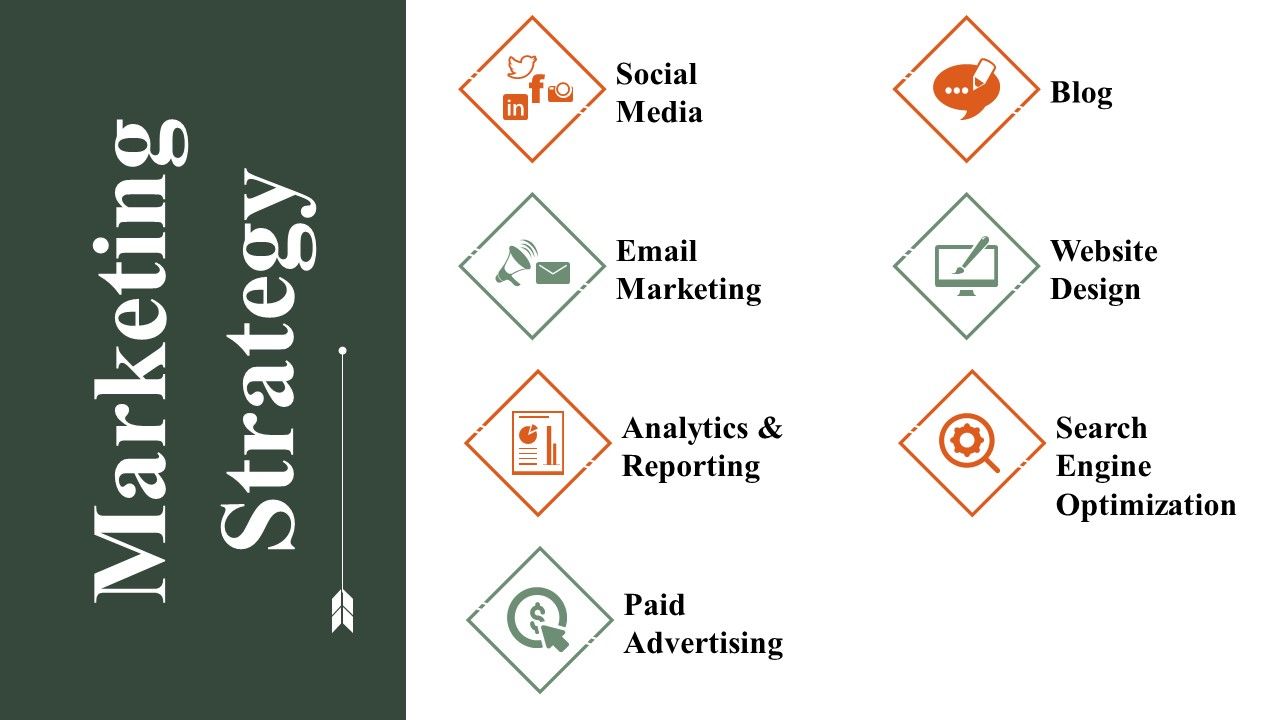
Slide 23: This slide showcases Marketing Strategy through- Paid Advertising, Social Media, Blog, Email Marketing, Website Design, Analytics & Reporting, Search Engine Optimization.
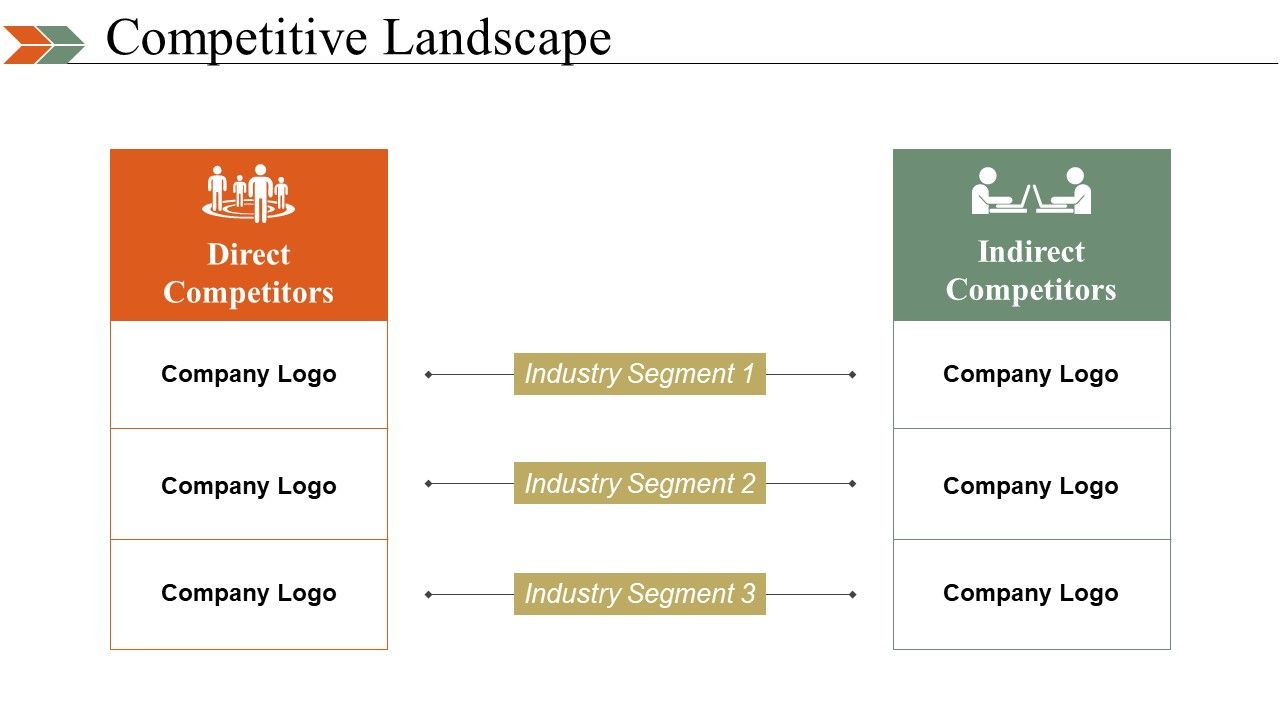
Slide 24: This slide presents Competitive Landscape divided into- Direct Competitors and Indirect Competitors.
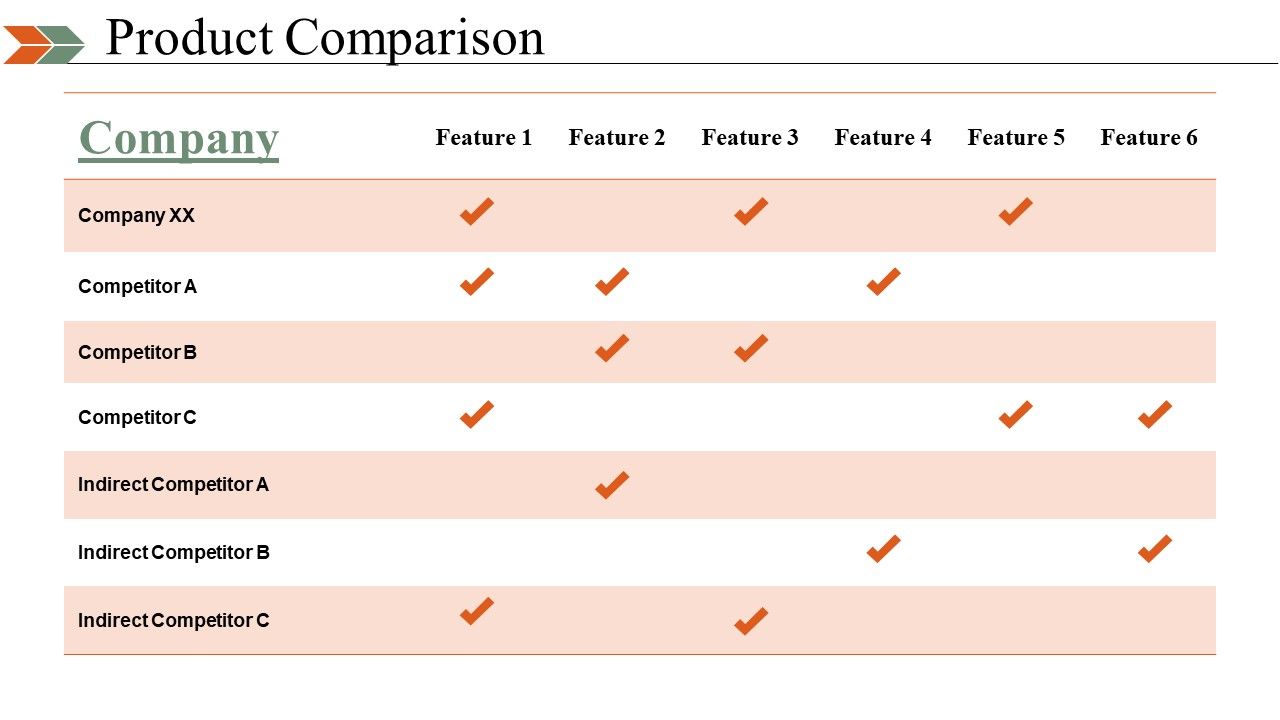
Slide 25: This is a Product Comparison table slide.
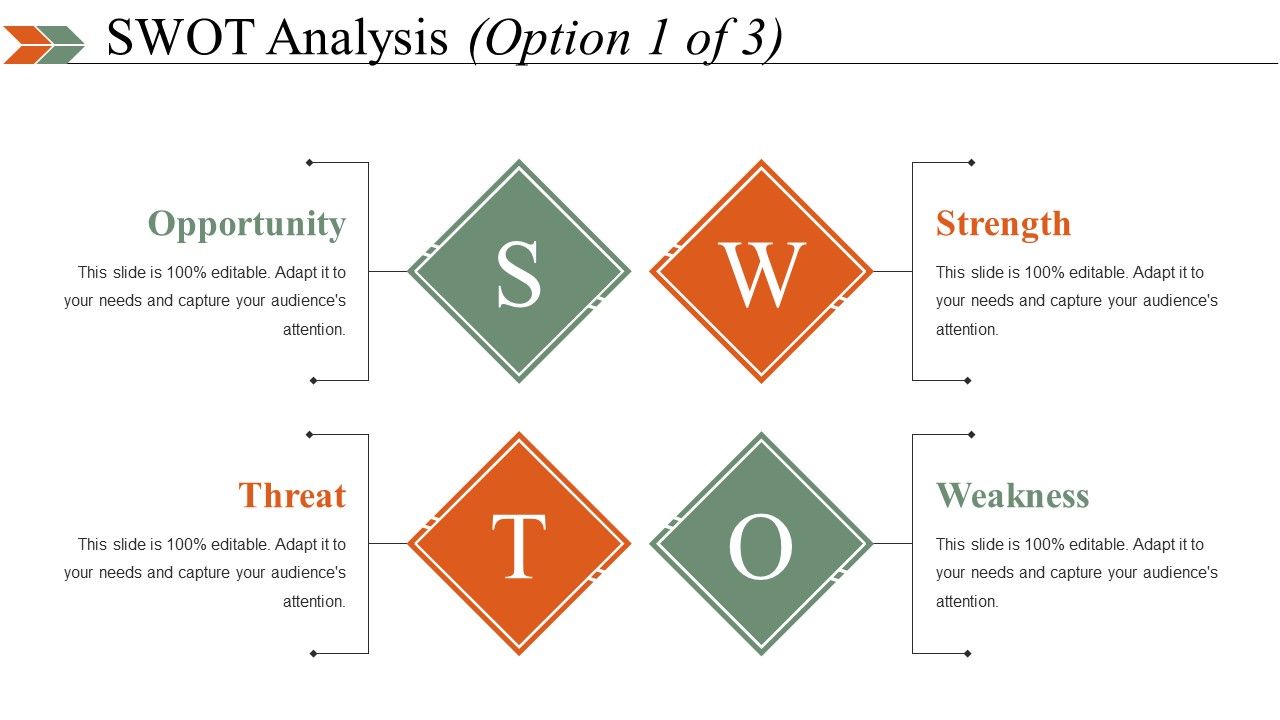
Slide 26: This slide showcases SWOT Analysis.
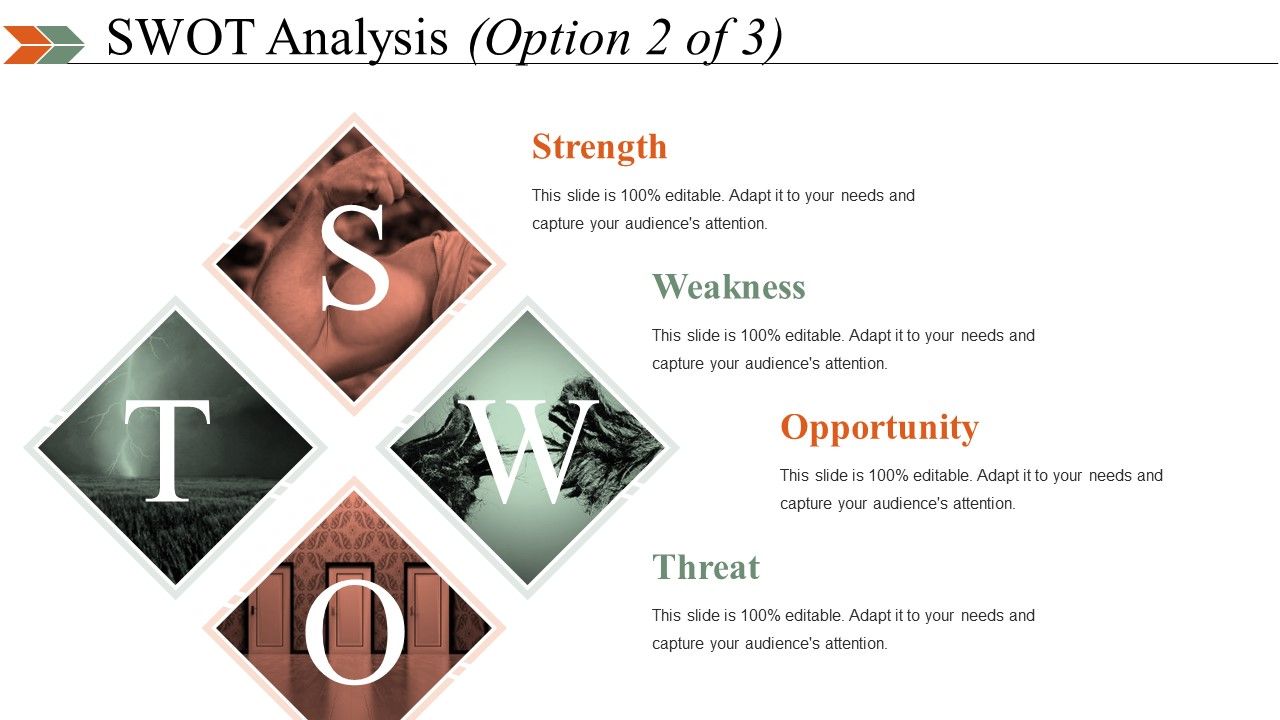
Slide 27: This slide also showcases SWOT Analysis.
Slide 28: This slide too presents SWOT Analysis.
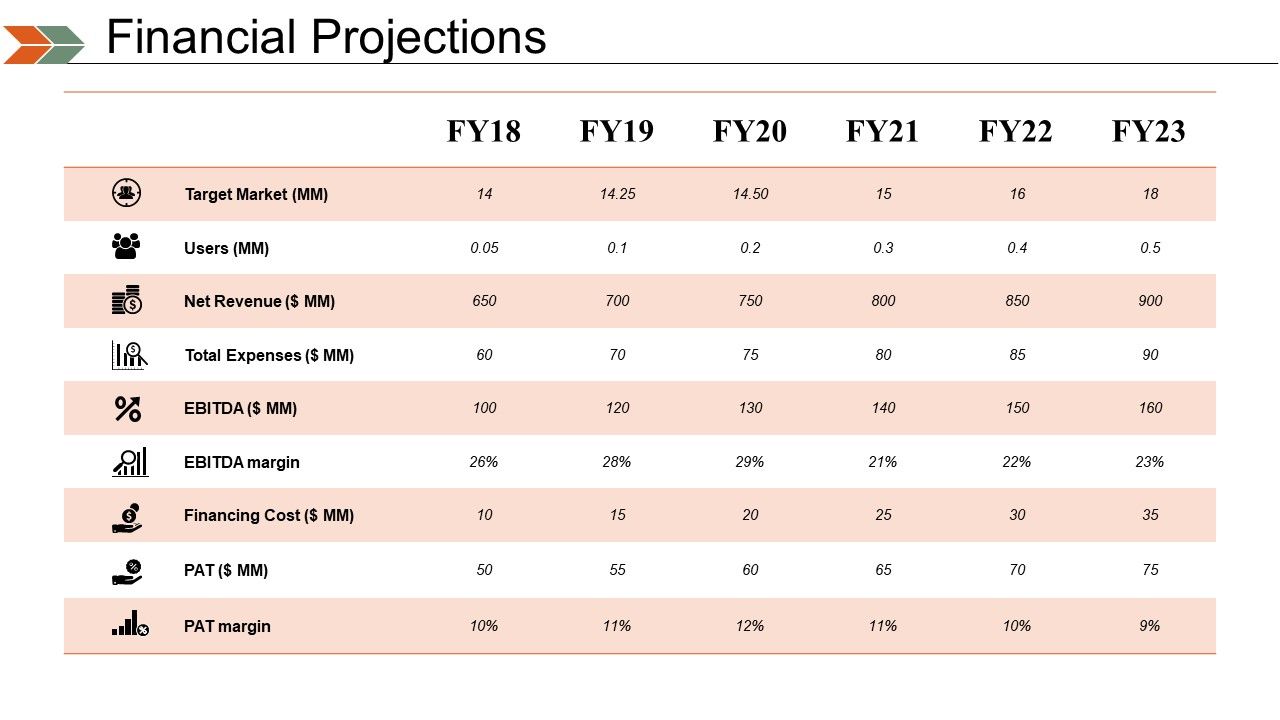
Slide 29: This slide displays Financial Projections in tabular form.
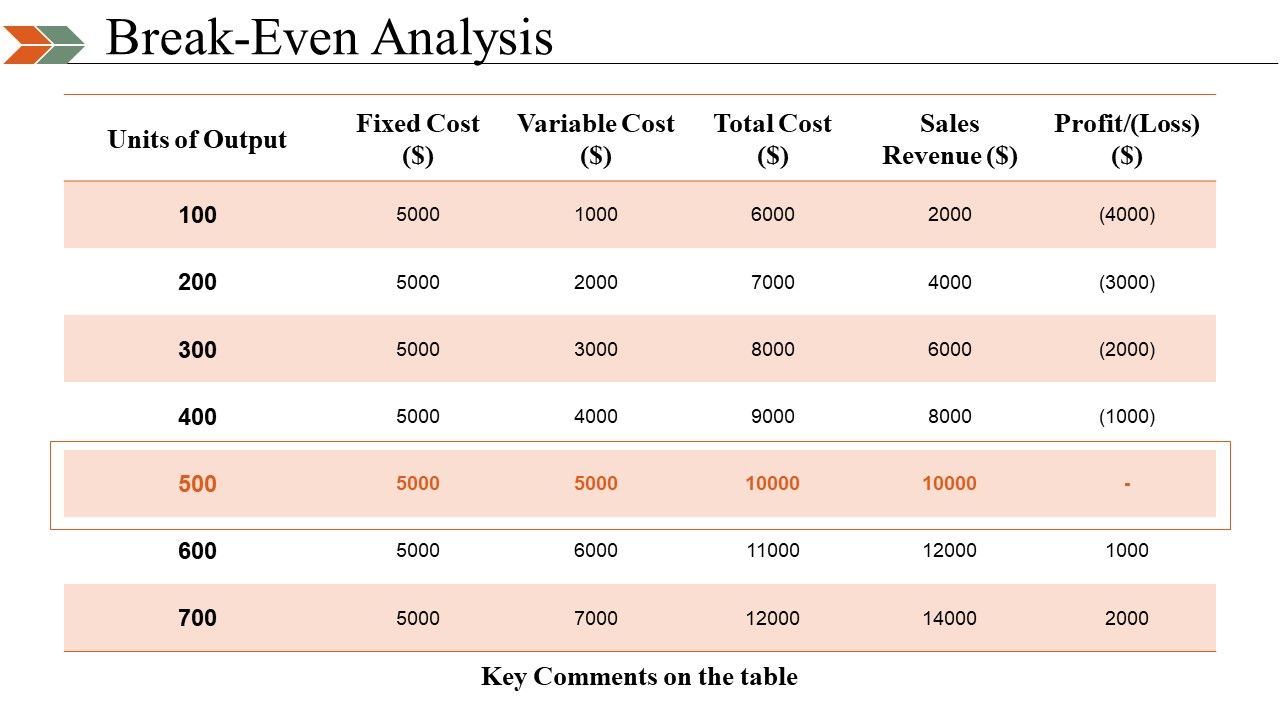
Slide 30: This slide prsents a Break-Even Analysis in tabular form.
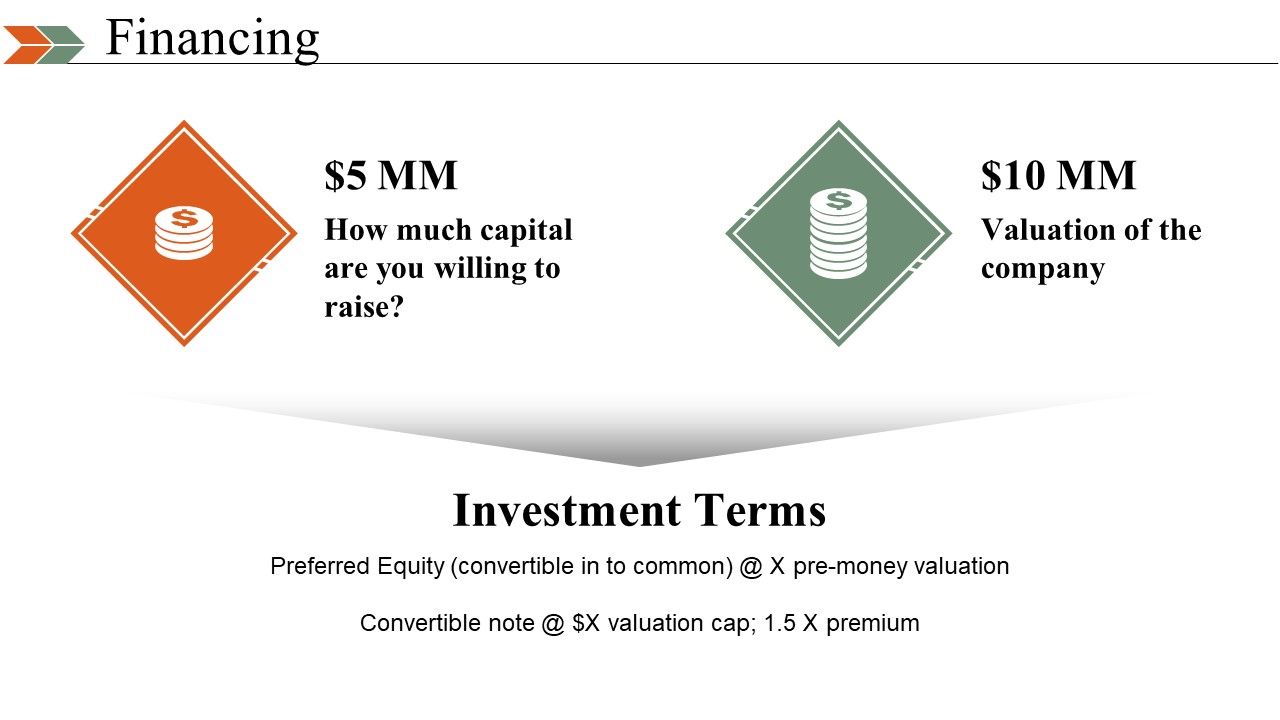
Slide 31: This slide shows Financing with- Investment Terms, How much capital are you willing to raise? Valuation of the company.
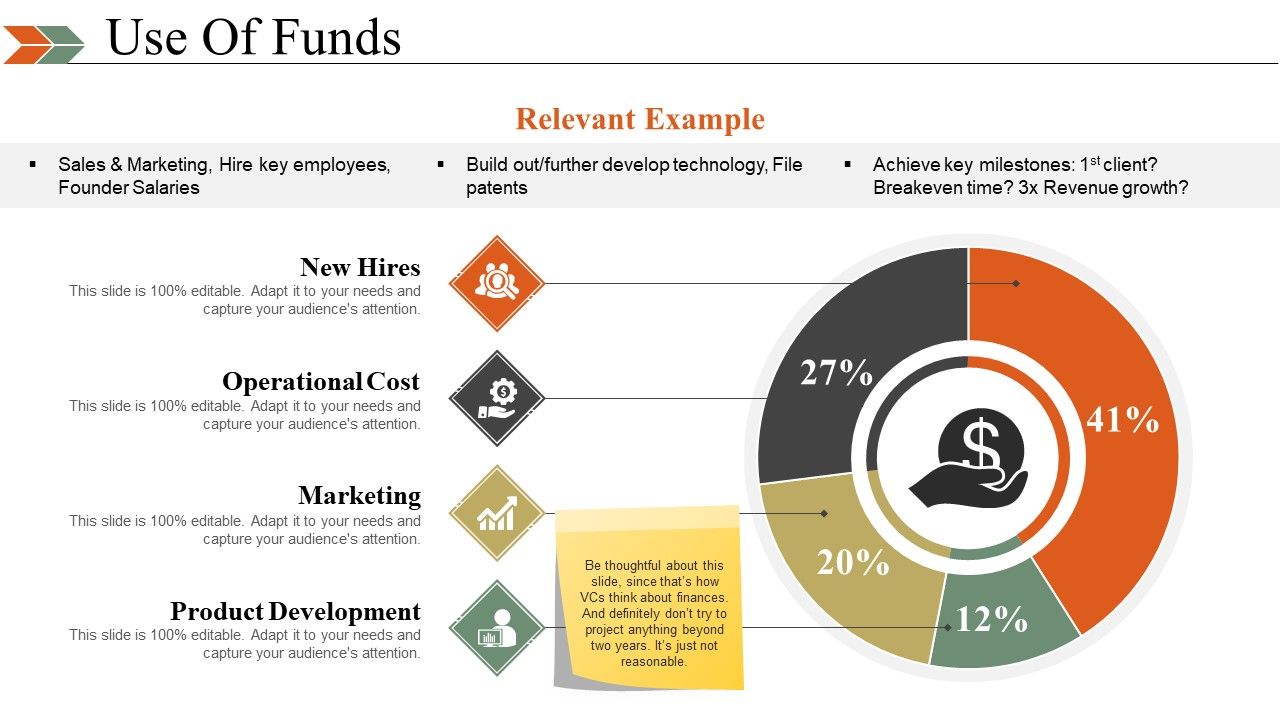
Slide 32: This slide shows Use Of Funds with the following subheadings- New Hires, Operational Cost, Marketing, Product Development.
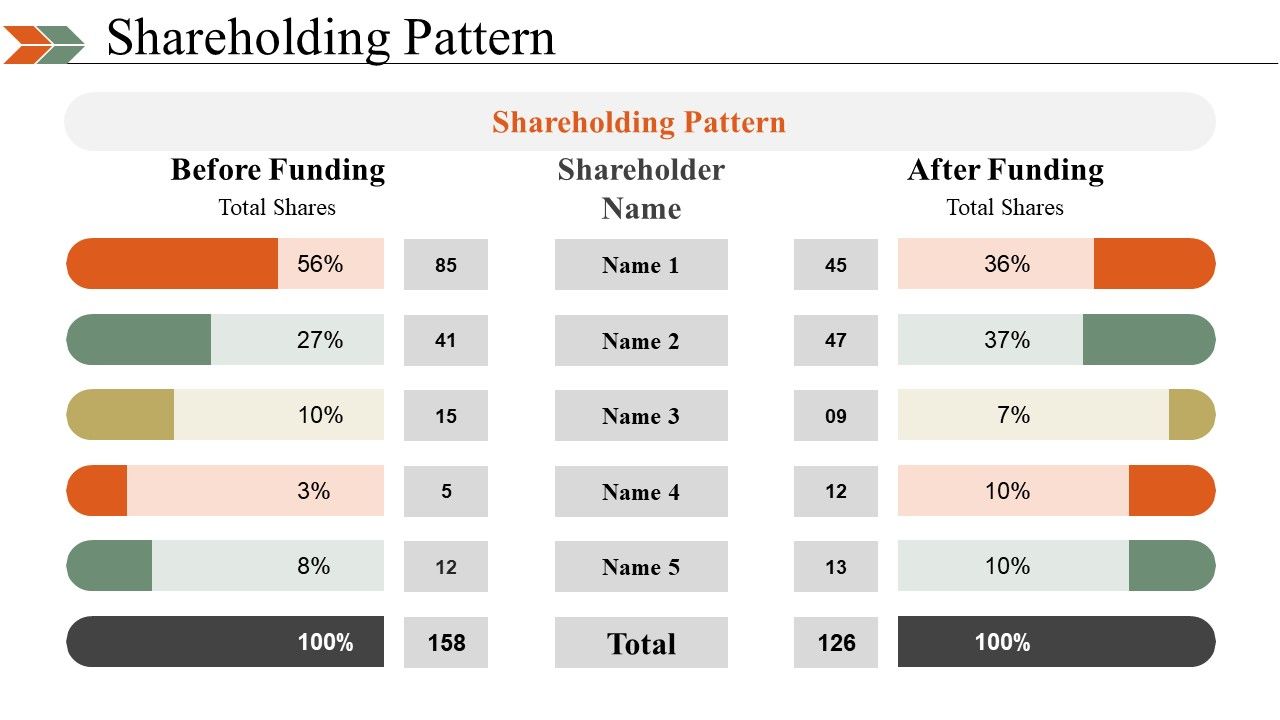
Slide 33: This slide showcases the Shareholding Pattern with- After Funding and Before Funding with total Shares.
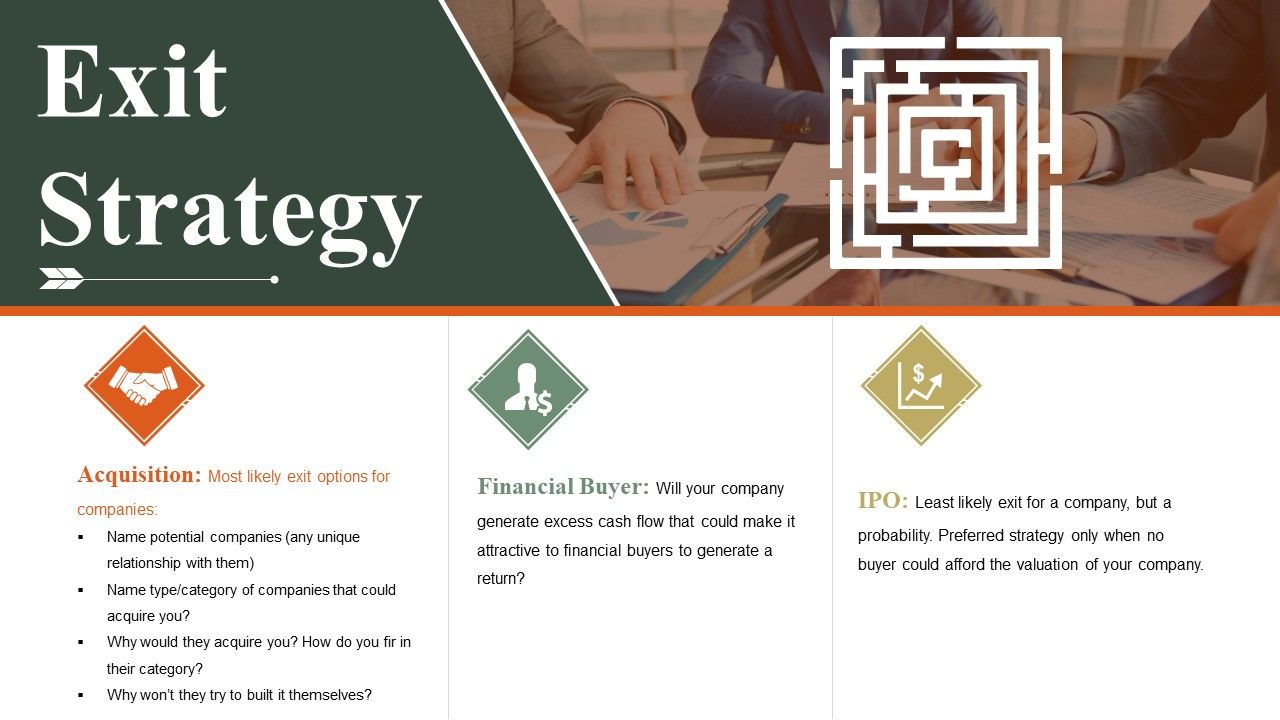
Slide 34: This slide showcases Exit Strategy showing- Acquisition, Financial Buyer, IPO.
Slide 35: This is a Client Testimonials slide with name to put with image boxes.
Slide 36: This is a Contact Details slide.
Slide 37: This is a Coffee break image slide to halt. You can change the slide content as per need.
Slide 38: This slide is titled Charts and Graphs to move forward. You can alter the slide content as per need.
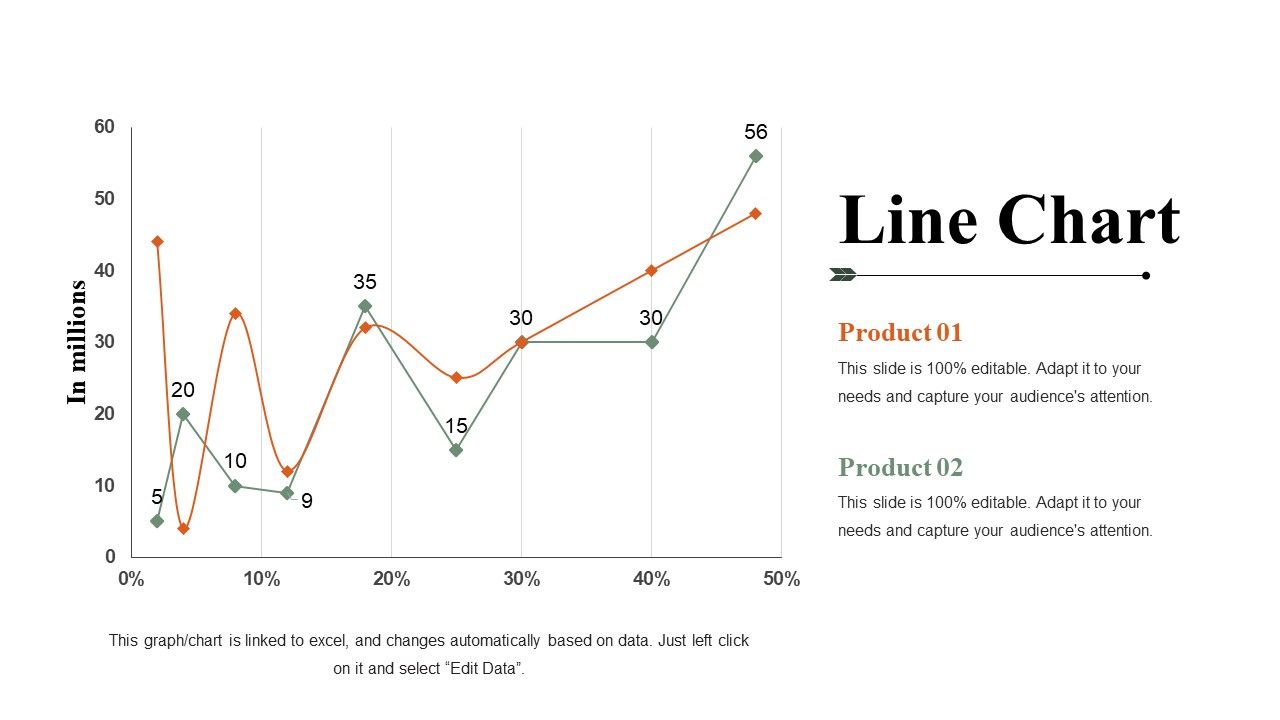
Slide 39: This is a Line chart slide. State specifications, comparison of products/entities here.
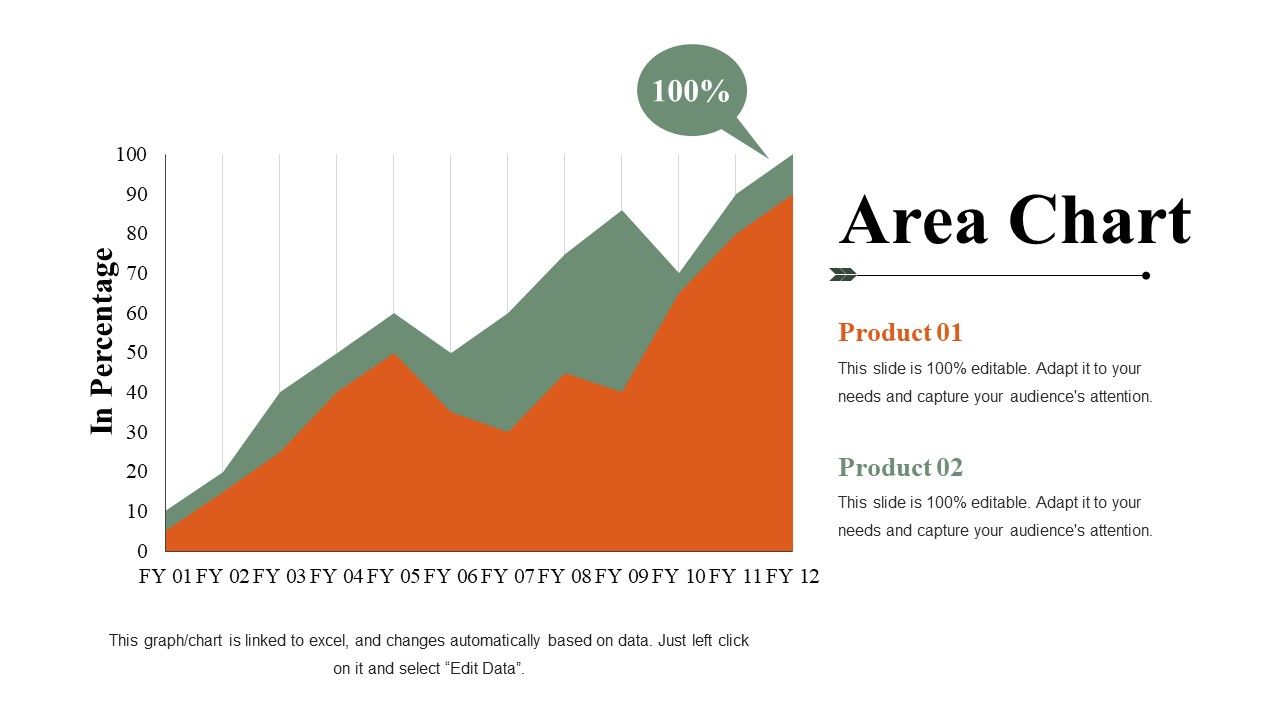
Slide 40: This is an Area chart slide. State specifications, comparison of products/entities here.
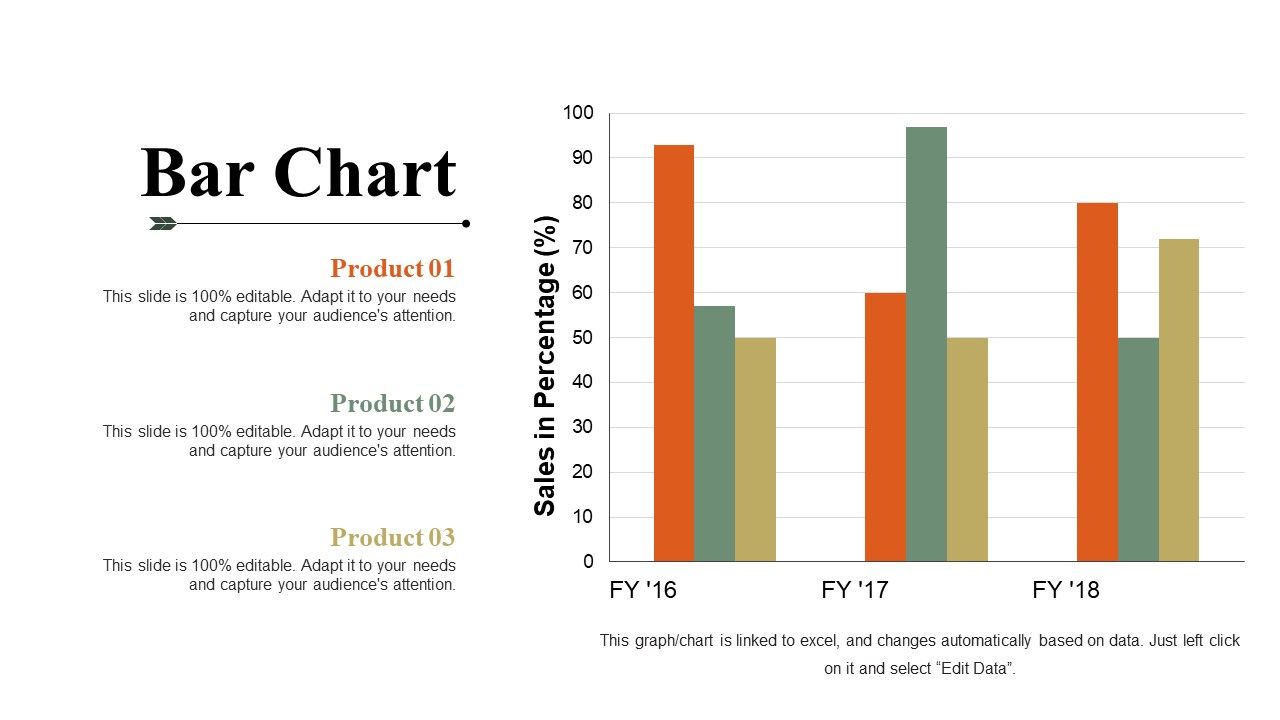
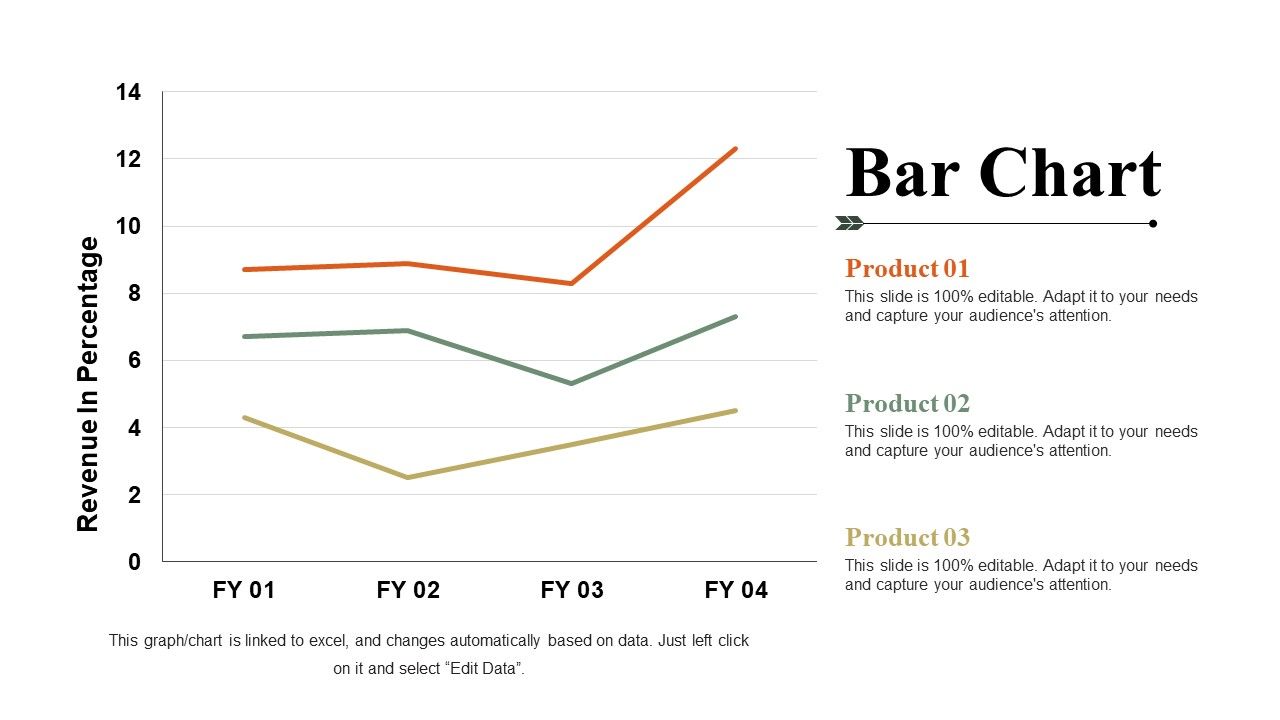
Slide 41: This is a Bar chart slide. State specifications, comparison of products/entities here.
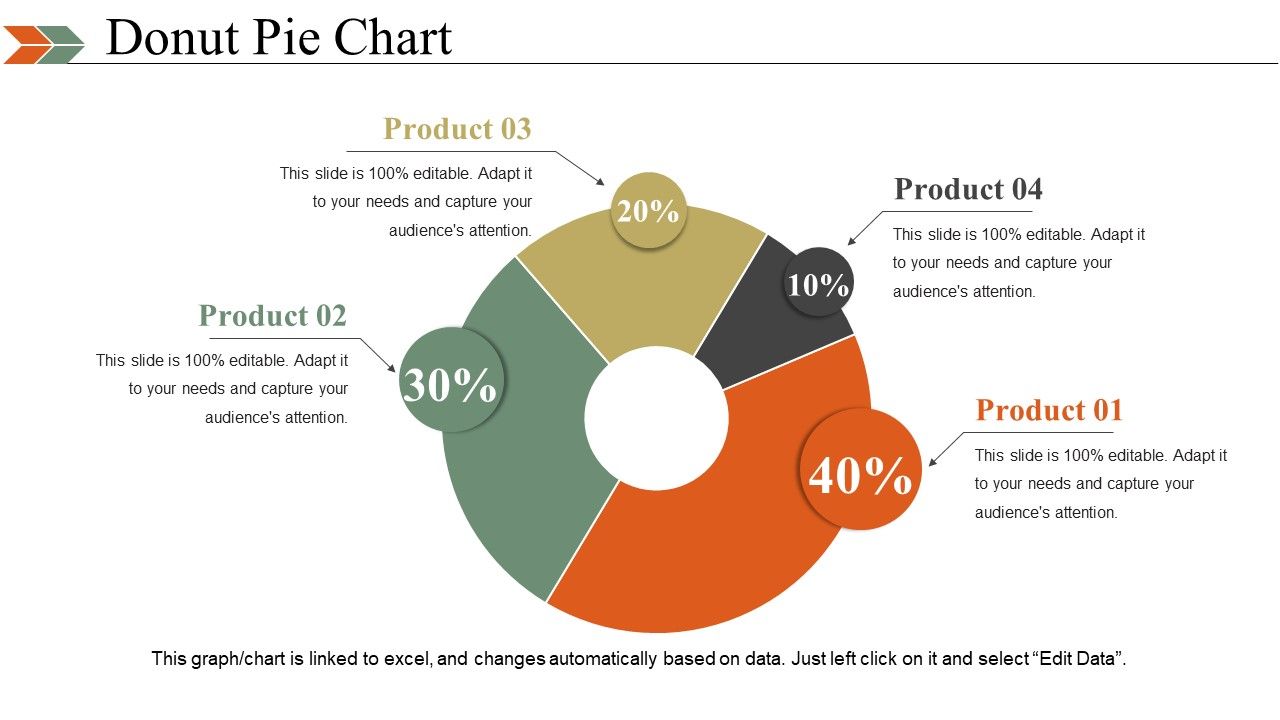
Slide 42: This is a Donut Pie chart slide. State specifications, comparison of products/entities here.
Slide 43: This is another Area chart slide. State specifications, comparison of products/entities here.
Slide 44: This slide is titled Additional Slides to move forward. You can change the slide content as per need.
Slide 45: This is Our Mission Goal slide. State your mission here.
Slide 46: This is Meet Our Team slide with names, designation and text boxes.
Slide 47: This is an About Us slide. State company/team specifications here.
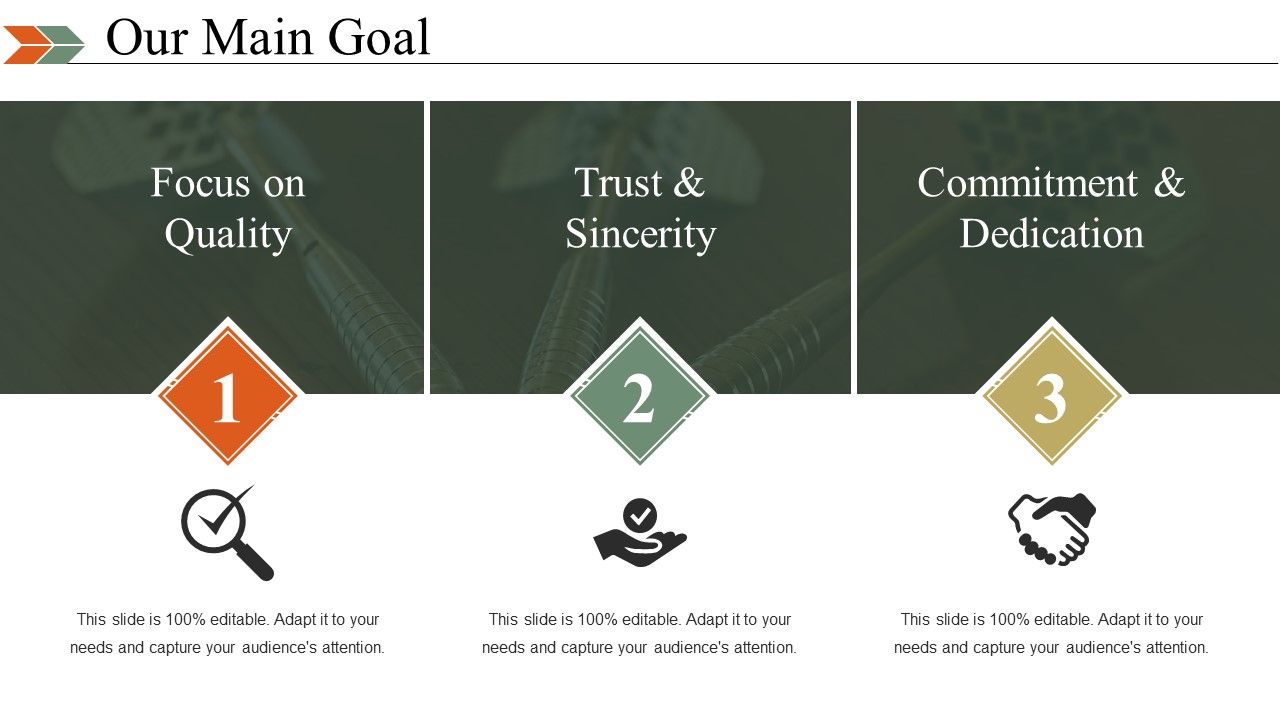
Slide 48: This is Our Main Goal slide. State your goals here.
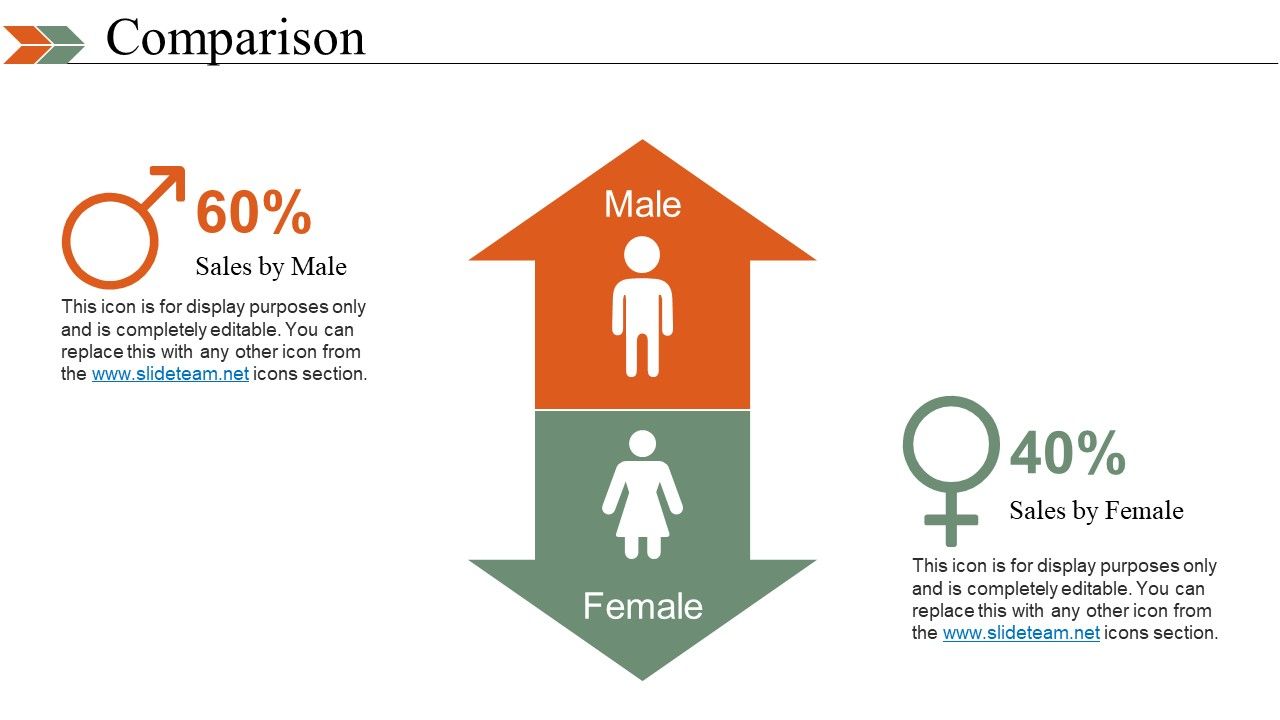
Slide 49: This slide showcases Comparison of two entities in arrow imagery form.
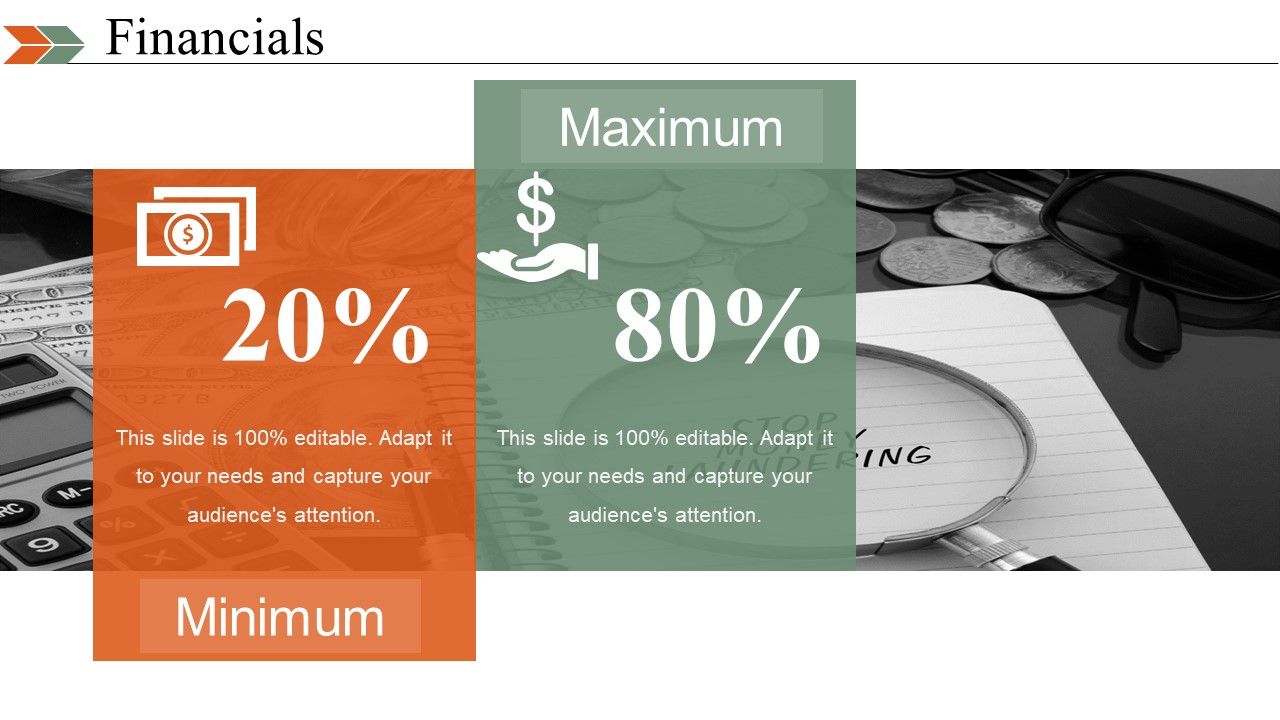
Slide 50: This is a Financial score slide. State financial aspects, information etc. here.
Slide 51: This is a Quotes slide to convey company/organization message, beliefs etc. You may change the slide content as per need.
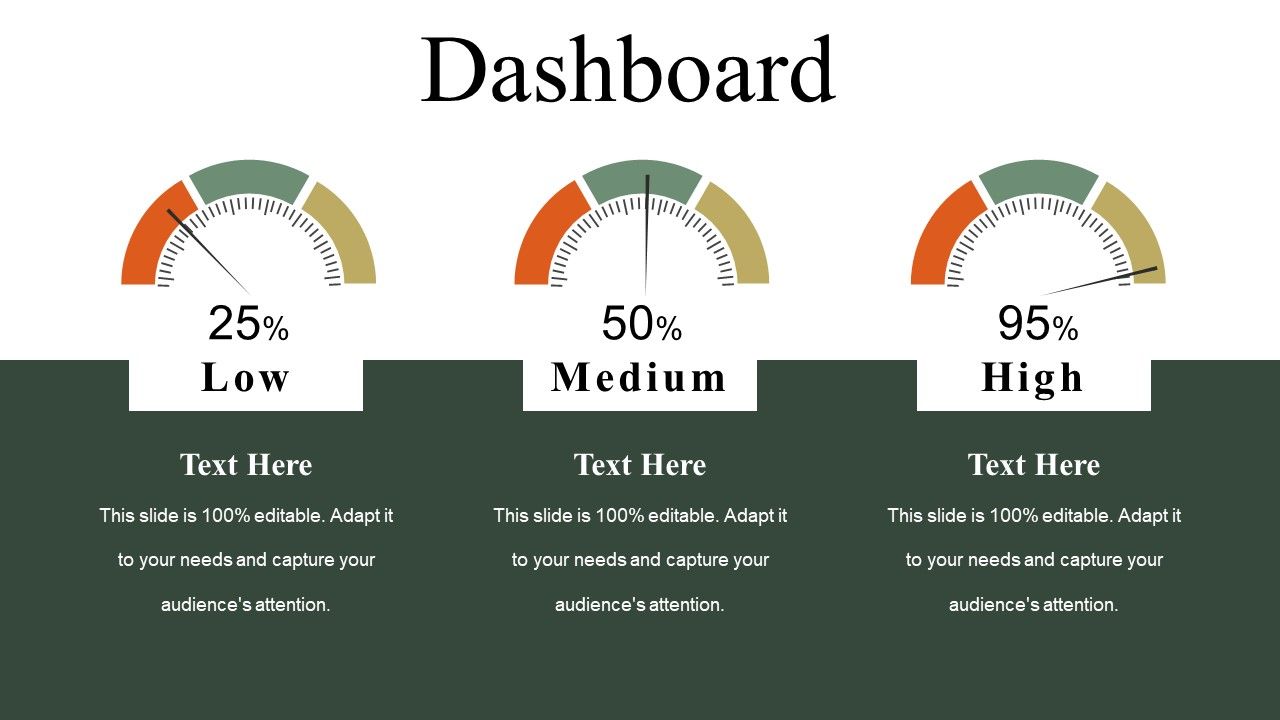
Slide 52: This slide presents Dashboard to present Kpis, metrics etc.
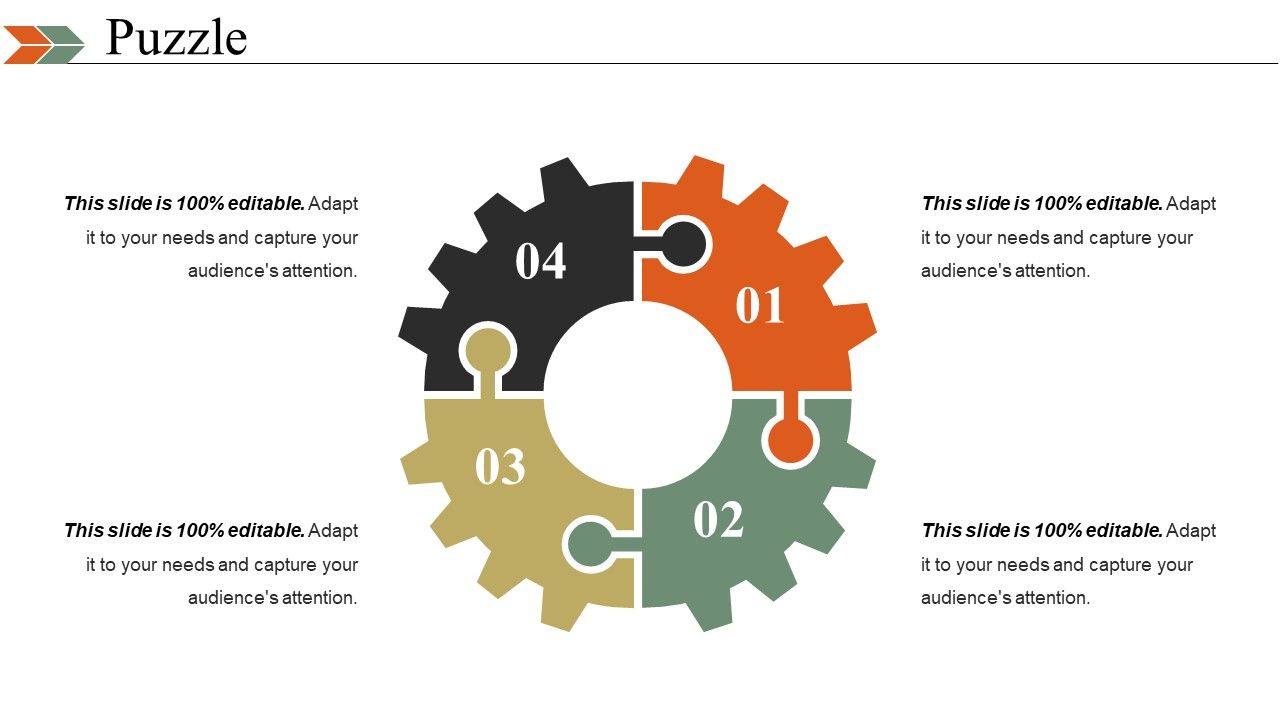
Slide 53: This is a Puzzle image slide. State information, specifications etc. here.
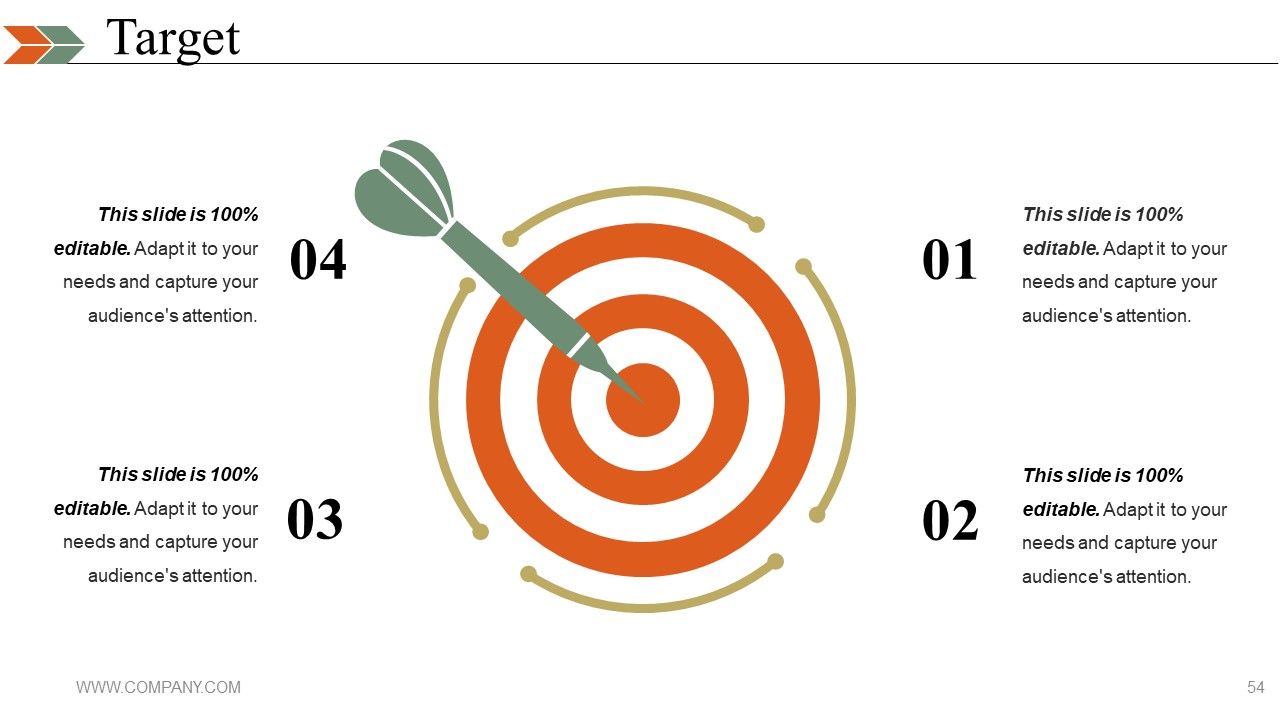
Slide 54: This is a Target image slide. State targets, information, specifications etc. here.
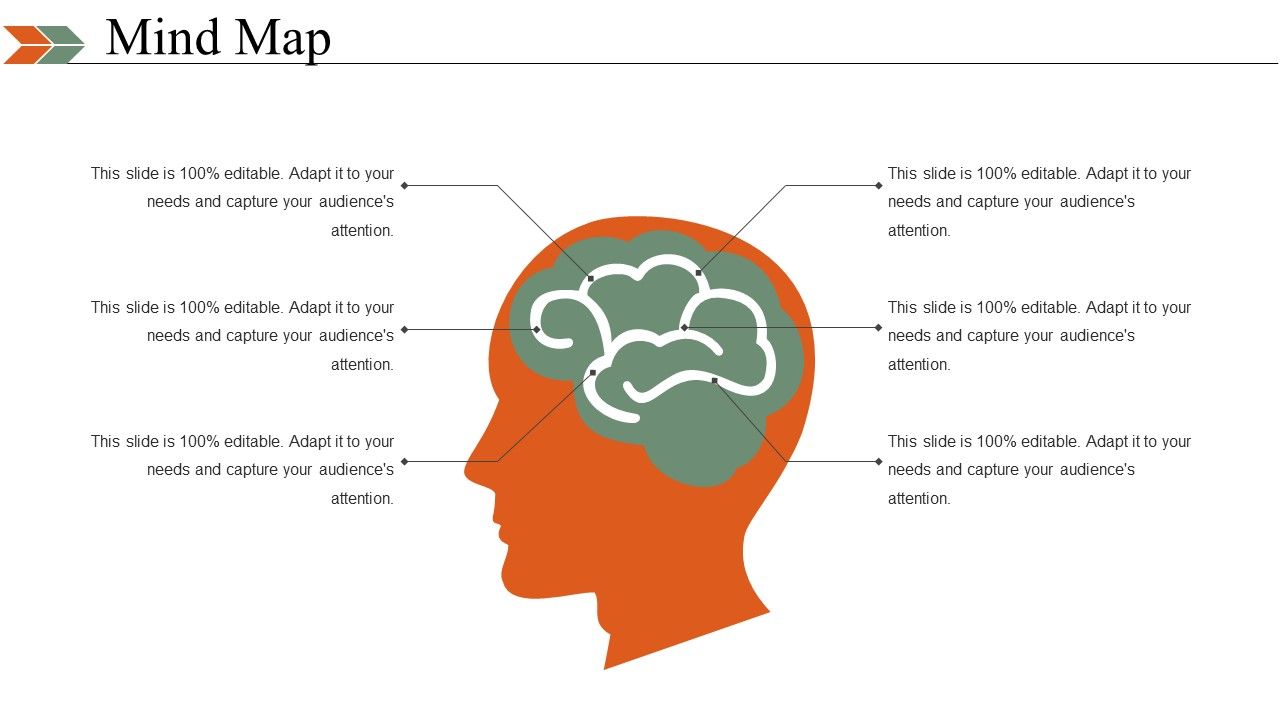
Slide 55: This is a Mind map image slide to show information, specifications etc.
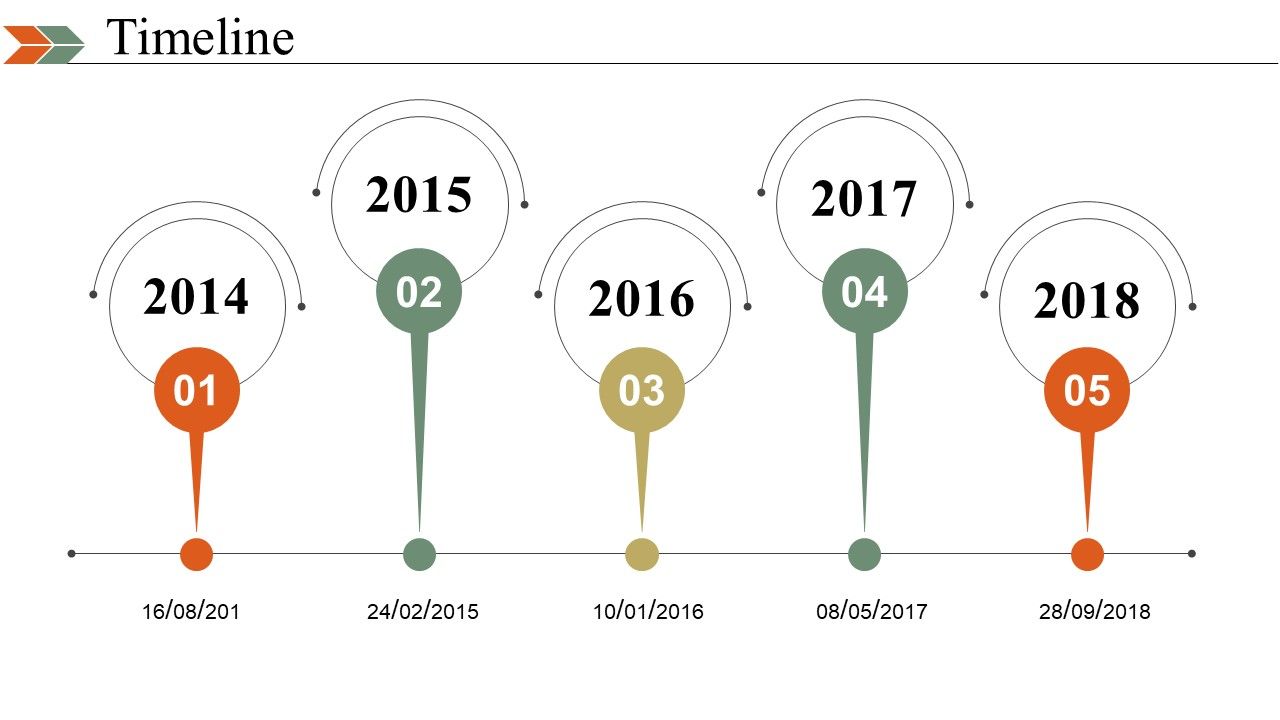
Slide 56: This is a Timeline slide to show company growth, milestones evolution etc.
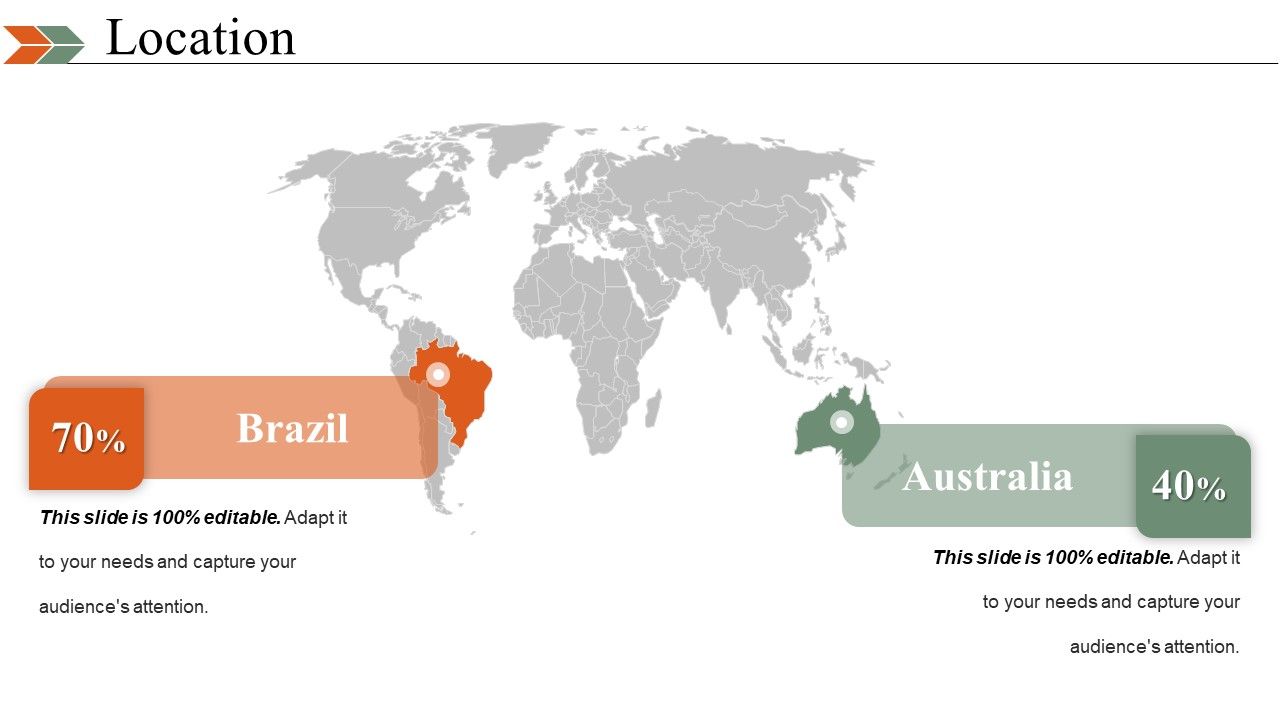
Slide 57: This is a Location slide of world map image to show global presence, growth etc.
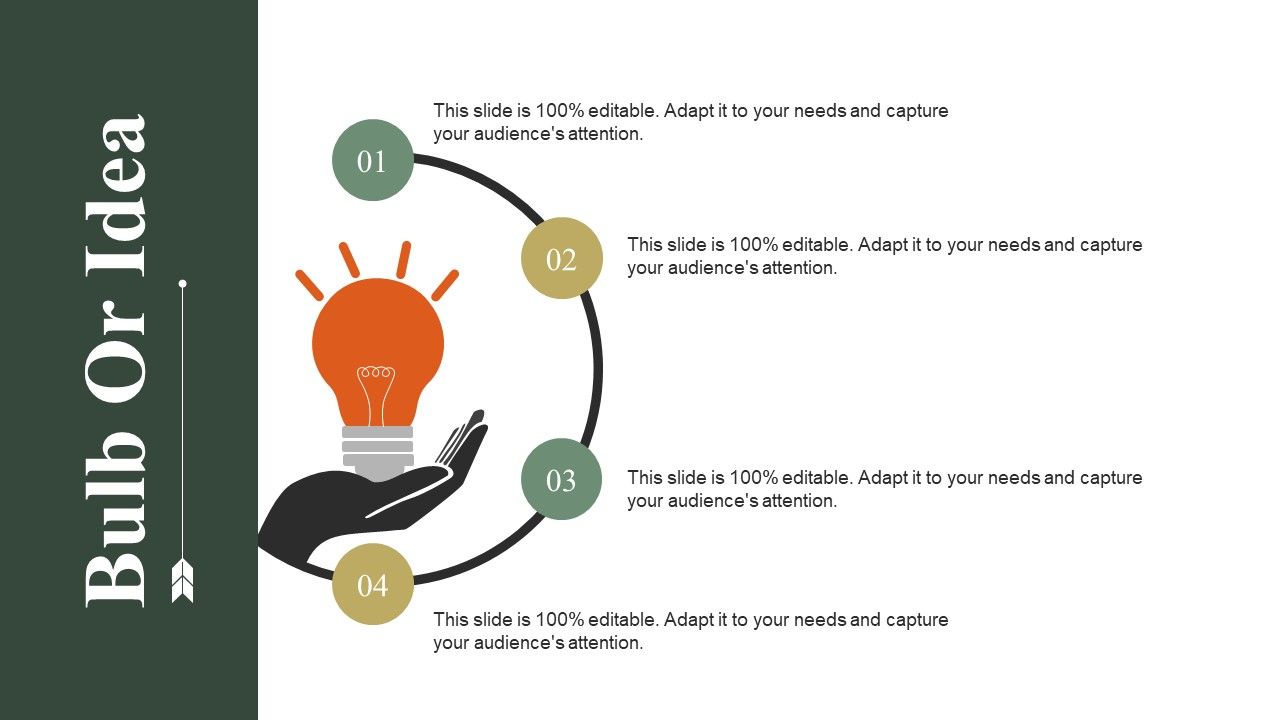
Slide 58: This is a Bulb or Idea image slide to show innovative information, specifications etc.
Slide 59: This is a Magnifying Glass image slide to show information, specifications etc.
Slide 60: This is a Thank You slide with Address# street number, city, state, Contact Number, Email Address.
Business Swot Analysis Product Comparison And Competitive Landscape Powerpoint Presentation Slides with all 60 slides:
Use our Business Swot Analysis Product Comparison And Competitive Landscape to effectively help you save your valuable time. They are readymade to fit into any presentation structure.
FAQs
A SWOT analysis is an evaluation of a business's strengths, weaknesses, opportunities, and threats. It is essential to include in a business pitch as it provides investors with an understanding of the company's position in the market.
The product comparison slide allows investors to see how the company's product or service differs from others in the market. This information helps investors assess the potential for success in the market.
A value proposition slide should include information on the company's product or service, what the customer needs, and the marketplace offerings. This slide should provide investors with a clear understanding of what sets the company apart from its competitors.
A growth strategy is crucial to a business pitch as it shows investors how the company plans to increase revenue and expand its customer base. This information is essential for investors when assessing the potential return on investment.
An expense model slide outlines the key expenses associated with running the business, including costs to acquire and maintain customers, employee expenses, and IT expenses. This information helps investors understand how the company plans to allocate its funding and generate revenue.
-
Enough space for editing and adding your own content.
-
Easily Understandable slides.
-
Very unique, user-friendly presentation interface.
-
Informative presentations that are easily editable.


