Sample Financial Analysis Report Manufacturing Powerpoint Presentation Slides
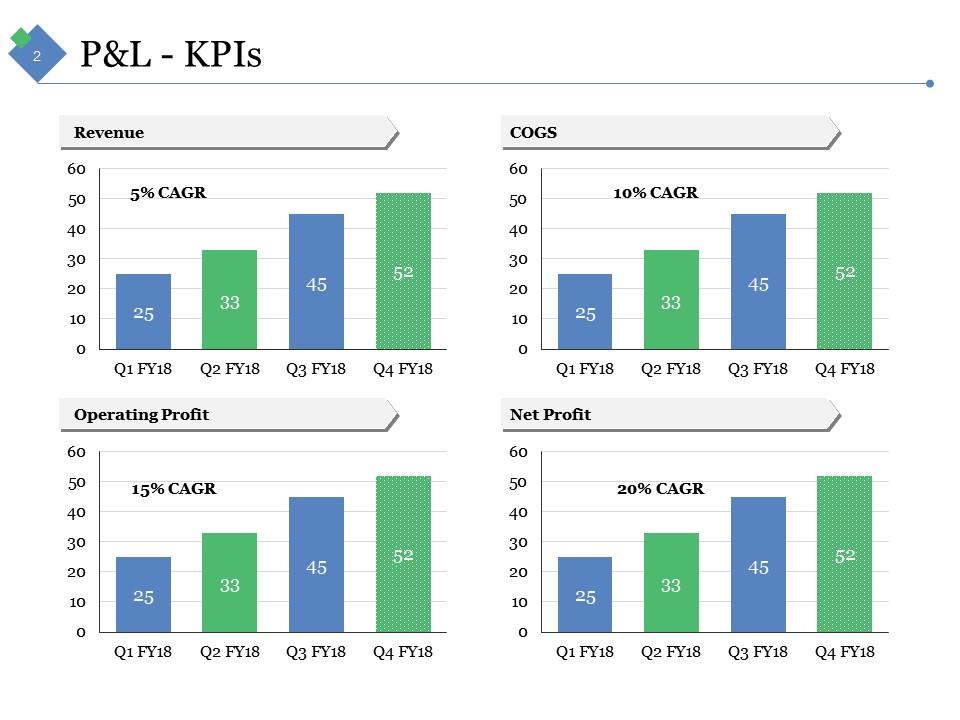
A detailed appraisal of a company as far as company’s progress is concerned is a must and should be put together in the form of PPT presentation. There are many valuable steps that must be kept in mind while displaying the data in financial report ppt Slides. The core areas which need due and special attention in PPT layout include identification of economic characteristics, areas focusing on companies strategies, tracking the company’s financial statements along with its profitability and risks. Tabular form of data and bar graphs featured in the PPT templates focus on areas like revenue, net profit, operating profit and more. The different modes of showing data on balance sheets in slides of PowerPoint presentation makes your life so much easy as you just need to add the data and you are ready to go. All this composite form of data representation in financial analysis report manufacturing presentation slide helps you lead and take the right decisions well in time Brief them on first aid with our Sample Financial Analysis Report Manufacturing Powerpoint Presentation Slides. Enlighten folks on handling injuries.
You must be logged in to download this presentation.
 Impress your
 audience
Editable
of Time
PowerPoint presentation slides
Shapes can be restructured, and relevant text can be added in presentation visual. Presentation slide can be put to use for handling financial details such as sales, management and financial analysis. Unique layouts which can be adjusted with respect to font, graphics and other related layouts. Effective color combination ensures professional look to PPT layout. Conversion into PDF or JPG formats is not at all difficult. PPT slides offer font, graphic and text size which can be read by all in a room or hall. Art graphic size and orientation can be managed.
People who downloaded this PowerPoint presentation also viewed the following :
Content of this Powerpoint Presentation
Slide 1: This slide introduces Sample Financial Analysis Report Manufacturing. State your company name and get started.
Slide 2: This is P&L - KPIs slide showcasing the following four graphs- COGS, Net Profit, Operating Profit, Revenue CAGR.
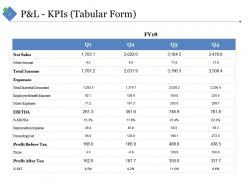
Slide 3: This is P&L - KPIs (Tabular Form) slide. Present your own P&L - KPIs in a tabular form here.
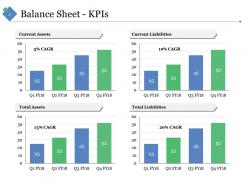
Slide 4: This slide presents Balance Sheet - KPIs further showing- Current Liabilities, Current Assets, Total Assets, Total Liabilities.
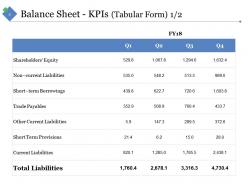
Slide 5: This slide presents Balance Sheet - KPIs in a Tabular Form majorly showing Total Liabilities.
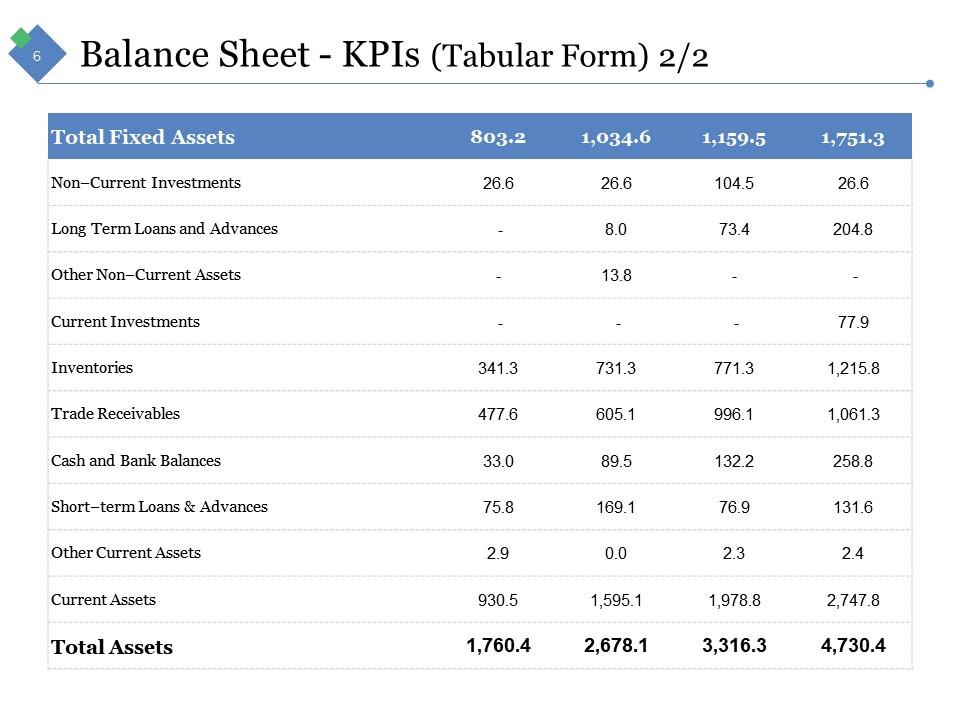
Slide 6: This slide also presents Balance Sheet - KPIs in a Tabular Form majorly showing Total Assets.
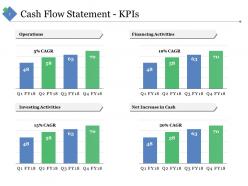
Slide 7: This is Cash Flow Statement - KPIs slide showing- Financing Activities, Operations, Investing Activities, Net Increase in Cash.
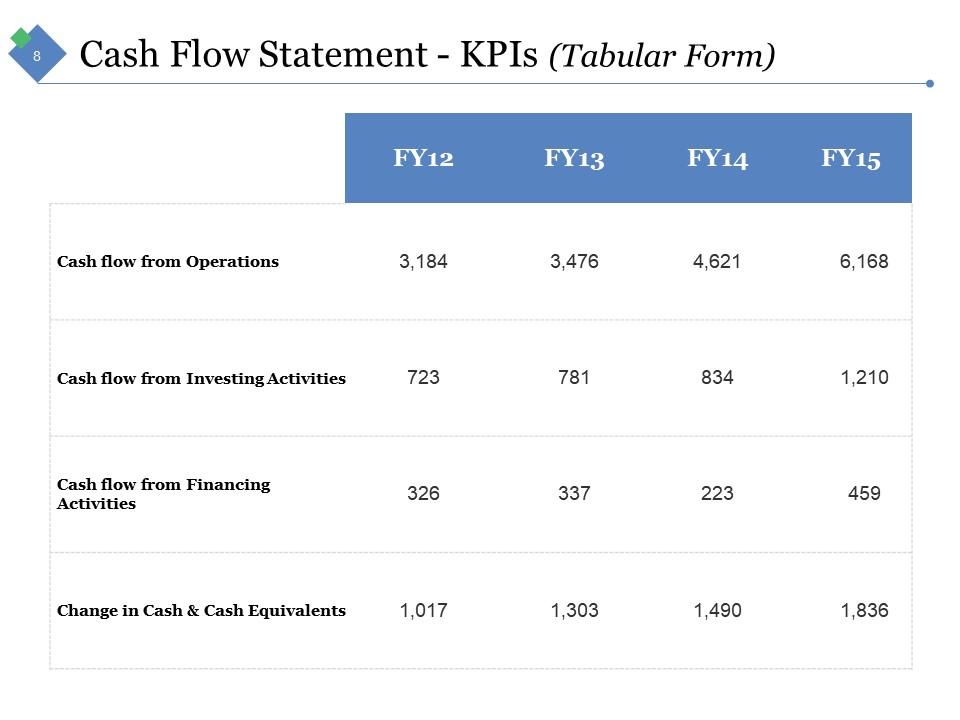
Slide 8: This slide shows Cash Flow Statement - KPIs in a Tabular Form.
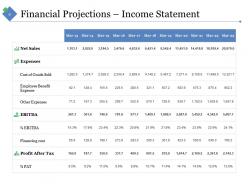
Slide 9: This slide shows Financial Projections – P&L Income Statement (USD MM).
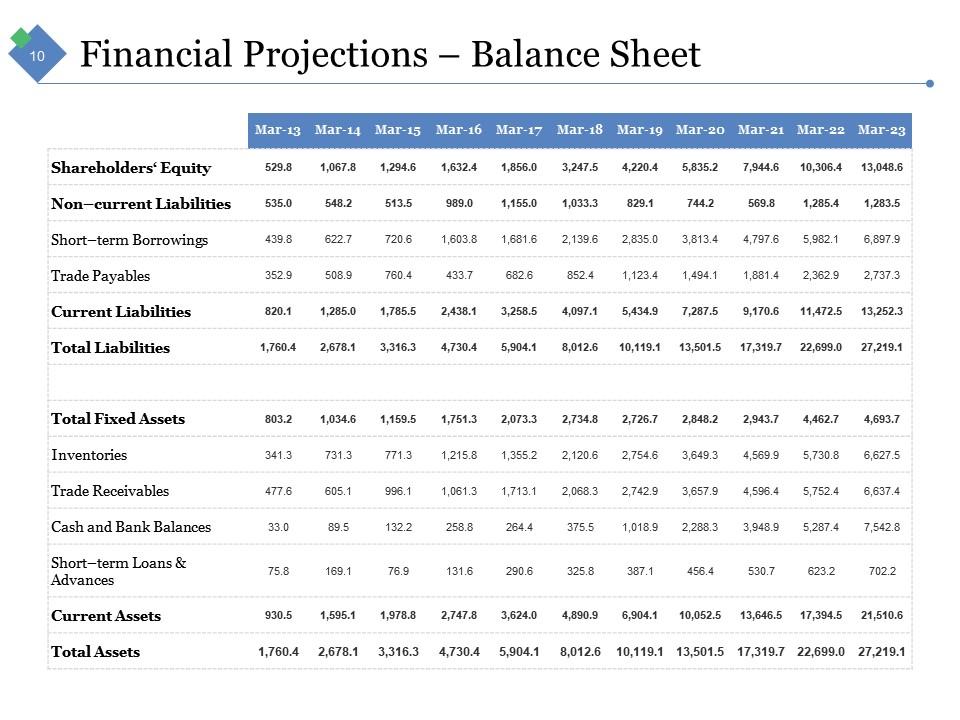
Slide 10: This slide shows Financial Projections – Balance Sheet.
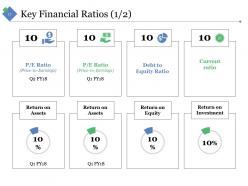
Slide 11: This is Key Financial Ratios (1/2) slide showing- Return on Equity, Return on Investment, P/E Ratio (Price-to-Earnings), Debt to Equity Ratio, Current ratio.
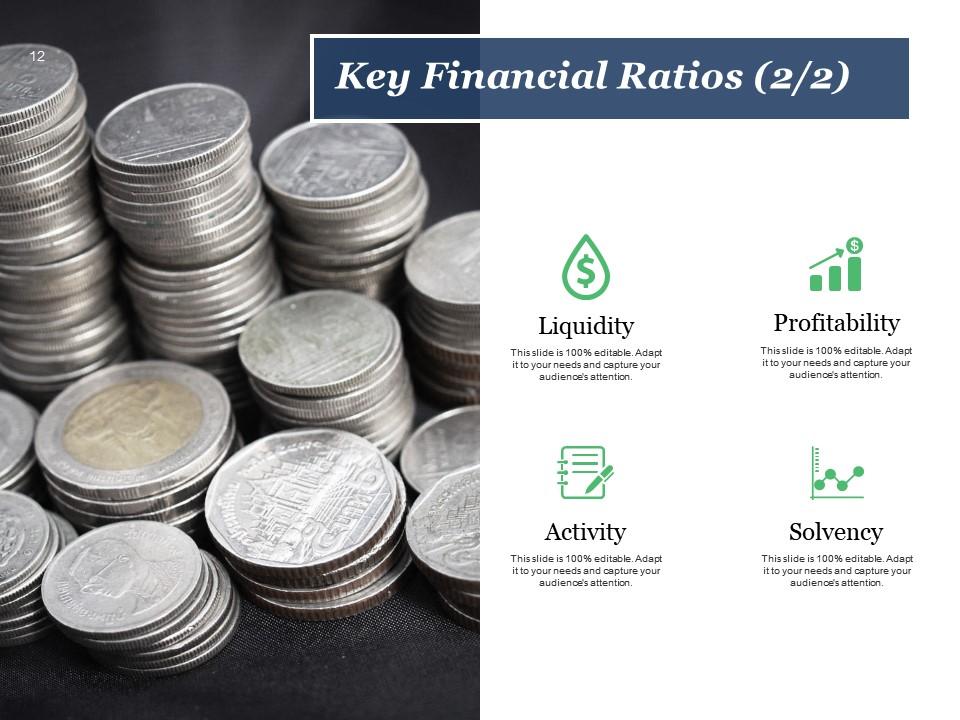
Slide 12: This slide also shows Key Financial Ratios (2/2) such as- Liquidity Profitability Solvency Activity
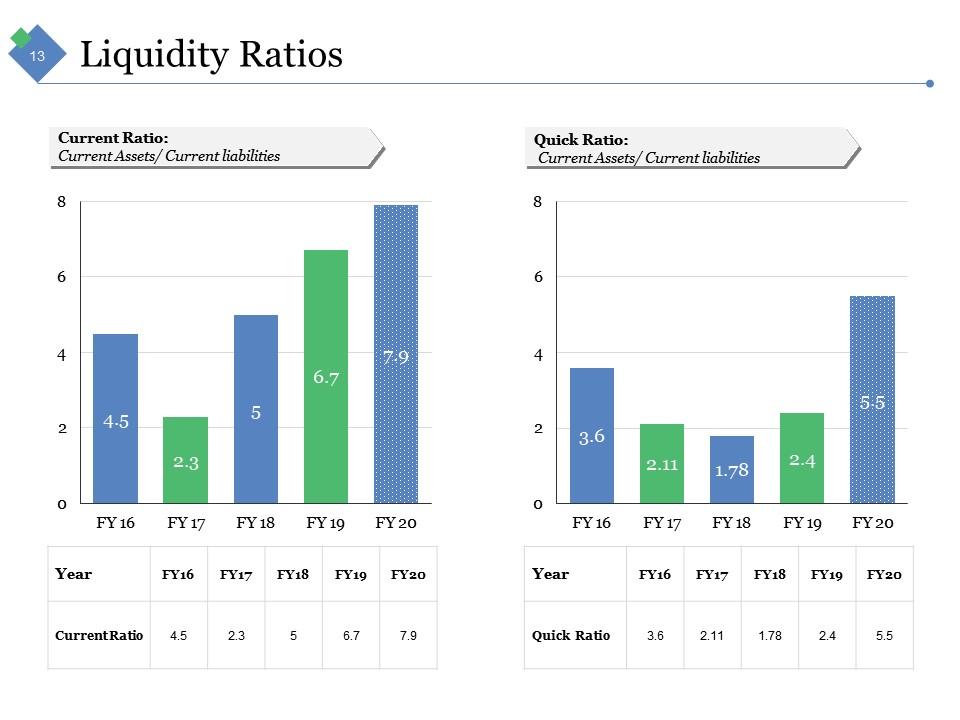
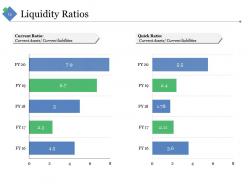
Slide 13: This slide shows Liquidity Ratios such as- Current Ratio: Current Assets/ Current liabilities, Quick Ratio: Current Assets/ Current liabilities.
Slide 14: This is another slide showing Liquidity Ratios presented in a graphical form
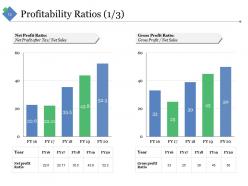
Slide 15: This slide shows Profitability Ratios (1/3)- Net Profit Ratio: Net Profit after Tax/ Net Sales, Gross Profit Ratio: Gross Profit / Net Sales.
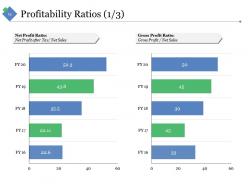
Slide 16: This slide also shows Profitability Ratios (1/3).
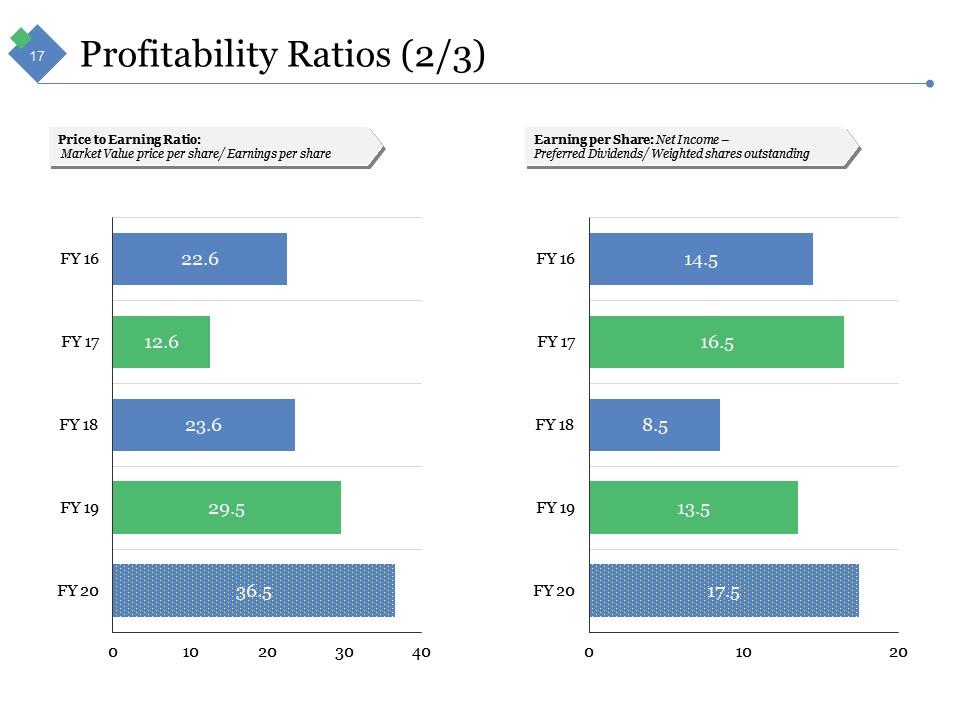
Slide 17: This too is Profitability Ratios (2/3) slide.
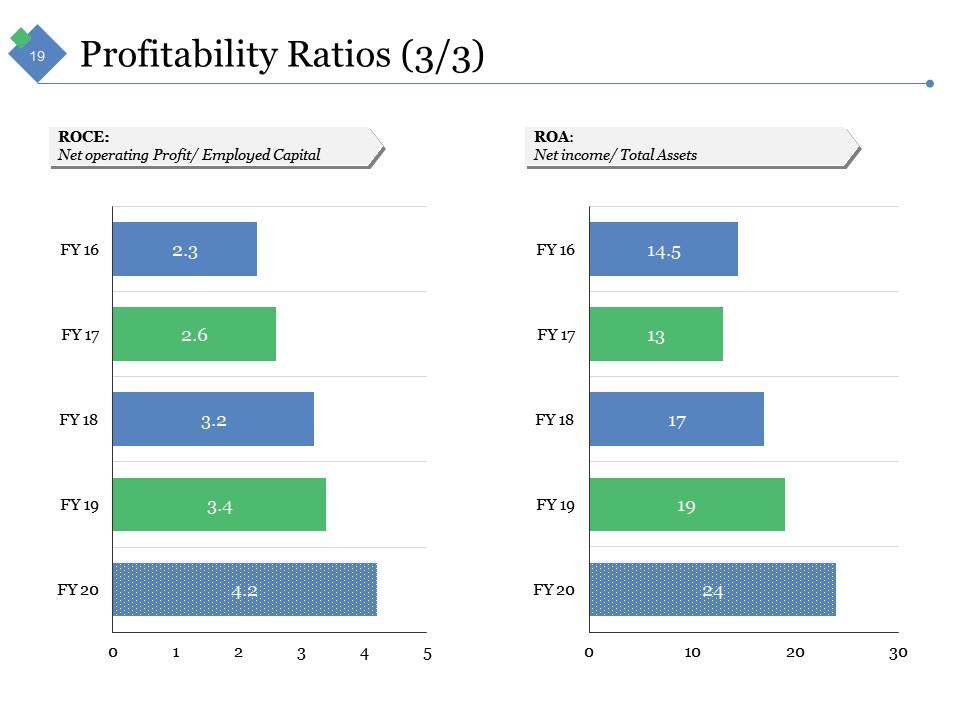
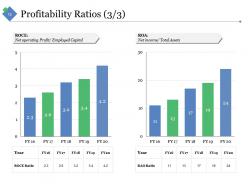
Slide 18: This is another slide showing Profitability Ratios (3/3) such as- ROCE: Net operating Profit/ Employed Capital, ROA: Net income/ Total Assets.
Slide 19: This slide also presents Profitability Ratios (3/3) in a garphical form.
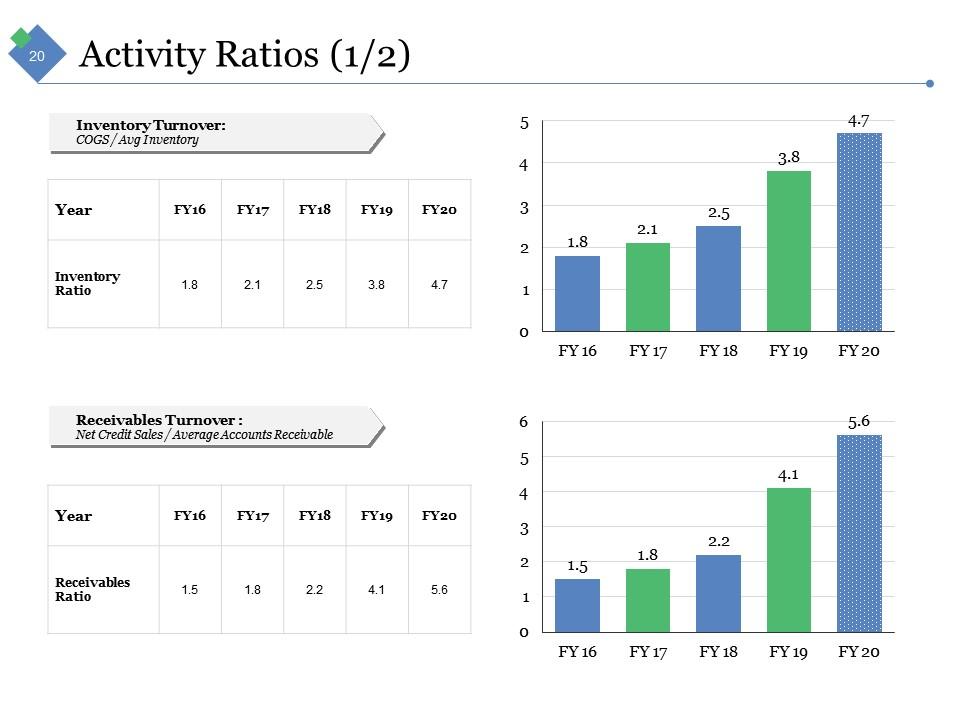
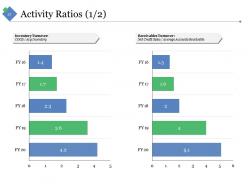
Slide 20: This slide shows Activity Ratios (1/2) such as- Inventory Turnover: COGS / Avg Inventory, Receivables Turnover : Net Credit Sales / Average Accounts Receivable.
Slide 21: This slide also shows Activity Ratios (1/2) graph.
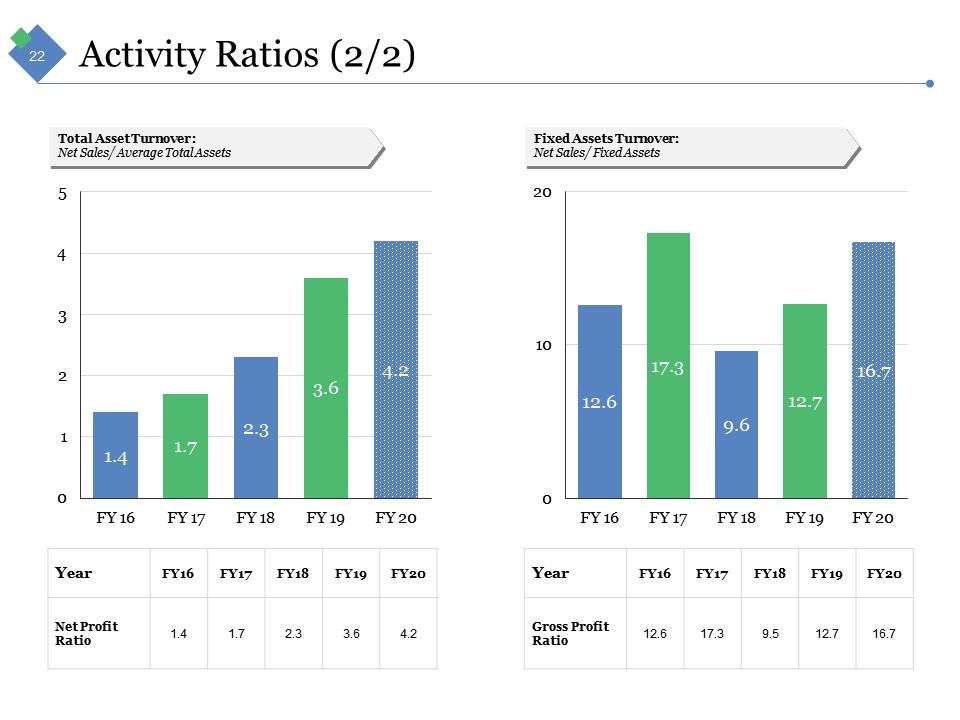
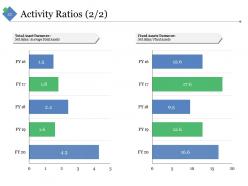
Slide 22: This is another slide showing Activity Ratios (2/2) further showing- Total Asset Turnover : Net Sales/ Average Total Assets, Fixed Assets Turnover: Net Sales/ Fixed Assets.
Slide 23: This too is an Activity Ratios (2/2) slide showing- Total Asset Turnover : Net Sales/ Average Total Assets, Fixed Assets Turnover: Net Sales/ Fixed Assets.
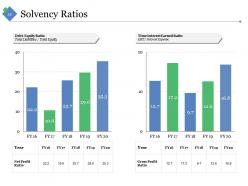
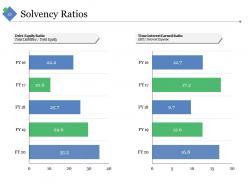
Slide 24: This sldie shows Solvency Ratios with- Debt-Equity Ratio: Total Liabilities / Total Equity, Time Interest Earned Ratio: EBIT/ Interest Expense.
Slide 25: This slide also shows Solvency Ratios with-Debt-Equity Ratio:Total Liabilities / Total Equity, Time Interest Earned Ratio: EBIT/ Interest Expense.
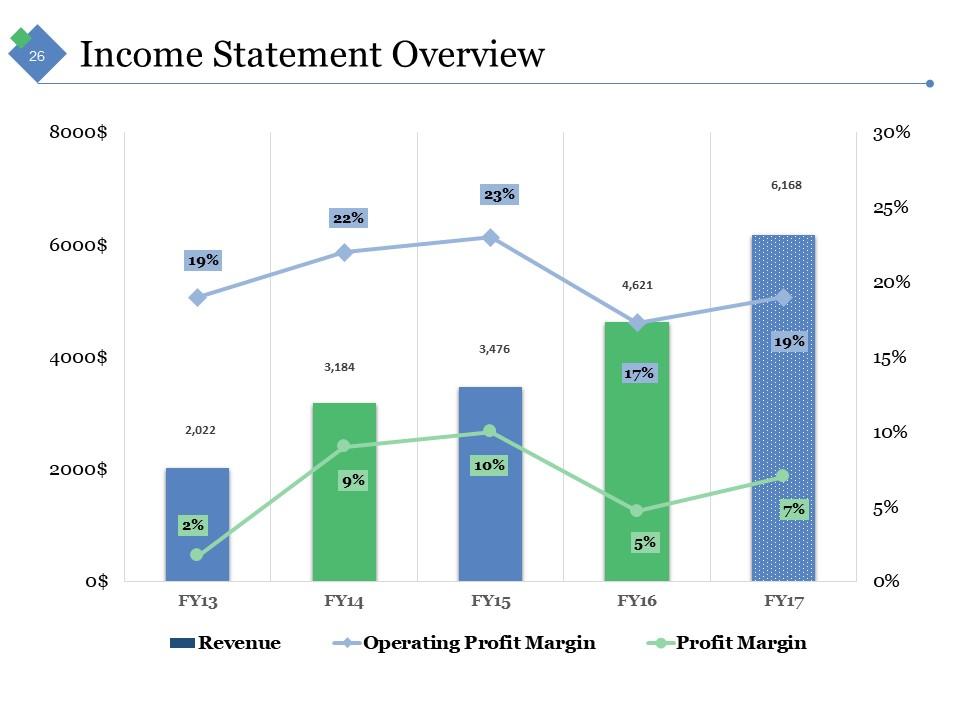
Slide 26: This slide shows Income Statement Overview graphically.
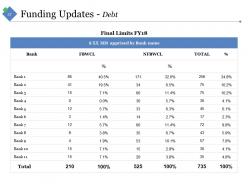
Slide 27: This slide shows Funding Updates - Debt table.
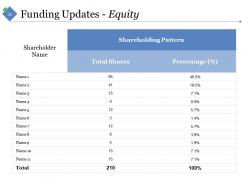
Slide 28: This slide shows Funding Updates - Equity table.
Slide 29: This is a Coffee Break slide to halt. You may alter/ modify the content as per need.
Slide 30: This slide forwards to Our Charts And Graphs. You may alter/ modify the content as per need.
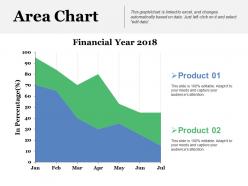
Slide 31: This is an Area Chart slide to show product/ entity growth, comparison, specifications etc.
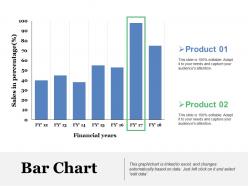
Slide 32: This is a Bar Chart slide to show product/ entity growth, comparison, specifications etc.
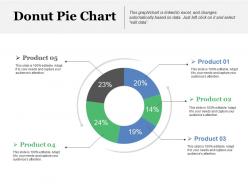
Slide 33: This is a Donut Pie Chart slide to present product/ entity comparison, specifications etc.
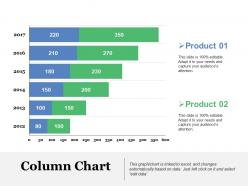
Slide 34: This is a Column Chart slide to present product/ entity comparison, specifications etc.
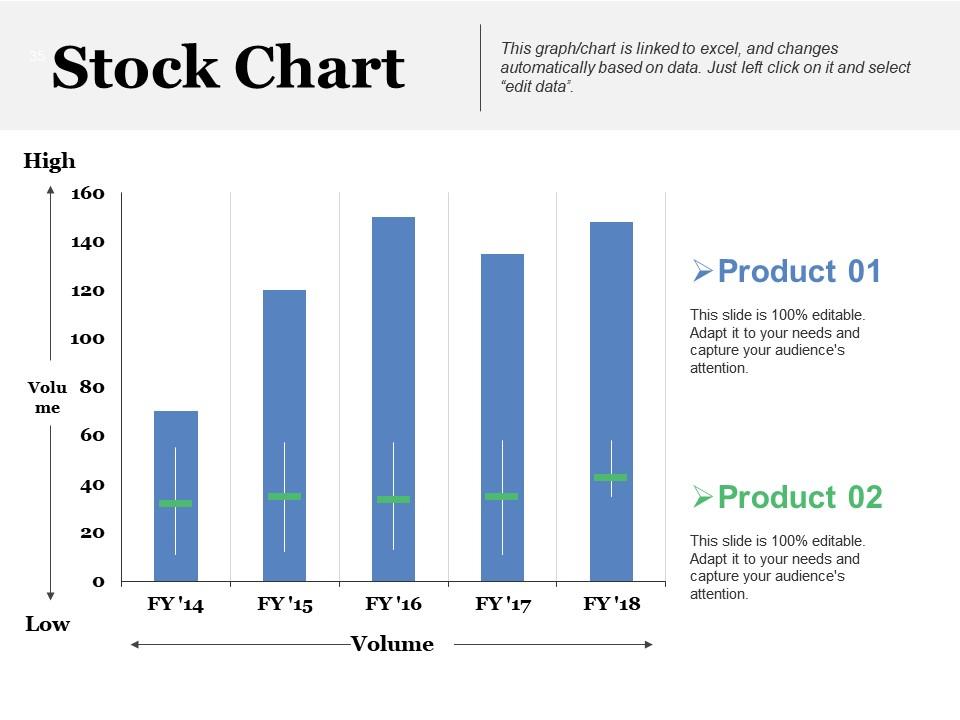
Slide 35: This is a Stock Chart to present product/ entity comparison, specifications etc.
Slide 36: This slide is titled Additional Slides. You can change the slide content as per your needs.
Slide 37: This is Our Mission slide to state your mission and vision.
Slide 38: This is an Our Team slide with name, image and text boxes to put the required information.
Slide 39: This is an About Us slide. State company or team specifications here.
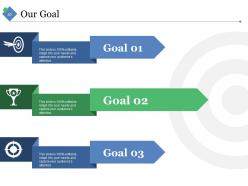
Slide 40: This is Our Goal slide. State your important goals here.
Slide 41: This slide shows Comparison between two entities- Man and Woman.
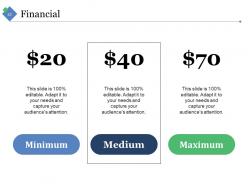
Slide 42: This is Financial slide to state financial aspects etc.
Slide 43: This is a Business Quotes slide to quote something you believe in.
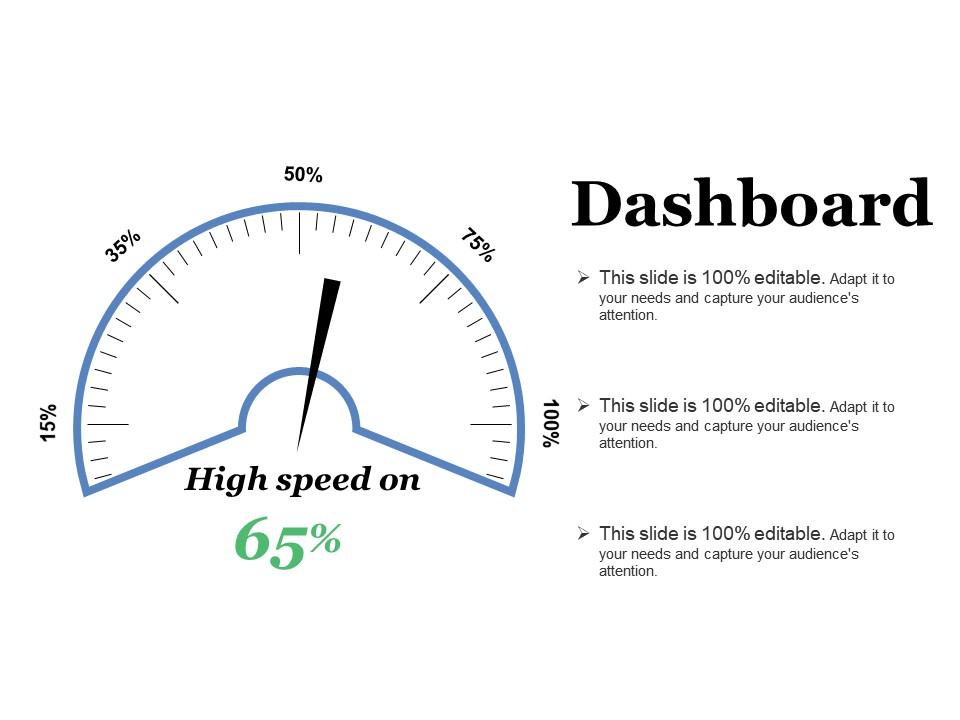
Slide 44: This slide displays a Dashboard with metric imagery. You can present kpis, metrics etc. here.
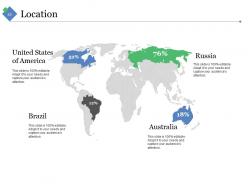
Slide 45: This is Location slide to show global growth, presence on a world map image.
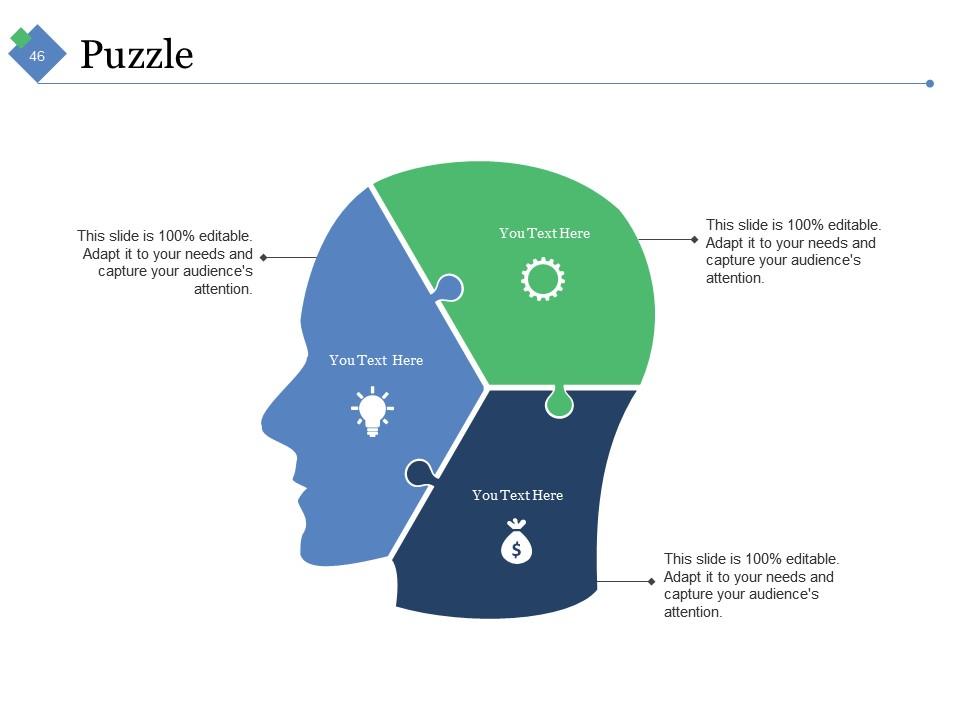
Slide 46: This is a Puzzle pieces image slide to show information, specifications etc.
Slide 47: This slide presents a Timeline to show growth, milestones etc.
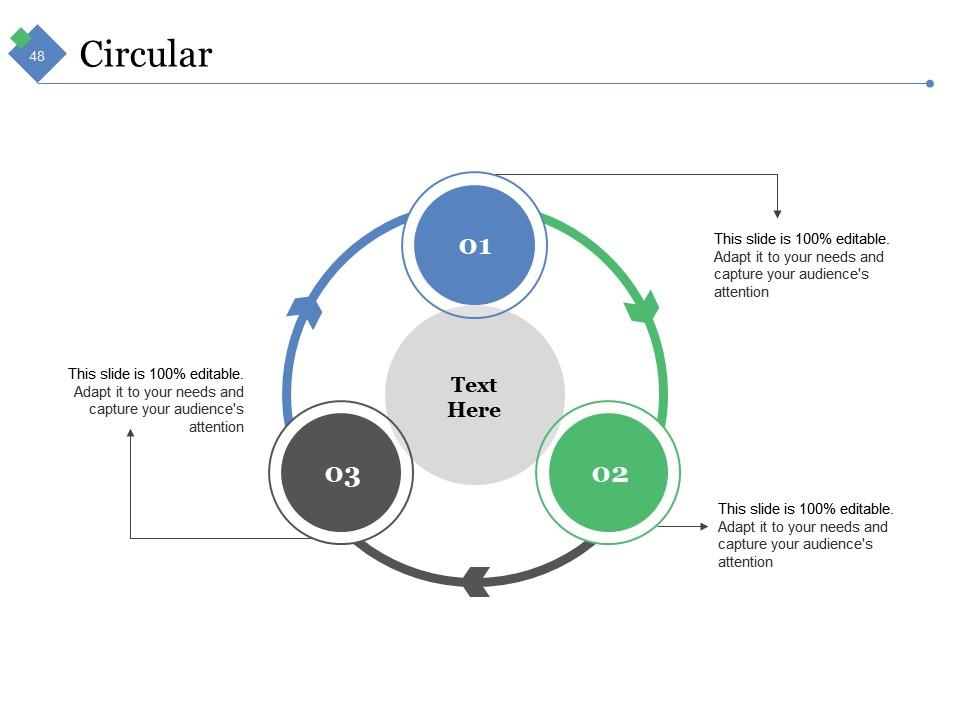
Slide 48: This is a Circular image slide to show information etc.
Slide 49: This is a Target slide. State your targets here.
Slide 50: This slide presents Mind Map imagery with text boxes.
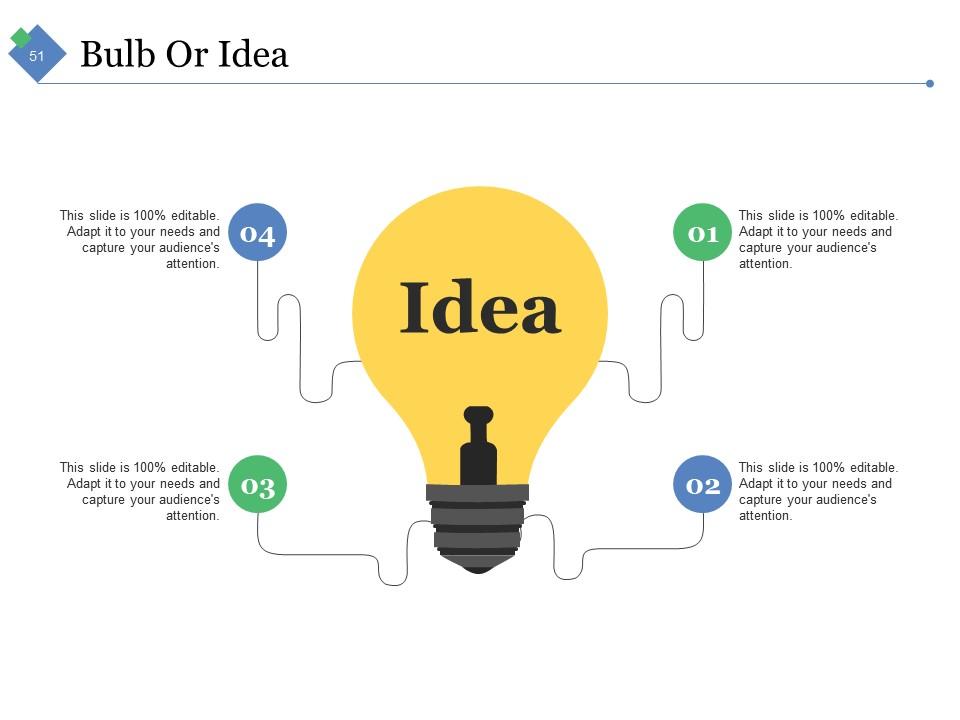
Slide 51: This is a Bulb or Idea image slide to show information, ideas, specifications etc.
Slide 52: This slide shows a Magnifying Glass with imagery and text boxes to go with.
Slide 53: This is a Thank You slide with Address# street number, city, state, Contact Numbers, Email Address.
Sample Financial Analysis Report Manufacturing Powerpoint Presentation Slides with all 53 slides:
Folks find focus with our Sample Financial Analysis Report Manufacturing Powerpoint Presentation Slides. They encourage a feeling of creativity.
-
Innovative and Colorful designs.
-
Attractive design and informative presentation.


