Risk assessment powerpoint presentation slides
Identify risks and hazards that have the potential to harm any process or project. Use content-ready Risk Assessment PowerPoint Presentation Slides to analyse what can go wrong, how likely it is to happen, what potential consequences are, and how tolerable the identified is. With the help of ready-made risk assessment PowerPoint presentation slideshow, use control measures to eliminate or reduce any potential risk related situation. This deck comprises of various templates to control risks such as types of risks, risk categories, identify the risk categories, stakeholder engagement, stakeholders risk appetite, risk tolerance, procedure, risk management plan, risk register, risk identification, risk assessment, risk analysis, risk response plan, risk response matrix, risk control matrix, risk item tracking, risk impact and probability analysis, risk mitigation strategies, qualitative risk analysis, quantitative risk analysis, risk management process, risk management steps, and more. These templates are completely customizable. You can easily edit the color, text, icon and font size as per your need. Add or remove content, if needed. Grab this easy-to-understand risk assessment PowerPoint templates to figure out what could cause harm to the project, whether the hazards could be eliminated or not, what preventive measures should be taken to control the risks. Download risk assessment PPT slides now to execute the project easily. Behave in a down to earth fashion with our Risk Assessment Powerpoint Presentation Slides. Give them a glimpse of your fact based approach.
You must be logged in to download this presentation.
 Impress your
 audience
Editable
of Time
PowerPoint presentation slides
Presenting risk assessment PowerPoint deck with slides. This complete presentation comprises of total of 57 PPT slides. It covers all the aspects of the topic and includes all the major elements such as graphs and charts to make the work easy. This presentation has been crafted with an extensive research done by the research experts. Our PowerPoint professionals have incorporated appropriate diagrams, layouts, templates and icons related to the topic. The best part is that these templates are completely editable. Customize the colour, text and icon as per your need. Click the download button below to grab this risk assessment presentation deck.
People who downloaded this PowerPoint presentation also viewed the following :
Content of this Powerpoint Presentation
Slide 1: This slide introduces Risk Assessment. State Your Company Name and get started.
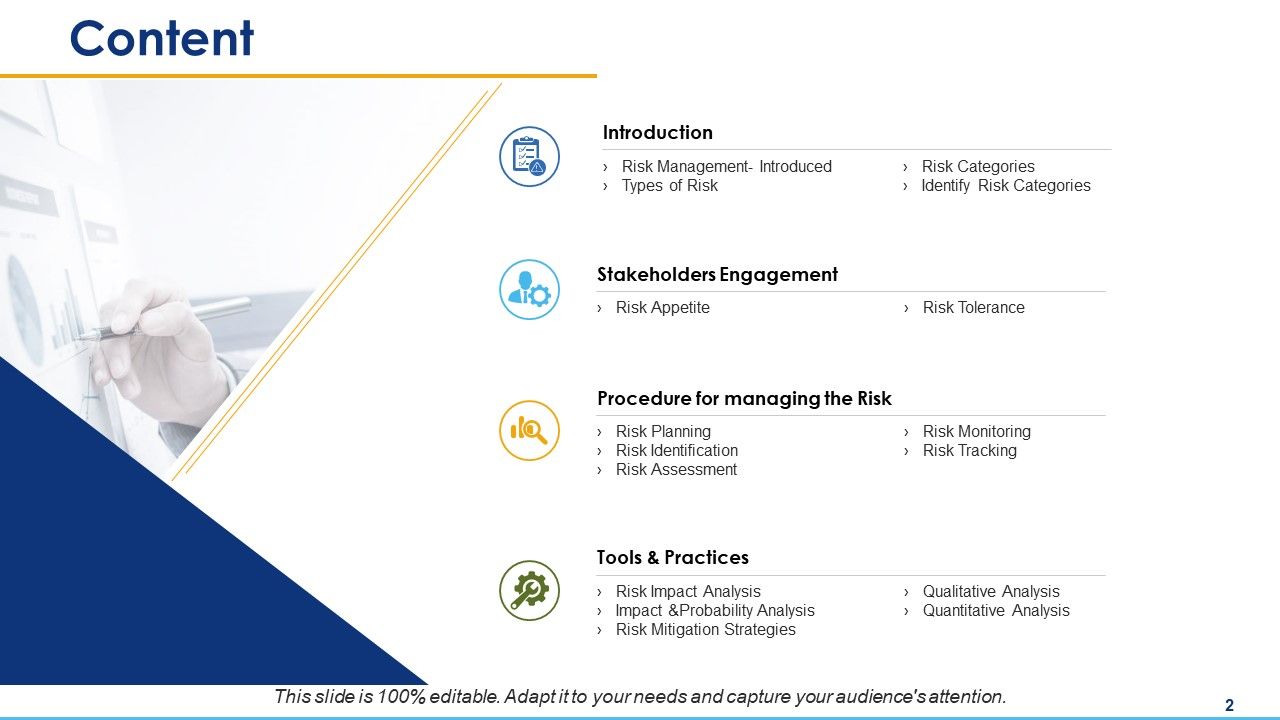
Slide 2: This slide presents Content showcasing- Introduction: Risk Management- Introduced, Types of Risk, Risk Categories, Identify Risk Categories. Procedure for managing the Risk: Risk Planning, Risk Identification, Risk Assessment, Risk Monitoring, Risk Tracking. Stakeholders Engagement: Risk Appetite, Risk Tolerance. Tools & Practices: Risk Impact Analysis, Impact &Probability Analysis, Risk Mitigation Strategies, Qualitative Analysis, Quantitative Analysis.
Slide 3: This slide presents Introduction showcasing- Risk Management- Introduction, Types of Risk, Risk Categories, Identify Risk Categories.
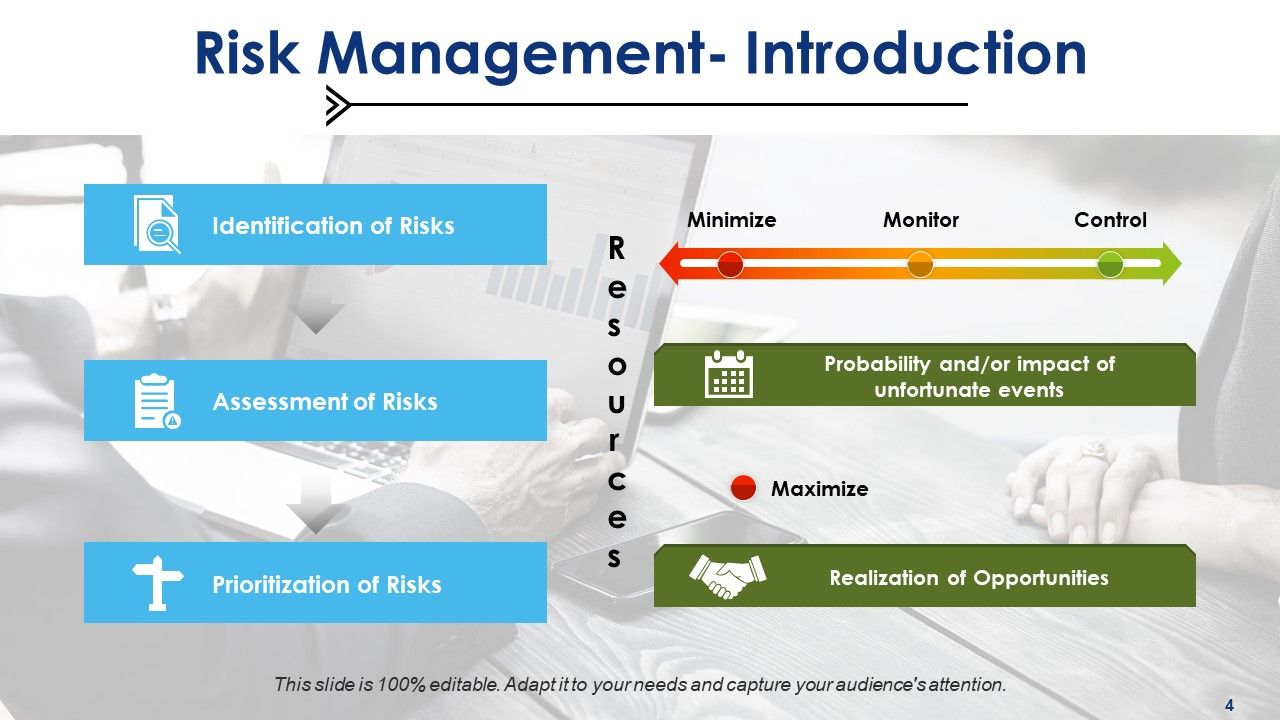
Slide 4: This slide shows Risk Management- Introduction displaying- Resources, Assessment of Risks, Identification of Risks, Prioritization of Risks, Realization of Opportunities, Probability and/or impact of unfortunate events.
Slide 5: This slide showcases Types of Risks- Internal Risks divdided into Strategic: Governance, Strategic Planning, Ethics & Values, Stakeholder Relations. Operational: Access to Services, Processes, Business Interruption, Emergency Response. Enablers: People, Financial, Technology, Infrastructure. External Risks: Demand, Regulatory, Economical, Socio- Political, Environment.
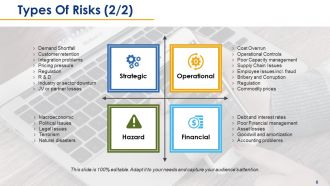
Slide 6: This slide shows Types Of Risks in matrix form with the subheadings- Operational: Cost Overrun, Operational Controls, Poor Capacity management, Supply Chain Issues, Employee Issues incl. fraud, Bribery and Corruption, Regulation, Commodity prices. Strategic: Demand Shortfall, Customer retention, Integration problems, Pricing pressure, Regulation, R & D, Industry or sector downturn, JV or partner losses. Financial: Debt and interest rates, Poor Financial management, Asset losses, Goodwill and amortization, Accounting problems. Hazard: Macroeconomic, Political Issues, Legal Issues, Terrorism, Natural disasters.
Slide 7: This slide shows Risk Categories with the following subheadings- Product Design: Product Performance, Design. System/ Software: Data Accuracy, Security. Manufacturing: Assembly, Tools. All Other: Consumer service, Environment. Project Management: Team work, Product cost. Quality: Quality system, Sigma Levels.
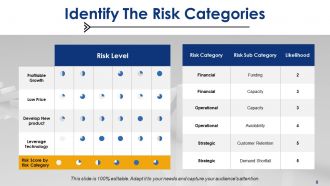
Slide 8: This slide displays Identify The Risk Categories with- Risk Score by Risk Category.
Slide 9: This slide shows Stakeholder Engagement with- Stakeholders Risk Appetite, Risk Tolerance.
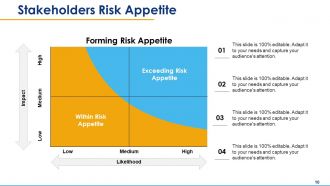
Slide 10: This slide shows Stakeholders Risk Appetite matrix showing Forming Risk Appetite in terms of impact and likelihood.
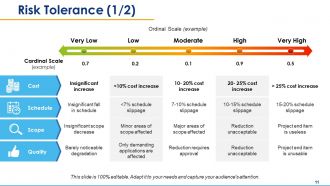
Slide 11: This slide shows Risk Tolerance table with Cost, Schedule, Scope, and Quality as subheadings in terms of ordinal scale of- Very Low, Very High, Low, Moderate, High.
Slide 12: This slide shows a Risk Tolerance Bubble graph showing- Business Continuity Problems, Supplier Default, Loss Of Key Partnerships, IT Problems, Poor Project Management, Product Or Service Quality, Loss Of Key Managers.
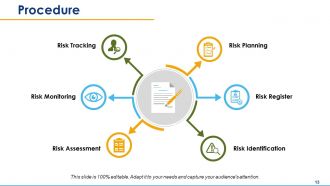
Slide 13: This slide shows Procedure displaying- Risk Planning, Risk Register, Risk Identification, Risk Tracking, Risk Monitoring, Risk Assessment.
Slide 14: This slide showcases Risk Management Plan in tabular form showing- Type Of Risk, Outcome, Existing Risk Treatment Actions In Place, Rating, Additional Resources, Target Date, Person Responsible, Proposed Risk Treatment Actions To Mitigate Risk.
Slide 15: This slide shows Risk Register showcasing- Type Of Risk, Description Of Risk, Risk Reduction Strategy, Contingency Plans, Risk Owner, Probability, Impact.
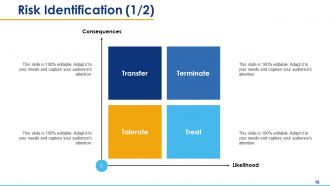
Slide 16: This slide presents a Risk Identification matrix showing- Terminate, Treat, Tolerate, Transfer in terms of Consequences & Likelihood.
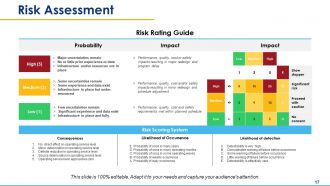
Slide 17: This slide shows Risk Assessment with Risk Rating Guide displaying- Impact: Performance, quality, cost or safety impacts resulting in major redesign and program delay, Performance, quality, cost and/or safety impacts resulting in minor redesign and schedule adjustment, Performance, quality, cost and safety requirements met within planned schedule. Probability: Major uncertainties remain, No or little prior experience or data, Infrastructure and/or resources not in place, Some uncertainties remain, Some experience and data exist, Infrastructure in place but under-resourced, Few uncertainties remain, Significant experience and data exist, Infrastructure in place and fully, and Likelihood of Occurrence: E. Probability of once in many years D. Probability of once in many operating months C. Probability of once in some operating weeks B. Probability of weekly occurrence A. Probability of daily occurrence Likelihood of detection: Detectability is very high, Considerable warning of failure before occurrence, Some warning of failure before occurrence, Little warning of failure before occurrence, Detectability is effectively zero Consequences: No. direct effect on operating service level, Minor deterioration in operating service level, Definite reduction in operating service level, Source deterioration in operating service level, Operating service level approaches zero. as Risk Scoring System.
Slide 18: This slide shows Risk Assessment with Risk Scoring Results table in terms of- Insignificant, Minor, Moderate, Major, Catastrophic, Consequences, Likelihood. A. Almost Certain, B. Likely, C. Possible, D. Unlikely, E. Rare.
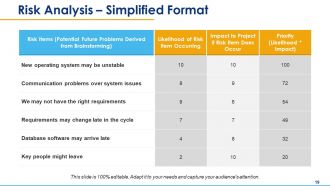
Slide 19: This slide presents Risk Analysis – Simplified Format in tabular form showing- New operating system may be unstable, Communication problems over system issues, We may not have the right requirements, Requirements may change late in the cycle, Database software may arrive late, Key people might leave, Likelihood of Risk Item Occurring, Impact to Project if Risk Item Does Occur, Priority (Likelihood * Impact) as Risk Items (Potential Future Problems Derived from Brainstorming).
Slide 20: This slide Risk Analysis- Complex showcasing- Description of Risk, Risk Analysis, Risk Rating, Control Measures, (Detail any existing Controls), Risk Rating, Risk Analysis(with additional controls), Additional Control, (Detail additional to be implemented Controls).
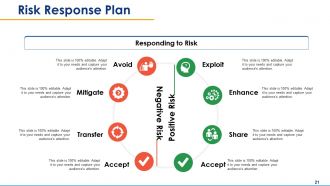
Slide 21: This slide shows Risk Response Plan showcasing- Responding to Risk consisting of- Mitigate, Avoid, Transfer, Accept, Exploit, Enhance, Share, Accept, Negative Risk, Positive Risk.
Slide 22: This slide shows Risk Response Matrix displaying- Interface Problems, User Backlash, System Freezing, Hardware Malfunctioning, Risk Event, Response, Contingency Plan, Trigger, Who is responsible.
Slide 23: This slide shows a Risk Response Matrix displaying- Avoid: Design Changes Different Site Conditions Labor Productivity Unrealistic Schedule Transfer, Retain: Weather Delays, Defective Work, Equipment Failure, Labor dispute / Strike.
Slide 24: This slide shows Risk Control Matrix.
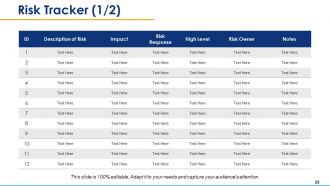
Slide 25: This slide shows Risk Tracker in tabular form.
Slide 26: This slide shows Risk Item Tracking with- Risk Items, Risk Resolution, Monthly Ranking.
Slide 27: This slide shows Tools & Practices with the following subheadings- Quantitative Analysis, Qualitative Analysis, Risk Mitigation Strategies, Probability & Impact Assessment, Risk Impact Analysis.
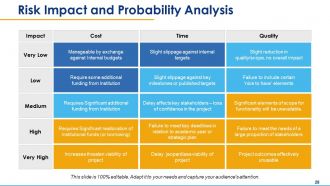
Slide 28: This slide shows Risk Impact and Probability Analysis showcasing- Cost: Manageable by exchange against Internal budgets, Increases threaten viability of project, Require some additional funding from Institution, Requires Significant additional funding from Institution, Requires Significant reallocation of Institutional funds (or borrowing). Time: Slight slippage against internal targets, Delay jeopardises viability of project, Slight slippage against key milestones or published targets, Deley affects key stakeholders – loss of confidence in the project, Failure to meet key deadlines in relation to academic year or strategic plan. Quality: Slight reduction in quality/scope, no overall impact, Project outcomes effectively unusable, Failure to include certain ‘nice to have’ elements, Significant elements of scope for functionality will be unavailable, Failure to meet the needs of a large proportion of stakeholders with Impact Scale.
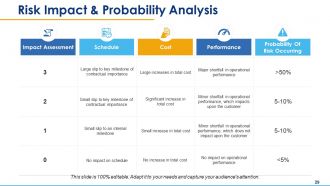
Slide 29: This slide presents Risk Impact & Probability Analysis with- Performance, Probability Of Risk Occurring, Schedule, Impact Assessment, Cost.
Slide 30: This slide shows Risk Mitigation Strategies showcasing- Technical Risks, Cost Risks, Schedule Risks.
Slide 31: This slide presents Risk Mitigation Plan with- Category, Identified Risk, Mitigation Plan.
Slide 32: This slide presents Qualitative Risk Analysis table.
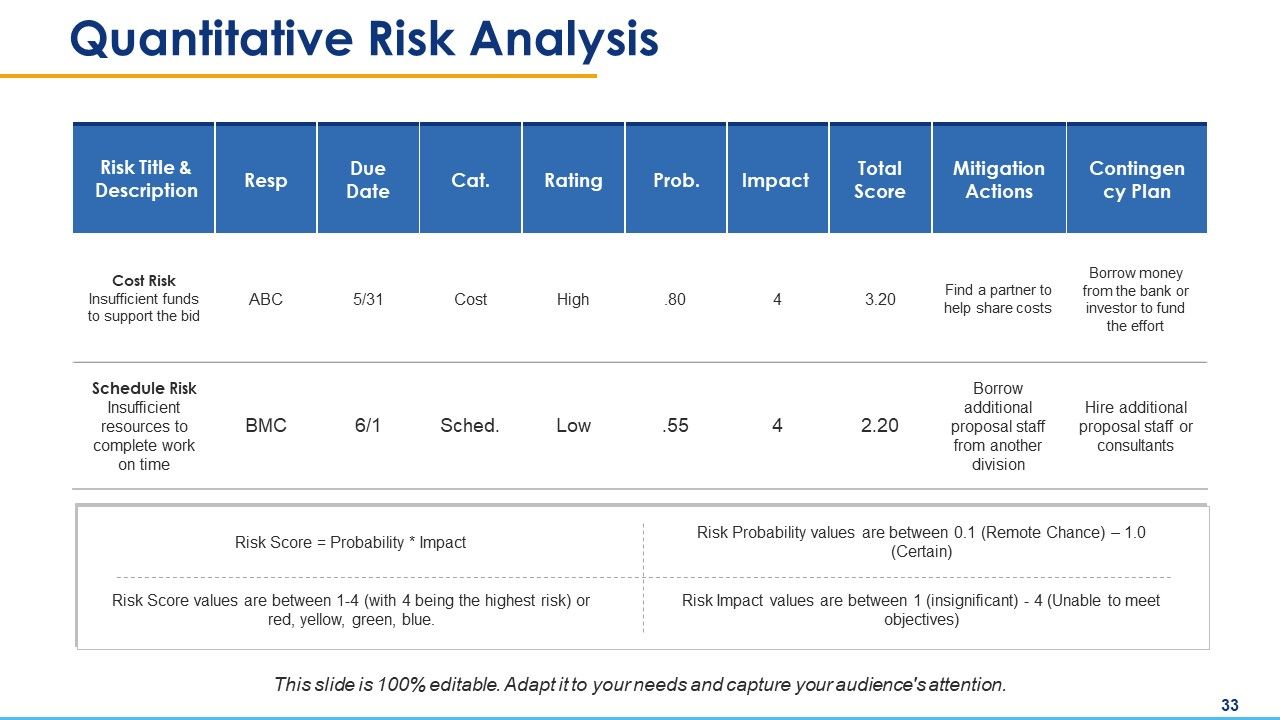
Slide 33: This slide presents Quantitative Risk Analysis table.
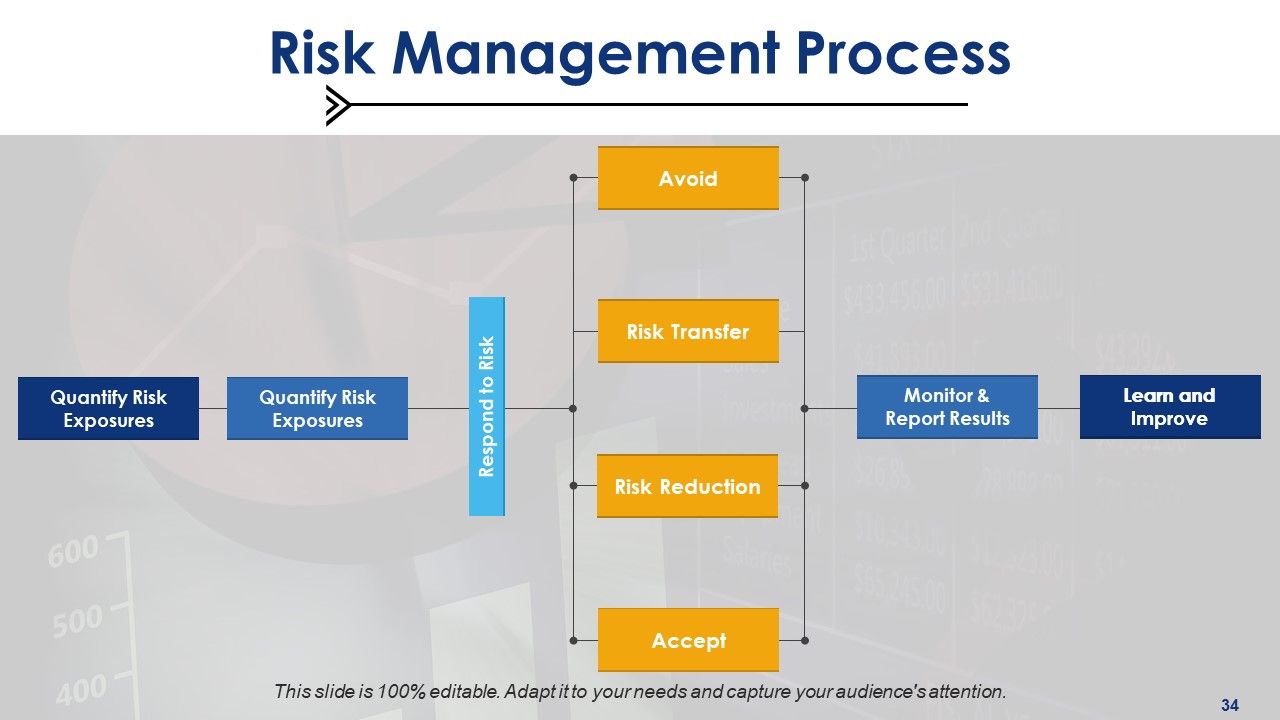
Slide 34: This slide shows Risk Management Process dispalying- Identify Risk Exposures, Respond to Risk, Avoid, Accept, Monitor & Report Results, Quantify Risk Exposures, Learn and Improve, Learn and Improve, Quantify Risk Exposures, Risk Transfer, Risk Reduction.
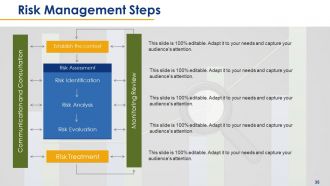
Slide 35: This slide displays Risk Management Steps- Establish the context, Risk Assessment, Risk Identification, Risk Analysis, Risk Evaluation, Risk Treatment, Communication and Consultation, Monitoring Review.
Slide 36: This is a Risk Assessment Icon Slide. You can use the icons as per need.
Slide 37: This is a Coffee break image slide to halt. You can change the slide content as per need.
Slide 38: This slide is titled Additional Slides to move forward. You can alter the slide content as per need.
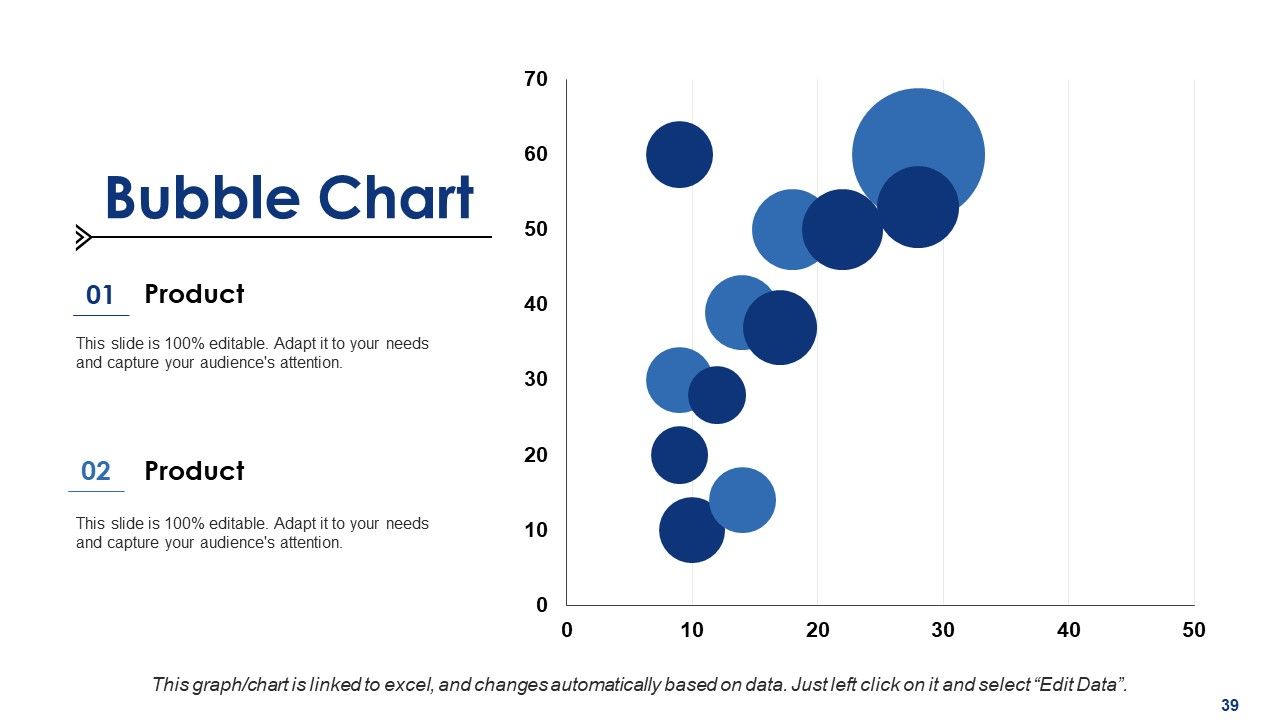
Slide 39: This is a Bubble chart slide. State specifications, comparison of products/entities here.
Slide 40: This is a Column chart slide. State specifications, comparison of products/entities here.
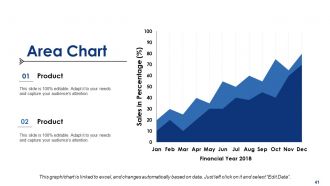
Slide 41: This is an Area chart slide. State specifications, comparison of products/entities here.
Slide 42: This is Our Mission slide with Vision, Mission and Goal. State them here.
Slide 43: This is Our Team slide to state team specifications, information, structure etc.
Slide 44: This is a Financial score slide. State financial aspects, information etc. here.
Slide 45: This is an About Us slide. State company specifications here.
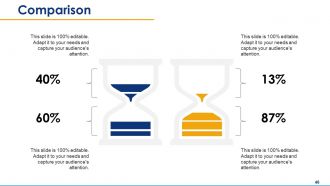
Slide 46: This is a Comparison slide in a creative sand glass imagery form to compare two entities etc.
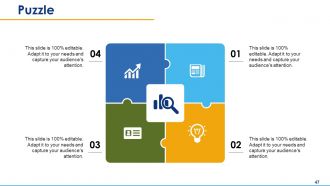
Slide 47: This is a Puzzle image slide. State information, specifications etc. here.
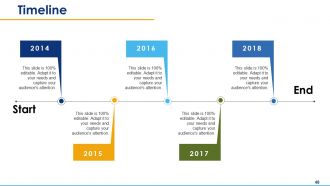
Slide 48: This is a Timeline slide. State milestones, highlights etc. here.
Slide 49: This is a Target image slide. State targets, information, specifications etc. here.
Slide 50: This is a Location slide of world map image to show global presence, growth etc.
Slide 51: This is a Venn diagram image slide. State information, specifications etc. here.
Slide 52: This is a Post It Notes slide to mark reminders, events or anything important.
Slide 53: This is a Silhouettes image slide. State people related information, specifications etc. here.
Slide 54: This is a Lego image slide. State information, specifications etc. here.
Slide 55: This is a Bulb or Idea image slide to state information, specifications etc.
Slide 56: This is a Magnifying Glass image slide to show information, specifications etc.
Slide 57: This is a Thank You slide with Address# street number, city, state, Contact Number, Email Address.
Risk assessment powerpoint presentation slides with all 57 slides:
Inch ahead consistently with our Risk Assessment Powerpoint Presentation Slides. Continue to build on the initial advantage.
-
Very well designed and informative templates.
-
Best Representation of topics, really appreciable.


