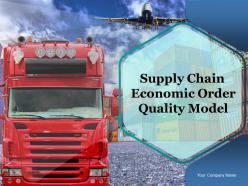
Supply Chain Economic Order Quantity Model Powerpoint Presentation Slides
Are you working hard to create a professional presentation on the concept of supply chain and economic order? Do not worry! SlideTeam has come up with the content ready supply chain economic order quantity model PowerPoint presentation slides. Using this supply chain management PPT presentation, you can represent the flow of goods and products. This demand chain management presentation PPT covers a slide on relevant sub-topics such as inventory management, economic order quantity model, EOQ model cost curves, EOQ cost model, and essential characteristics of EOQ cost function. Using these supplier relationship management presentation slides, you can explain the concept of customer relationship management, customer service management, demand-management style, order fulfillment, manufacturing flow management, supplier relationship management, product development, and commercialization, returns management, production planning, operation management, quality management, and enterprise resource planning. Utilize this PowerPoint presentation; you can throw the light on the supply chain activities such as design, planning, implementation, control, and monitoring. Our graphics designers have used visuals and illustrations of charts and graphs so that you can easily describe products selling statistics. So, do not delay, download this supply chain economic order quantity framework presentation PPT. Your ideas begin to assume a definite form due to our Supply Chain Economic Order Quantity Model Powerpoint Presentation Slides. It ensures that they jell.
You must be logged in to download this presentation.
 Impress your
 audience
Editable
of Time
PowerPoint presentation slides
Presenting supply chain economic order quantity model PowerPoint presentation slides. This presentation includes 25 professionally prepared PowerPoint templates, all of them being 100 percent changeable in PowerPoint. Content fonts dimension and type, colors and slide background of the PPT slides are modifiable. You can download the presentation templates in both wide screen (16:9) and standard view (4:3) aspect dimension. The PPT slides are fully adaptable with Google Slides and other online applications. PPT templates can be saved in any of the formats such as JPG or PDF. You can personalize the PowerPoint slides by inserting an organization name, trademark, copyright, or logo. Premium product support is provided.
People who downloaded this PowerPoint presentation also viewed the following :
Content of this Powerpoint Presentation
Slide 1: This slide showcases Supply Chain Economic Order Quality Model. You can add Your Company Name and begins.
Slide 2: This slide shows Inventory Management. You can use this as per your requirement or add your informaton- Customers, Manufactures, Warehouse, Distributors, Wholesalers.
Slide 3: This slide showcase Economic Order Quantity (EOQ) Model with an graphical representation and two main parameters- Reorder Point, Order Quantity.
Slide 4: This slide presents The EOQ Model Cost Curves. You can add as per your requirement.
Slide 5: This slide displays EOQ Cost Model. Use this as per requirement.
Slide 6: This slide presents Important Characteristics Of The EOQ Cost Function. You can add according to your requirement.
Slide 8: This slide include Supply Chain Economic Order Quantity Model.
Slide 9: This is a Coffee Break slide to halt. You may change it as per requirement.
Slide 10: This slide is titled Charts & Graphs to move forward.
Slide 11: This is a Column Chart slide for product/entity comparison.
Slide 12: This is a Line Chart slide for product/entity comparison.
Slide 13: This slide displays a Stock Chart with volume as parameter in terms of high and low, open and close.
Slide 14: This slide is titled Additional slides to proceed forward.
Slide 15: This is Our mission slide with imagery and text boxes to go with.
Slide 16: This is an About us slide to state company specifications etc.
Slide 17: This is an Our Team slide with name, image&text boxes to put the required
Slide 18: This is a Puzzle image slide to show information, specification etc.
Slide 19: This slide shows Our Goals for your company.
Slide 20: :This slide shows another varaition of Financial Projection Graph.
Slide 21: This is a Target slide. State your targets here.
Slide 22: This is a Venn diagram image slide to show information, specifications etc.
Slide 23: This is a LEGO slide with text boxes to show information.
Slide 24: This is a Bulb or Idea slide to state a new idea or highlight specifications/information etc.
Slide 25: This is a Thank You slide with Address# street number, city, state, Contact
Supply Chain Economic Order Quantity Model Powerpoint Presentation Slides with all 25 slides:
Ignite ambitions with our Supply Chain Economic Order Quantity Model Powerpoint Presentation Slides. Arouse that fire in their bellies.
-
Content of slide is easy to understand and edit.
-
Helpful product design for delivering presentation.


