Investor Relations Profile Powerpoint Presentation Slides
Need to present IR PPT presentation? Look no further as our team of expert designers have made content-ready 62 slides Investor Relations Profile Powerpoint Presentation Slides. Our investor profile PowerPoint presentation slides is all that you need. These professionally designed PPT sample presentation file will help you in showcasing numerous topics like company investor update, business model, annual run rate, revenue model, monthly recurring churn, investment deals, production cost, investor scorecard, competitive analysis, market dynamics and budget, value chain, and many more. The best part is that this whole IR PowerPoint sample slides are fully editable. And downloading this PowerPoint sample file will get you exclusive slides like operating excellence, financial highlights, sales performance and revenue dashboards, investment timeline, capital spending graph, distribution growth, adjusted ROCE etc. You can use our IR PPT guide for various topics like angel funding, corporate investment, fundraising, crowdfunding, seed capital, private investment etc. Hurry up! Download Investor Relations Profile Powerpoint Presentation Slides and set yourself on the correct path. Leave a lasting impression on angel investors and target audience. with our professional PowerPoint deck sample file. Force folks to have a gaze with our Investor Relations Profile Powerpoint Presentation Slides. Their eyes get fixed by the brilliance on display.
You must be logged in to download this presentation.
 Impress your
 audience
Editable
of Time
PowerPoint presentation slides
Presenting Investor Relations Profile complete PowerPoint presentation with editable PPT slides. All slides are professionally designed by our team of PowerPoint designers. The presentation content covers all areas of investment showcase and is extensively researched. This ready-to-use deck comprises visually stunning PowerPoint templates, icons, visual designs, data-driven charts and graphs and business diagrams. The deck consists of a total of 62 slides. You can customize this presentation as per your branding needs. You can change the font size, font type, colors as per your requirement. Download the presentation, enter your content in the placeholders and present with confidence!
People who downloaded this PowerPoint presentation also viewed the following :
Content of this Powerpoint Presentation
Slide 1: This slide shows Investor Relations Profile. State Your Company Name and begin.
Slide 2: This slide showcases Agenda. You can put your company agenda.
Slide 3: This slide shows Company Investor Update with these three parameters- Position, Email Address, Name.
Slide 4: This slide presents About Company and these are some the important criterion you can use- Company Founded, No. Of Employees, Funding, Headquarters.
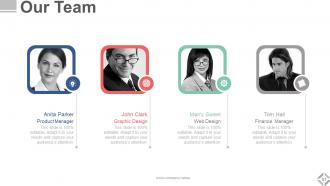
Slide 5: This slide showing about our team. You can put the team names in the space provided.
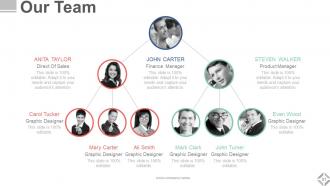
Slide 6: This slide showcases Our Team hierarchy chart. You can use for your company .
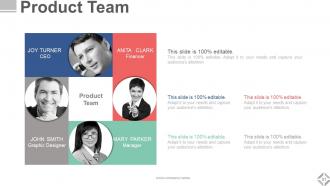
Slide 7: This slide shows product team with that you can add the name of the team members.
Slide 8: This slide presents Growth Team. It includes name of the team members and also you can put pictures.
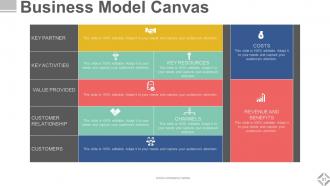
Slide 9: This slide showcases Business Model Canvas. You can add the content as per your requirement.
Slide 10: This slide presents Business Model Canvas and further it is also showing Business Model which further includes- Monetization, Market Attractiveness, Unique Value Proposition, Profit Models, Graceful Exit, Sales Performance Model, Changing Competitive, Innovation Factor, Pitfall Avoidance.
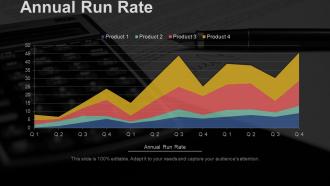
Slide 11: This slide displays Annual Run Rate graph with comparison of the products.
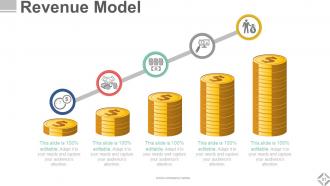
Slide 12: This slide showcases Revenue Model. You can use it as per your requirement.
Slide 13: This slide presents Monthly Run Revenue showing with bar chart and line chart.
Slide 14: This slide showcases Monthly Recurring Revenue Churn with a line chart.
Slide 15: This slide shows Monthly Recurring Revenue Churn with which you can use for different dates and month.
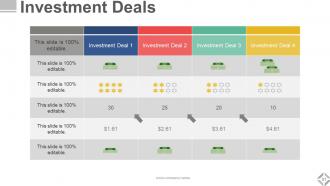
Slide 16: This slide presents Investment Deals table in which you can put the deals.
Slide 17: This slide shows Production Costs with the variation of the month and quadrant.
Slide 18: This slide showcases Production Costs with the information or data you can put in order to make usable for your company.
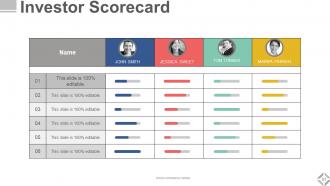
Slide 19: This slide presents Investor Scorecard. You can add your data in the table and use it.
Slide 20: This slide shows Competitive Analysis with which you can analyze and put your company data.
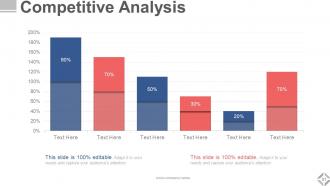
Slide 21: This slide showcases Competitive Analysis with a bar chart. Analyse the competitor with the percentage variation.
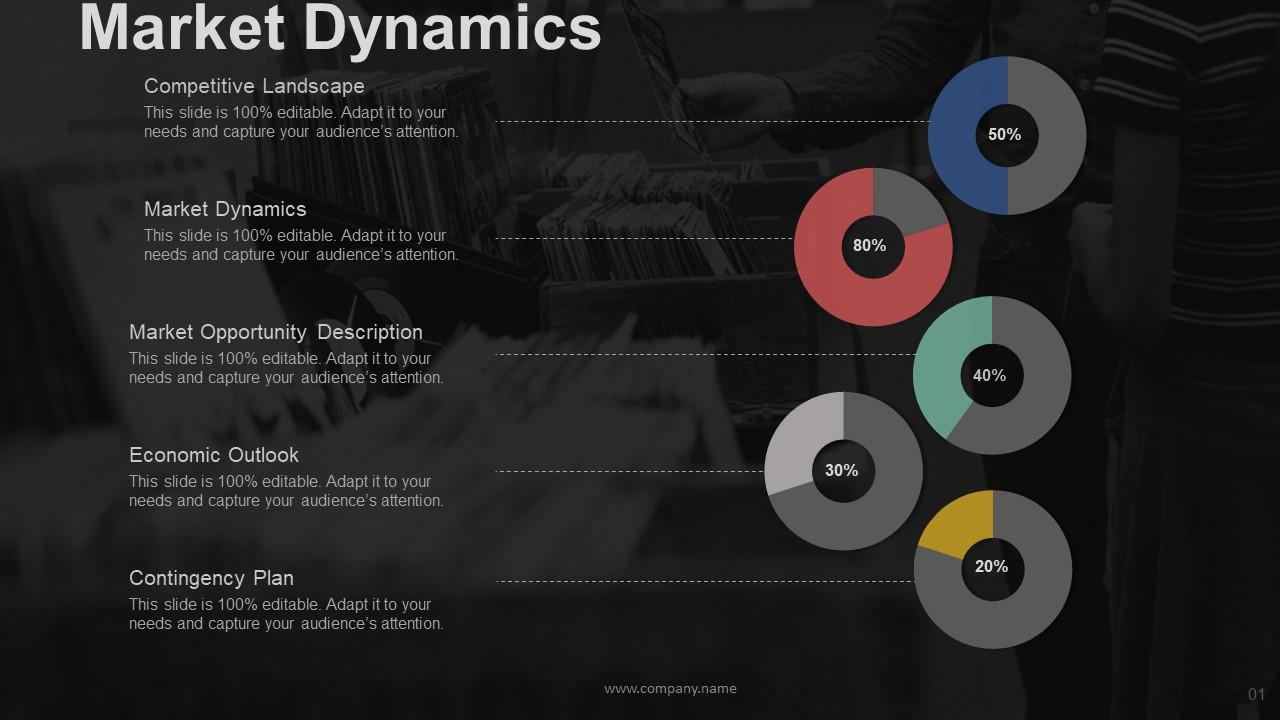
Slide 22: This slide presents Market Dynamics showing different sections that are analyzed- Competitive Landscape, Market Dynamics, Economic Outlook, Market Opportunity Description, Contingency Plan.
Slide 23: This slide showcases Market Dynamics with these important factors- Competitive Landscape, Market Dynamics, Economic Outlook, Market Opportunity Description, Contingency Plan.
Slide 24: This slide showcases Market Budget, You can use these components which we have listed- Marketing Objectives, Target Mark, Business Opportunities, Competition, Products & Services.
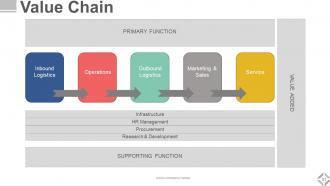
Slide 25: This slide shows Value Chain with these important points you can consider- Infrastructure, HR Management, Research & Development, Procurement, Inbound Logistics, Operations, Outbound Logistics, Marketing & Sales, Service.
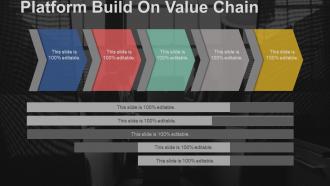
Slide 26: This slide showcases Platform Build On Value Chain. You can add as per you business requirements.
Slide 27: This slide presents Operating Excellence which you can use as per your business requirement- Operating income, Operating expenses, Capacity utilization, Cash flow.
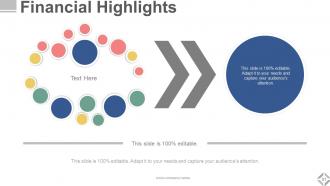
Slide 28: This slide showcases Financial Highlights with a graph and table. You can use it as per your requirement.
Slide 29: This slide shows Financial Highlights. You can add your data as per your requirement.
Slide 30: This slide presents Financial Report with a data driven chart.
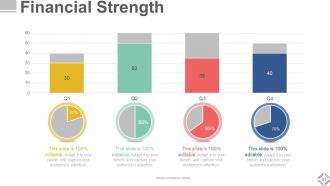
Slide 31: This slide showcases Financial Strength with a graph and pie chart showing the percentage.
Slide 32: This slide shows Sales Performance Dashboard . You can add the data and use it as per requirement.
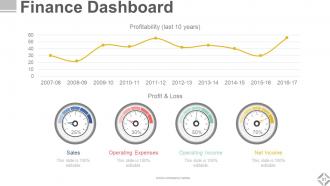
Slide 33: This slide displays Finance Dashboard with graphical representation and meter shaped kpis.
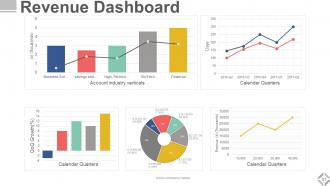
Slide 34: This slide shows Revenue Dashboard. You can use the dashboard as per your requirement.
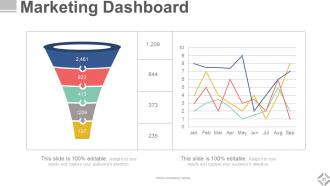
Slide 35: This slide presents Marketing Dashboard with a funnel diagram and graphical representation.
Slide 36: This slide showcases Investment Timeline with yearly variation.
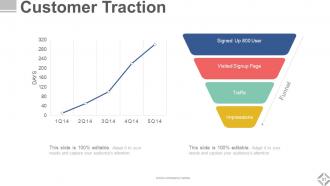
Slide 37: This slide displays Customer Traction. You can add the cutomer data for you website.
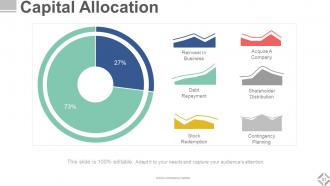
Slide 38: This slide shows Capital allocation with these criterion- Acquire A Company, Shareholder Distribution, Contingency Planning, Stock Redemption, Debt Repayment, Reinvest In Business.
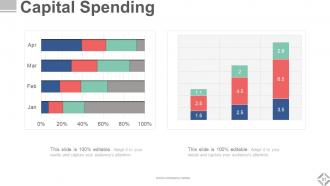
Slide 39: This slide displays Capital Spending. You can add your data and use it accordingly.
Slide 40: This slide shows Project Progress And Reasons For Delay and use it as per your project requirement.
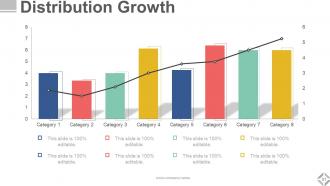
Slide 41: This slide displays Distribution Growth with a graph and shows different category growth chart.
Slide 42: This slide showcases Midstream Organic Growth. You can use it as per your need.
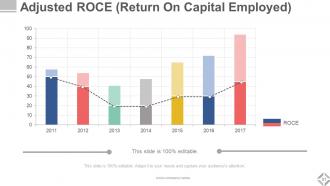
Slide 43: This slide shows Adjusted ROCE (Return On Capital Employed) with which you can analyze the business or company growth.
Slide 44: This slide showcases Adjusted ROCE (Return On Capital Employed). It further includes graph with a bar chart.
Slide 45: This slide presents Global Demand with these pointed countries- Europe, North America, Russia/Caspian, Japan, Other Asia pacific, India, Africa, Middle East, Latin America, China.
Slide 46: This slide is showing the Diversified Global Portfolio which further representing the global users.
Slide 47: This slide is titled Additional Slides.
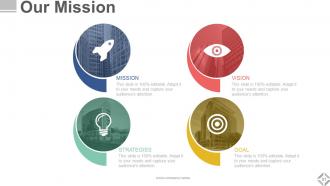
Slide 48: This slide represents Our Mission. State your mission, goals etc.
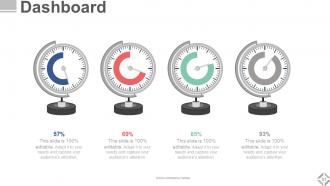
Slide 49: This is a Dashboard slide to show- Strategic System, Success, Goal Process, Sales Review, Communication Study.
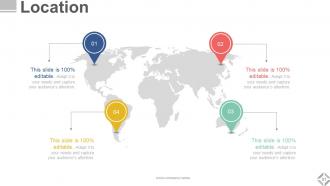
Slide 50: This is a Location slide to show global growth, presence etc. on world map.
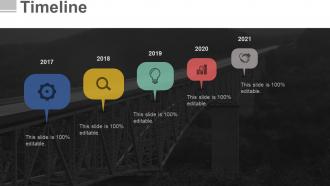
Slide 51: This is a Timelines slide to show- Plan, Budget, Schedule, Review.
Slide 52: This is a Target slide. State your targets here.
Slide 53: This is a Circular slide to show information, specification etc.
Slide 54: This is a Venn diagram image slide to show information, specifications etc.
Slide 55: This slide shows a Mind map for representing entities.
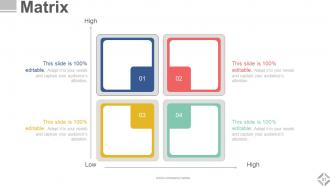
Slide 56: This is a matrix slide. Put relevant comparing data here.
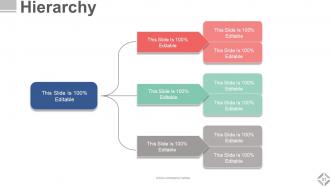
Slide 57: This is a hierarchy diagram . You can use it for your organisation chart.
Slide 58: This is a Bulb or Idea slide to state a new idea or highlight specifications/information etc.
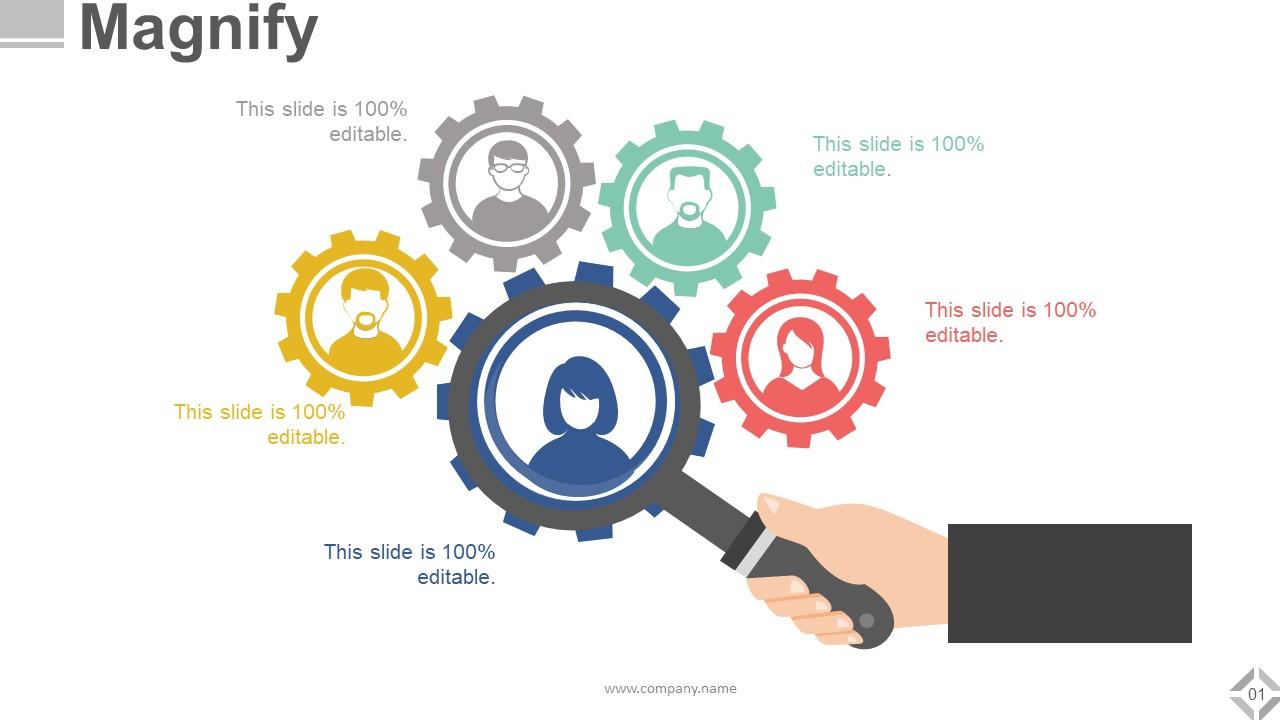
Slide 59: This slide shows a Magnifying glass with text boxes.
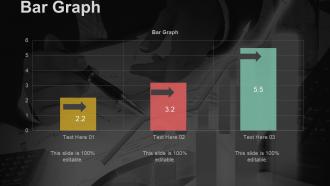
Slide 60: This slide presents a Bar graph in arrow form with text boxes.
Slide 61: This is a Funnel slide. Showcase the funnel aspect of your team, company, product etc.
Slide 62: This is a Thank You slide with Address# street number, city, state, Contact Number, Email Address.
Investor Relations Profile Powerpoint Presentation Slides with all 60 slides:
Our Investor Relations Profile Powerpoint Presentation Slides will get you into your element. Your thoughts will be in their comfort zone.
-
Content of slide is easy to understand and edit.
-
Good research work and creative work done on every template.
-
Great


