Monthly business performance assessment ppt slides complete deck
Introducing our monthly business performance assessment PPT slides complete deck. Present an overview of your business with help of this cyclical performance evaluation PowerPoint deck. Use this periodical performance PowerPoint design to highlight the key developments in the financial order of your company. Employ this performance evaluation PPT template in your presentation to focus on your clientele and the associated growth factors of your company. This particular monthly PPT theme lets you dive into the current market trends. This appraisal evaluation PowerPoint creative set helps in doing competitive analysis of equity, debt, and KPIs. Understand the performance assessment PPT bundle to provide a future roadmap to your team members. Selection of this periodical conduct evaluation PowerPoint template lets you graph the income projections of your company. This appraisal validation PPT deck lets you make required variations with icons and colors. Choose this cyclical assessment PowerPoint design to showcase organization and assurance. Download this PPT slide to explore true perfection.
You must be logged in to download this presentation.
 Impress your
 audience
Editable
of Time
PowerPoint presentation slides
Presenting our monthly business performance assessment PPT slides complete deck.This PowerPoint design contains sixty-seven slides in it which can be completely customized and edited. This PowerPoint template is compatible with all the presentation software like Microsoft Office, Google Slides, etc. It can be downloaded in varying formats like JPEG, PDF, PNG, etc. You can download this PPT layout by clicking on the button below.
People who downloaded this PowerPoint presentation also viewed the following :
Content of this Powerpoint Presentation
Slide 1: This slide introduces Monthly Business Performance Assessment PPT Slides. Add Your Company Name here.
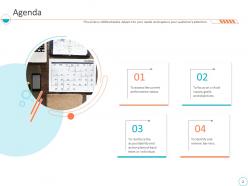
Slide 2: This is an Agenda slide assessing the current performance status, focusing on critical issues, goals, and objectives, etc.
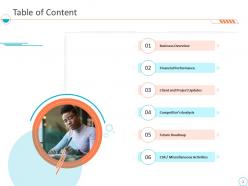
Slide 3: This slide shows a Table of Content such as business Overview, Financial Performance, Client and Project Updates, and so on.
Slide 4: This Table of Content slide displays Monthly Business Review.
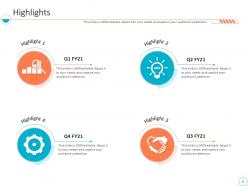
Slide 5: This slide displays highlights for four quarters of FY 21.
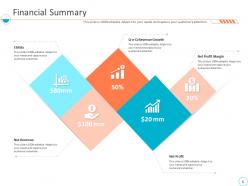
Slide 6: This slide presents Financial Summary with,Ebitda, Net Revenue, Q-o-Q Revenue Growth, Net Profit, Net Profit Margin.
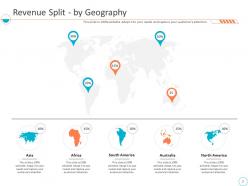
Slide 7: This slide displays Revenue Split - by Geography.
Slide 8: This slide displays Revenue Split - by Country.
Slide 9: This slide displays Revenue Split - by Product/Segment.
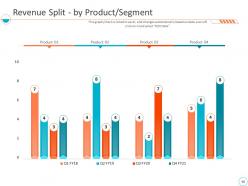
Slide 10: This slide illustrates graph for Revenue Split - by Product/Segment.
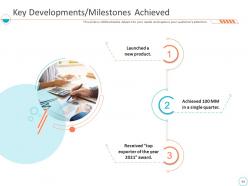
Slide 11: This slide displays Key Developments and Milestones Achieved.
Slide 12: This Table of Content slide displays Monthly Business Review of Financial Performance
Slide 13: This slide illustrates a graph for P&L - KPIs with Revenue, COGS, Net Increase in Cash and CAGR.
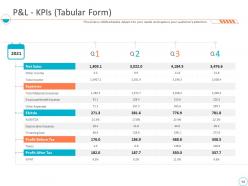
Slide 14: This slide illustrates P&L and KPIs in tabular format.
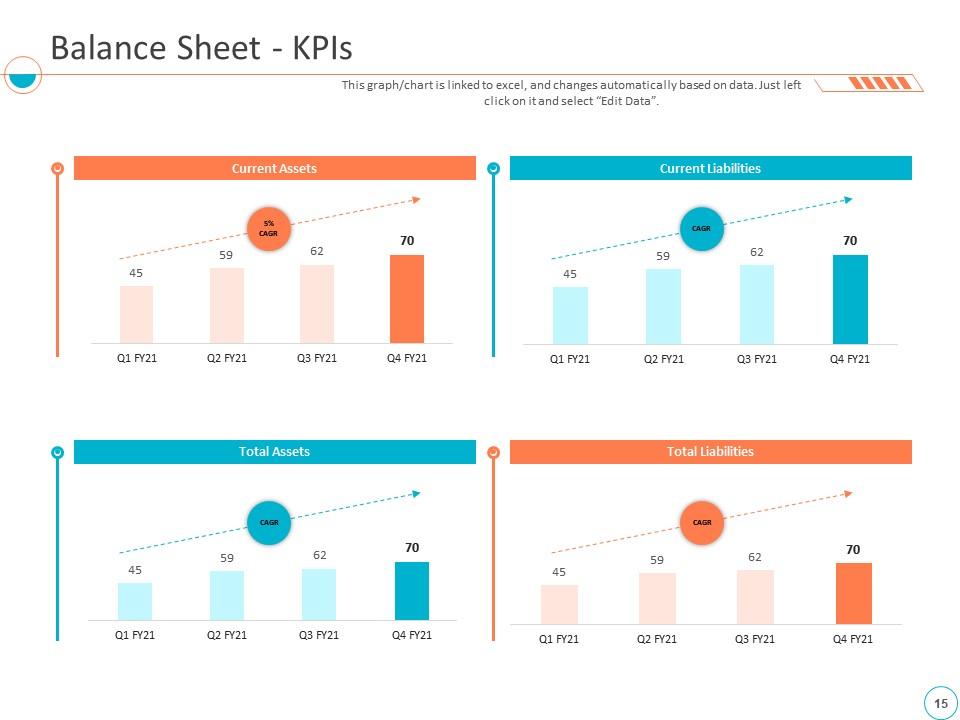
Slide 15: This slide illustrates a graph for the Balance Sheet - KPIs with Current Assets, Total Assets, Current Liabilities, Total Liabilities and CAGR.
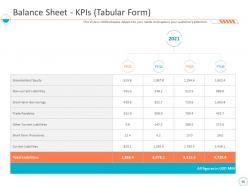
Slide 16: This slide illustrates Balance Sheet - KPIs in tabular format.
Slide 17: This is a continued slide of Balance Sheet - KPIs in tabular format with total fixed assets.
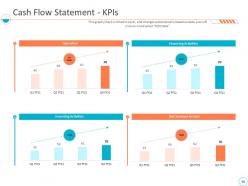
Slide 18: This slide illustrates a graph of Cash Flow Statement - KPIs with Operation, Investing Activities, Financing Activities, Net Increase In Cash, and CAGR,
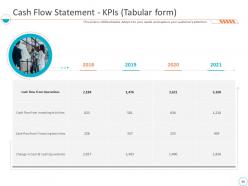
Slide 19: This slide illustrates Cash Flow Statement - KPIs in tabular format.
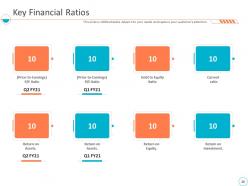
Slide 20: This slide displays Key Financial Ratios such as the Current ratio, P/E Ratio, and Debt to Equity Ratio, etc.
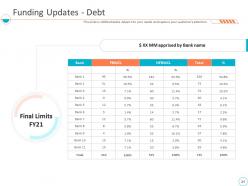
Slide 21: This slide displays Funding Updates of Debt with Final Limits FY21.
Slide 22: This slide displays Funding Updates of Equity with Shareholding Pattern.
Slide 23: This Table of Content slide displays Client and Project Updates.
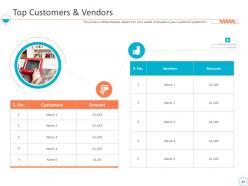
Slide 24: This slide displays Top Customers & Vendors.
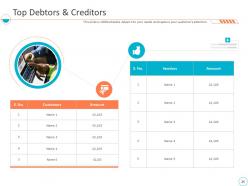
Slide 25: This slide displays Top Debtors & Creditors.
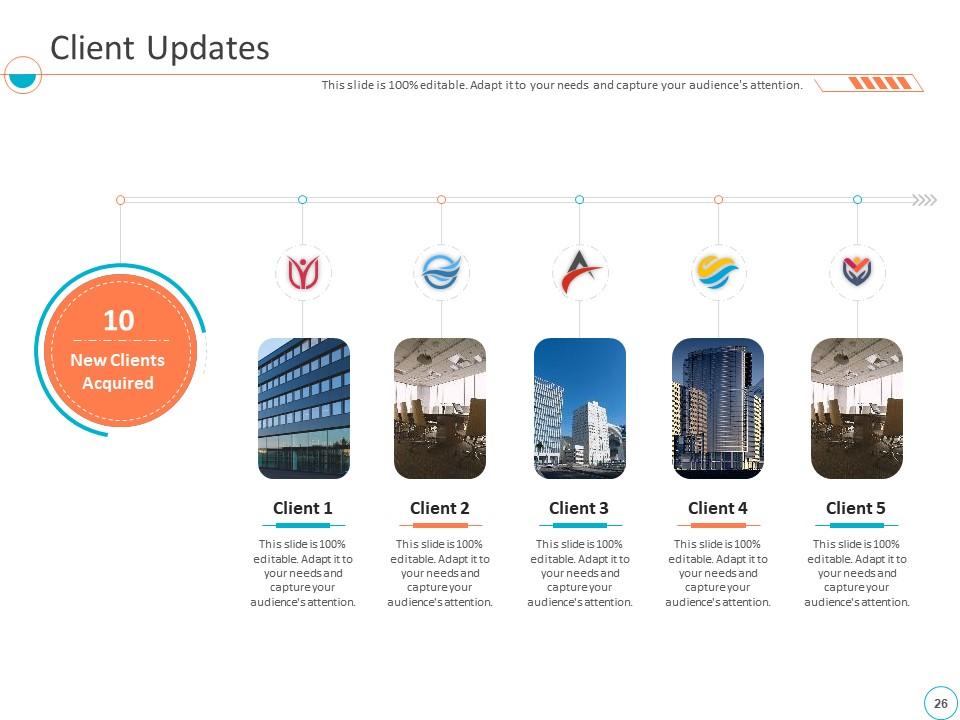
Slide 26: This slide displays Client Updates with New Clients Acquired.
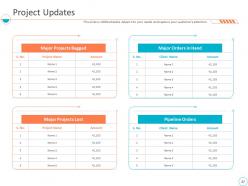
Slide 27: This slide displays Project Updates with Major Projects Bagged, Major Orders in Hand, Major Projects Lost, and Pipeline Orders.
Slide 28: This Table of Content slide displays Competitor’s Analysis.
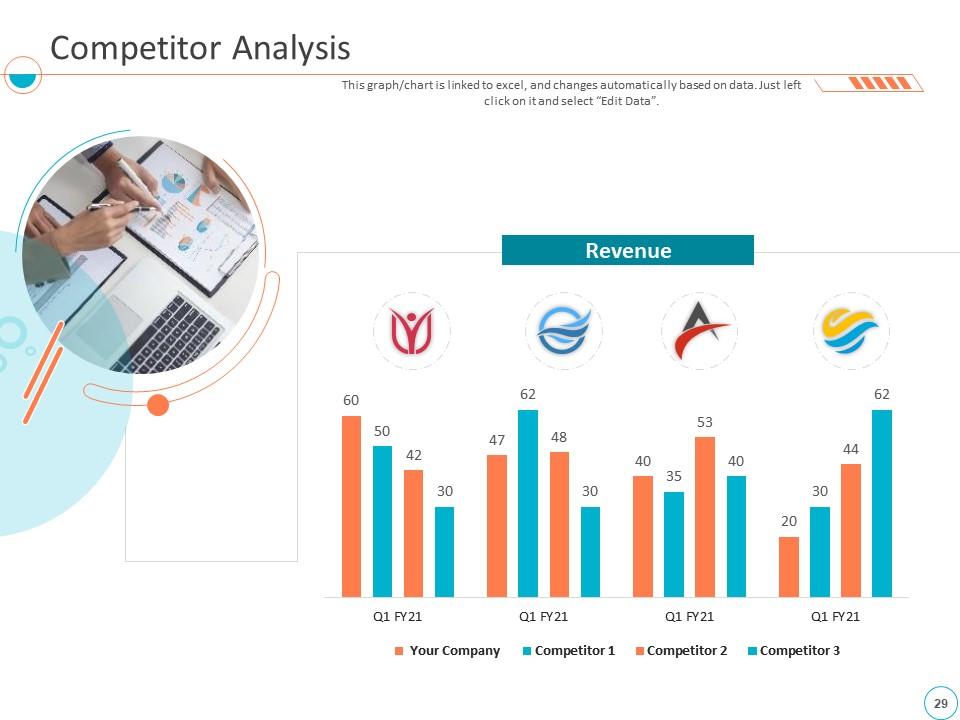
Slide 29: This slide illustrates graph of Competitor Analysis with Revenue.
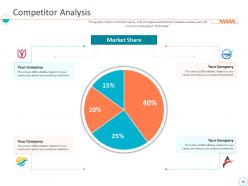
Slide 30: This slide illustrates graph of Competitor Analysis with Market Share.
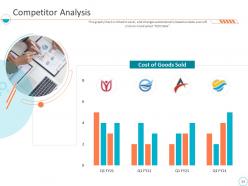
Slide 31: This slide illustrates a graph of Competitor Analysis with Cost of Goods Sold.
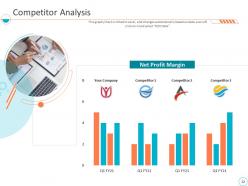
Slide 32: This slide illustrates a graph of Competitor Analysis with Net Profit Margin.
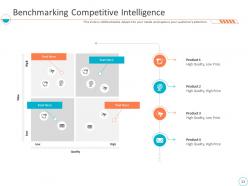
Slide 33: This slide displays Benchmarking Competitive Intelligence.
Slide 34: This Table of Content slide displays Future Roadmap.
Slide 35: This slide displays 30 60 90 Days Plan.
Slide 36: This slide displays Light Bulb with Time Planning Ideas.
Slide 37: This slide displays Product Roadmap (Layout-1).
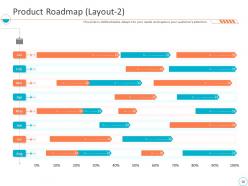
Slide 38: This slide displays Product Roadmap (Layout-2).
Slide 39: This slide displays Product Roadmap (Layout-3).
Slide 40: This slide displays five Phases of Implementation.
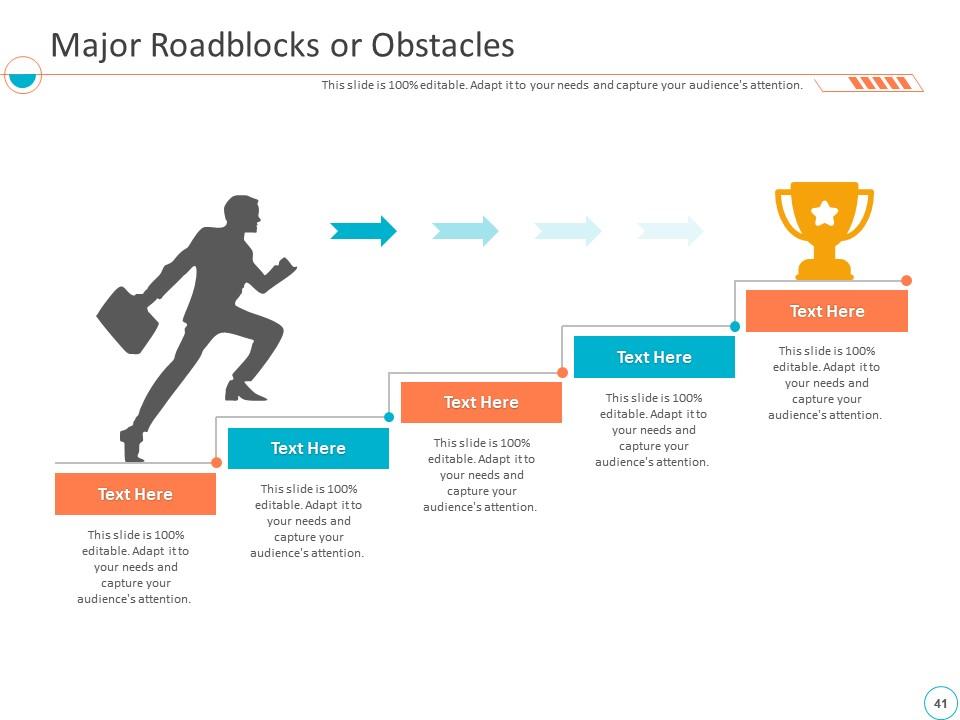
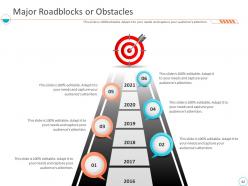
Slide 41: This slide displays Major Roadblocks or Obstacles.
Slide 42: This slide also displays Major Roadblocks or Obstacles
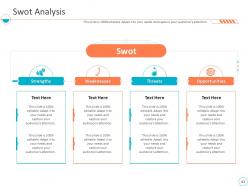
Slide 43: This slide displays SWOT Analysis for business.
Slide 44: This Table of Content slide presents CSR / Miscellaneous Activities.
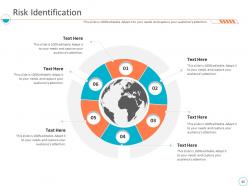
Slide 45: This slide displays process of Risk Identification.
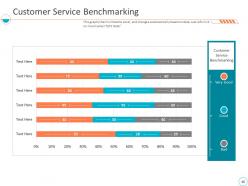
Slide 46: This slide displays chart of Customer Service Benchmarking.
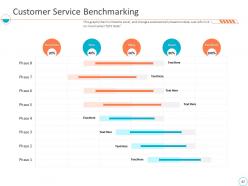
Slide 47: This slide displays eights phases of Customer Service Benchmarking.
Slide 48: This slide displays Organization Chart.
Slide 49: This slide displays Goals and Success Metrics.
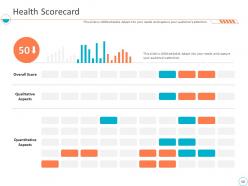
Slide 50: This slide displays Health Scorecard with Overall Score, Qualitative Aspects, and Quantitative Aspects
Slide 51: This slide displays Monthly Business Performance Assessment Icons.
Slide 52: This slide displays Coffee Break 11:00 am-11:15 am.
Slide 53: This section displays Additional Slides.
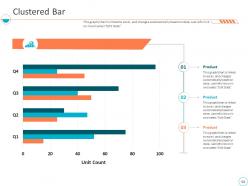
Slide 54: This slide displays Clustered Bar chart.
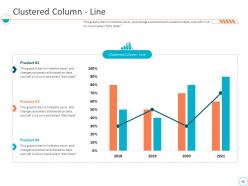
Slide 55: This slide displays Clustered Column - Line chart for three products.
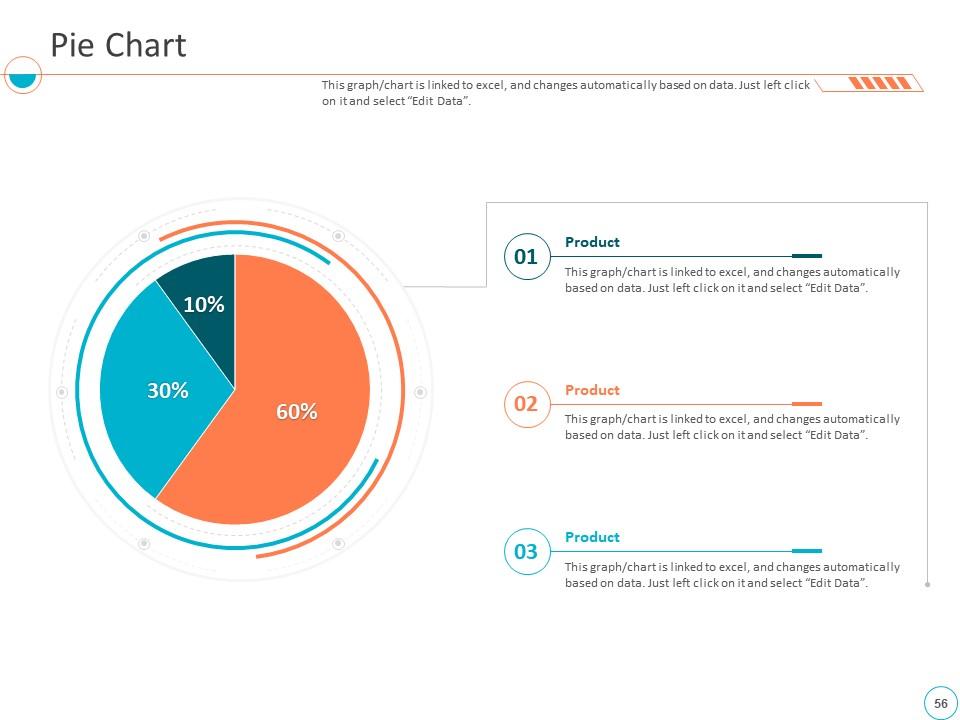
Slide 56: This slide displays Pie Chart for a comparison of three products performance.
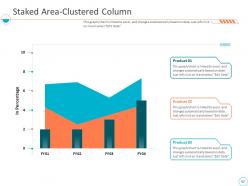
Slide 57: This slide displays Staked Area-Clustered Column chart.
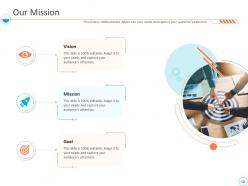
Slide 58: This slide displays Our Mission with Vision and Goal.
Slide 59: This is About Us slide with Premium Services, Target Audiences, and Value Clients.
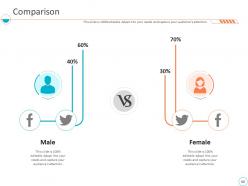
Slide 60: This slide displays Comparison of male and female users.
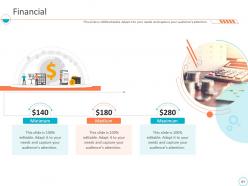
Slide 61: This is Financial slide with minimum medium and maximum levels.
Slide 62: This slide displays Post It Notes.
Slide 63: This slide also displayscPost It Notes.
Slide 64: This slide displays Target.
Slide 65: This slide displays Venn Diagram.
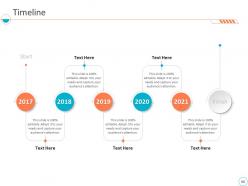
Slide 66: This slide displays Timeline for business planning.
Slide 67: This is Thank You slide with contact details.
Monthly business performance assessment ppt slides complete deck with all 67 slides:
Use our Monthly Business Performance Assessment Ppt Slides Complete Deck to effectively help you save your valuable time. They are readymade to fit into any presentation structure.
-
Great product with highly impressive and engaging designs.
-
Very well designed and informative templates.
-
Great product with effective design. Helped a lot in our corporate presentations. Easy to edit and stunning visuals.
-
Illustrative design with editable content. Exceptional value for money. Highly pleased with the product.
-
Great designs, really helpful.
-
Very well designed and informative templates.
-
Unique research projects to present in meeting.
-
Commendable slides with attractive designs. Extremely pleased with the fact that they are easy to modify. Great work!


