Gap analysis powerpoint presentation with slides
Crafting a fruitful good example of PPT on gap analysis can be a challenge on your own. To help you out here we are showcasing complete PowerPoint slide deck to pictorially illustrate a gap analysis process or gap analysis model. Well applicable to all businesses it acts as a potential tool to figure out the priorities required for carrying improvement. Most exciting thing is that you can also apply our ready made PPT model to compare the performance of your employees so as to quantify the disparity between their current and desired performance. Furthermore, a visual communication made with help of our presentation deck helps to empower employees for quick diagnosis of a problem. Additionally, to cover all the necessary aspects here we have included template themes like gap analysis graphs, basic gap analysis chart, gap analysis procedure etc. In short, you can add value to your business processes by thoroughly discussing a business gap analysis with help of our readymade sample presentation PPT. So, hurry download our performance gap analysis PPT sample file and get started immediately. Avoid excessive formality with our Gap Analysis Complete Powerpoint Deck With Slides. Allow greater freedom to exist.
You must be logged in to download this presentation.
 Impress your
 audience
Editable
of Time
PowerPoint presentation slides
A complete set of 52 template slides for business analysts or strategy planners. Manual editing process to alter PowerPoint background, text or color. High resolution and vibrant colors presentation graphics. Freely insert text, title or sub-titles as there is no limited space. Downloads quickly with just a click. Easy to insert company name, logo or trademark. Goes well with Google slides.
People who downloaded this PowerPoint presentation also viewed the following :
Content of this Powerpoint Presentation
Slide 1: This slide introduces Gap Analysis. State Your company name and get started.
Slide 2: This is an Agenda slide. State your agendas here.
Slide 3: This slide presents a Gap Analysis Overview with the following points- Basic Process For Gap Analysis, Current State, Desired State, Where Do We Want To Go? How Do We Do That? What Do We Need To Do Get There? Where Are We Now?
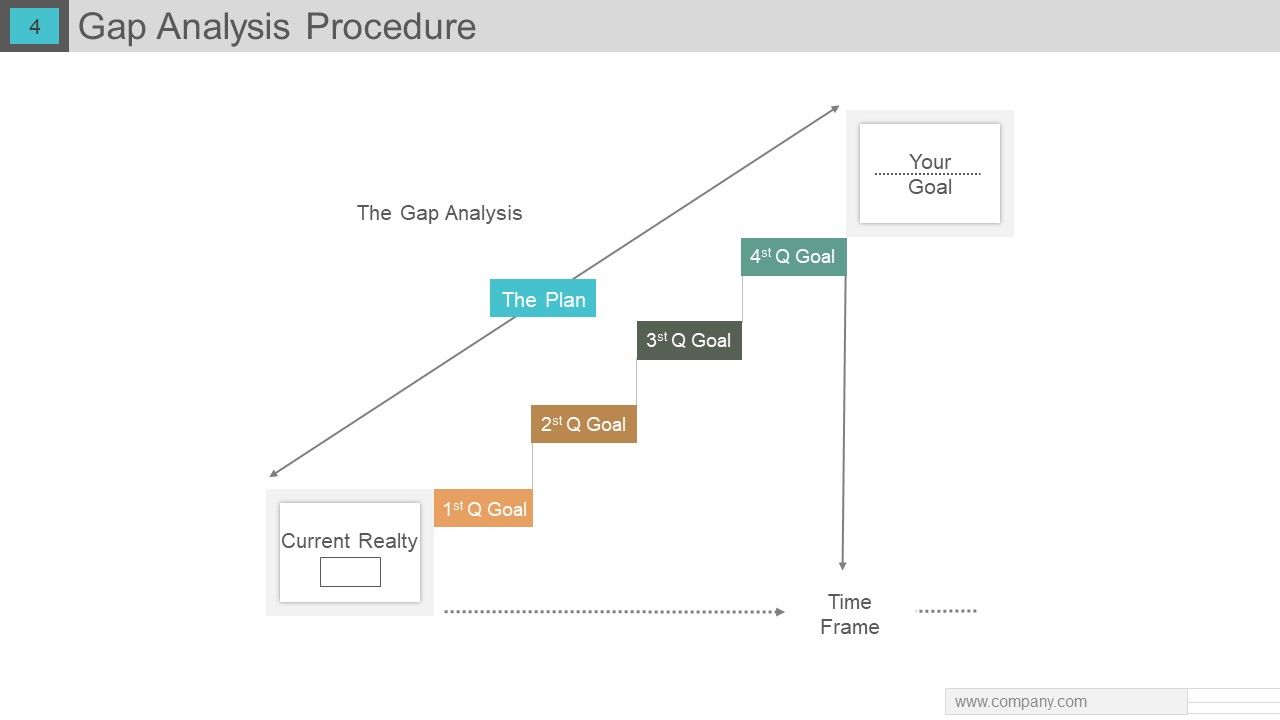
Slide 4: This slide showcases the Gap Analysis Procedure with- Time Frame, The Gap Analysis, Your Goal, Current Realty.
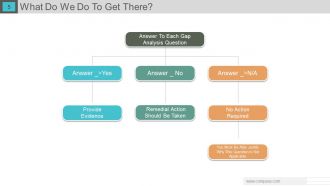
Slide 5: This slide presents What Do We Do To Get There?
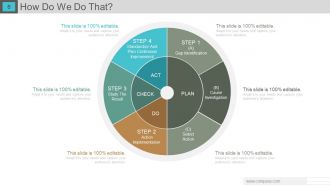
Slide 6: This slide presents How Do We Do That?
Slide 7: This slide showcases a GAP Analysis Graph with- Actual Performance Potential Performance Diversification Product Development Market Growth Market Penetration Revenue in terms of Time, Low-High Risk.
Slide 8: This slide shows Current State Analysis Company's Mission stating Our Mission.
Slide 9: This slide showcases the Current State Analysis Our Market Share in pie chart form.
Slide 10: This slide shows Current State Analysis Financial Comparison graph.
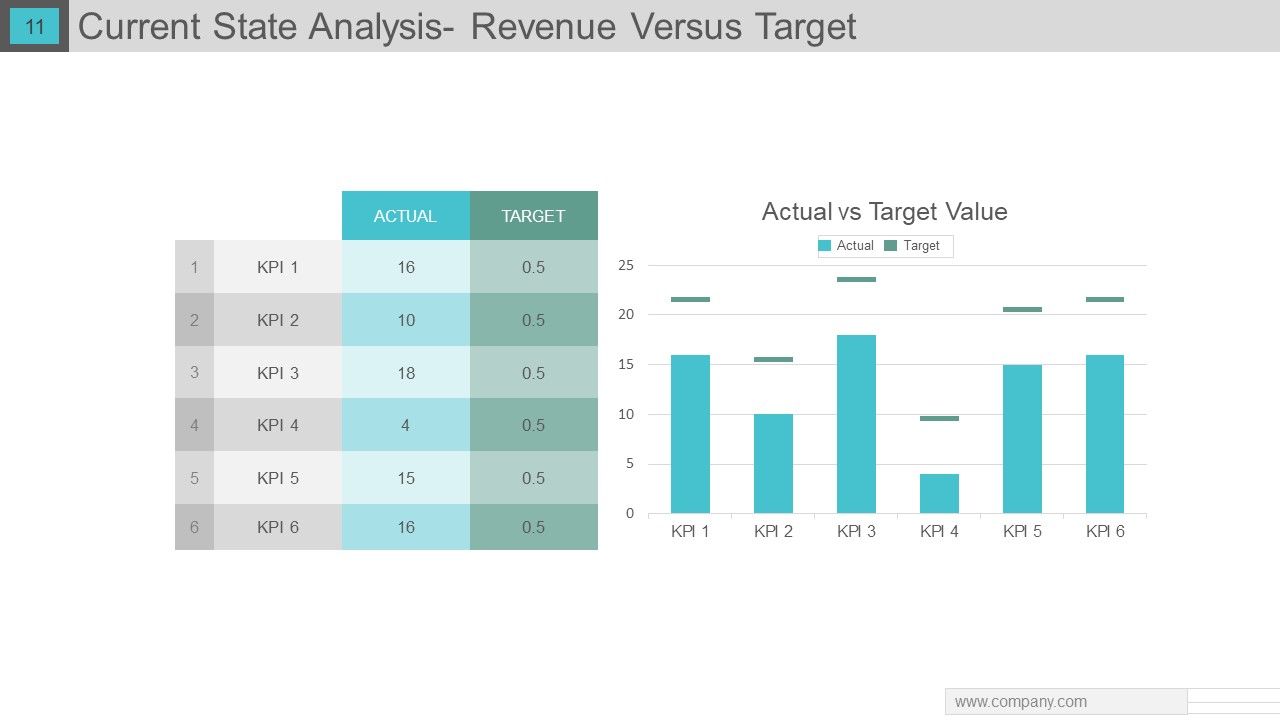
Slide 11: This slide shows Current State Analysis- Revenue Versus Target with separate graphs of- Actual vs Target Value, Actual - Target
Slide 12: This slide showcases Basic Gap Analysis Chart with the follwoing points- What Exactly is The Gap? What are the Comsequences of the Gap? What is Timing? who is Responsible? What are the Options? What are The Cost?
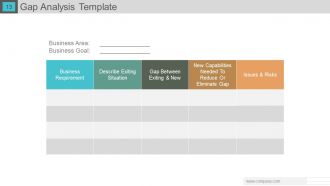
Slide 13: This slide presents a Gap Analysis Template with- Business Area, Business Goal.
Slide 14: This slide presents a Fit Gap Analysis table.
Slide 15: This slide shows a Gap Analysis Template.
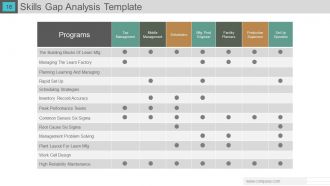
Slide 16: This slide shows a Skill Gap Analysis Template.
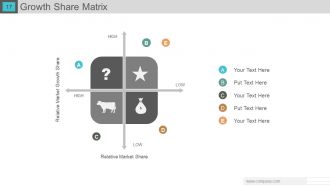
Slide 17: This slide shows a Growth Share Matrix to display infromation, specification etc.
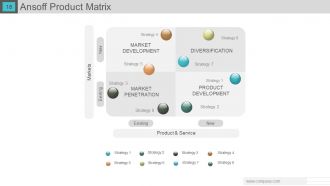
Slide 18: This slide showcases an Ansoff Product Matrix with- Product & Service, New, Existing, Market Development, Market Penetration, Diversification, Product Development.
Slide 19: This slide presents Gap Analysis Tool- Servqual with the following points- Assurance, Empathy, Tangible, Reliability, Responsiveness.
Slide 20: This slide presents a Servqual Model with the following points- Word Of Mouth Communication, Management Perception Of Customer Expectations, Personal Needs, Past Experience, Perceived Service, Service Delivery, Service Quality Specifications, External Communication To Customers, Expected Service, Customer, Provider, GAPS.
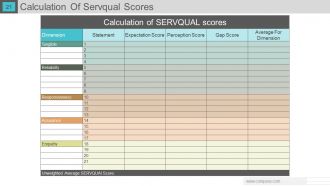
Slide 21: This slide presents Calculation Of Servqual Scores table.
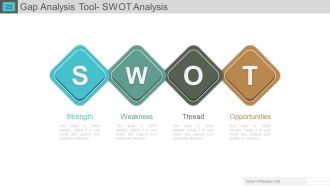
Slide 22: This slide showcases Gap Analysis Tool- SWOT Analysis.
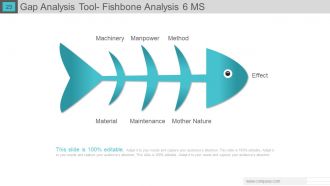
Slide 23: This slide presents Gap Analysis Tool- Fishbone Analysis 6 Ms. They are- Machinery, Manpower, Method, Material, Maintenance, Mother Nature Effect.
Slide 24: This slide presents Gap Analysis Tool- Mckinsey 7S. They are- Shared Values, Strategy, Structure, Style, Staff, Skills, Systems.
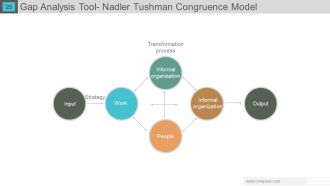
Slide 25: This slide showcases Gap Analysis Tool- Nadler Tushman Congruence Model. The constituents are- Work, Informal organization, People, Strategy, Output, Input, Transformation process.
Slide 26: This slide is titled Additional Slides to move forward. You can change the content as per need.
Slide 27: This slide presents Mission and Vision showing Vision, Mission and Core Value.
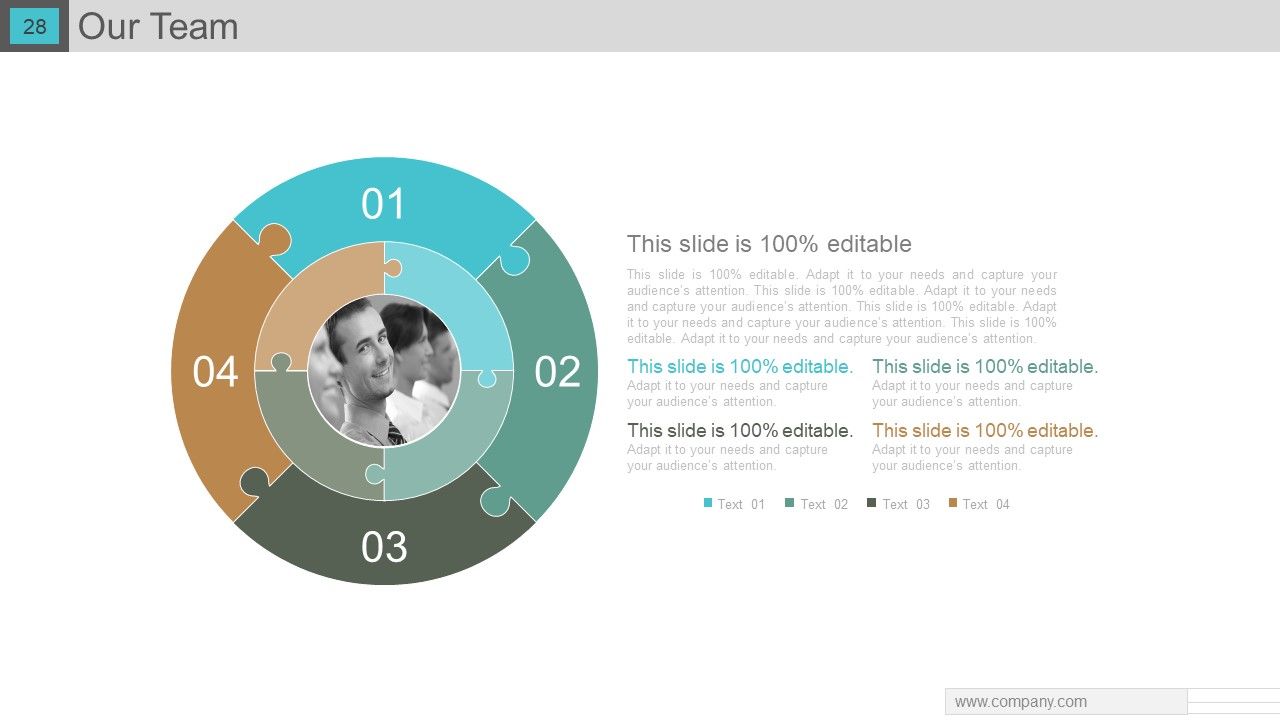
Slide 28: This is an Our Team slide as puzzle image box with text boxes.
Slide 29: This is an About Us slide. State company/team specifications here.
Slide 30: This is Our Goals slide. State goals, targets etc. here.
Slide 31: This is a Comparison slide to compare two entities etc.
Slide 32: This is a Financial score slide. State financial aspects etc. here.
Slide 33: This is a Quotes slide to convey company/organization message, beliefs etc.
Slide 34: This is a Dashboard slide to show growth factors in terms of Good, Low, Maximum and Moderate.
Slide 35: This is a Location slide of world map to show global presence, growth etc.
Slide 36: This is a Timeline slide to show growth, highlighting factors, milestones etc.
Slide 37: This is a Post It slide to show - Evaluate, Strategy, Vision, Execute.
Slide 38: This is a News Paper slide to show events, news etc. You can change the slide as per your need/requirement.
Slide 39: This is a Puzzle image slide showing- Collaborative Leadership, Venture, Facilitation, Innovation, Crowdsourcing.
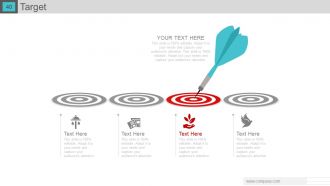
Slide 40: This is a Target slide. State targets, goals etc. here.
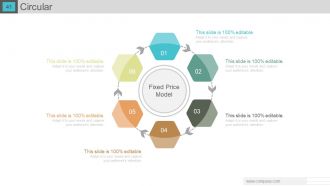
Slide 41: This is a Circular image slide showing Fixed Price Model.
Slide 42: This is a Venn diagram image slide. State information, specifications etc. here.
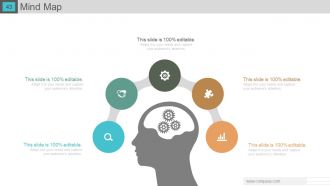
Slide 43: This is a Mind Map image slide. State information, specifications etc. here.
Slide 44: This slide presents a Matrix in terms of- Market Growth Rate, Relative Market Share, High, Low.
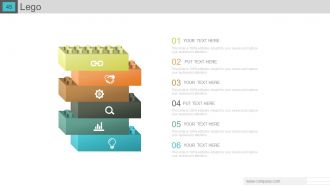
Slide 45: This is a Lego image slide. State information, specifications etc. here.
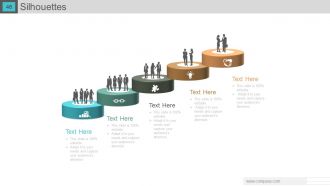
Slide 46: This is a Silhouettes image slide. State people related information, specifications etc. here.
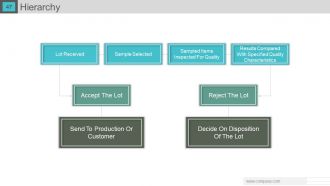
Slide 47: This slide presents a Hierarchy with the following content- Lot Received, Sample Selected, Sampled Items Inspected For Quality, Results Compared With Specified Quality Characteristics, Accept The Lot, Reject The Lot, Send To Production Or Customer, Decide On Disposition Of The Lot.
Slide 48: This is a Bulb/Idea image slide. State information, specifications, innovative aspects etc. here.
Slide 49: This is a Magnifying glass image slide. State information, specifications etc. here.
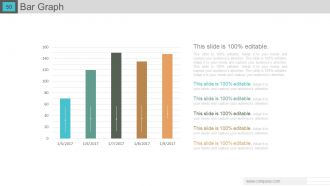
Slide 50: This is a Bar Graph slide to show product/entity comparison.
Slide 51: This is a Funnel image slide showing- Customers, Leads, Prospects, Suspects.
Slide 52: This is a Thank You slide to end a presentation.
Gap analysis powerpoint presentation with slides with all 52 slides:
Cut down on extra expenditure with our Gap Analysis Complete Powerpoint Deck With Slides. Display great economic efficiency.
FAQs
Gap Analysis is a process of identifying the difference between the current state of an organization and where it wants to be in the future. It involves assessing the organization's current state, defining the desired state, identifying the gap, and developing a plan to bridge the gap.
There are various tools used in Gap Analysis, such as SWOT Analysis, Fishbone Analysis (6Ms), McKinsey 7S, Servqual Model, Growth Share Matrix, Fit Gap Analysis, and Skill Gap Analysis.
Servqual Model is a Gap Analysis tool that helps measure the quality of service provided by an organization based on five dimensions: assurance, empathy, tangible, reliability, and responsiveness. It is used to identify gaps between the expected and perceived service quality.
McKinsey 7S is a Gap Analysis tool that identifies seven key elements in an organization that must be aligned to achieve the desired results. These elements are shared values, strategy, structure, style, staff, skills, and systems.
Gap Analysis can benefit an organization in many ways, such as identifying areas for improvement, optimizing resource allocation, increasing efficiency and productivity, enhancing customer satisfaction, and achieving strategic objectives. By understanding the gaps, an organization can develop a plan to bridge them and move towards the desired state.
-
Illustrative design with editable content. Exceptional value for money. Highly pleased with the product.
-
Unique design & color.


