Finance Portfolio Management KPIs And Dashboard Powerpoint Presentation Slides
Presenting our Finance Portfolio Management KPIs And Dashboard PowerPoint Presentation Slides. Select the best marketing strategy for your company by employing these investment portfolio PPT slides. Display the performance of your assets and brand systematically and in an organized manner through these portfolio management PPT templates. Highlight the ongoing projects, the budget required, and the total cost summary in a comprehensive way taking aid of our stocks portfolio PPT layouts. This capital portfolio PPT deck allows you to present a detailed cost and benefit analysis, the timeline for the target, and risks and change requests analysis of your business. Apply KPIs metrics for the financial overview of your business by successfully employing our investment management PowerPoint presentation. Educate your viewers about your company’s vision, mission, and goals with the assistance from this expertly created and concept-specific assets portfolio PPT presentation. Download this fiscal portfolio PPT slideshow and innovatively present your strategies by taking advantage of our thousands of available and editable graphs, charts, icons, shapes, etc.
You must be logged in to download this presentation.
 Impress your
 audience
Editable
of Time
PowerPoint presentation slides
Presenting our Finance Portfolio Management KPIs And Dashboard PowerPoint Presentation Slides. This is a 100% editable and adaptable PPT slide. You can save it in different formats like PDF, JPG, and PNG. It can be edited with different color, font, font size, and font type of the template as per your requirements. This template supports the standard (4:3) and widescreen (16:9) format. It is also compatible with Google slides.
People who downloaded this PowerPoint presentation also viewed the following :
Content of this Powerpoint Presentation
Slide 1: This title slide presents the Finance Portfolio Management KPIs and Dashboard. Add the name of your company here.
Slide 2: This slide contains the Content. It includes - Portfolio Performance Dashboard, Project Portfolio Summary Dashboard, Portfolio Risk and Change Request Dashboard, Portfolio Timeline Summary Dashboard, Portfolio Dashboard: Cost and Benefit, Portfolio Management Dashboard, Portfolio Summary Management Dashboard, Portfolio Management Securities Allocation Dashboard, Portfolio Management KPI’s, and Portfolio Management Investment Allocation KPI.
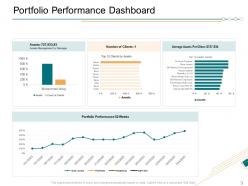
Slide 3: This slide presents the Portfolio Performance Dashboard.
Slide 4: This slide presents the Project Portfolio Summary Dashboard 1/2.
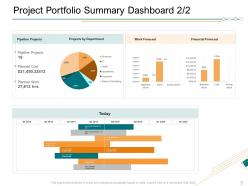
Slide 5: This slide presents the Project Portfolio Summary Dashboard 2/2.
Slide 6: This slide presents the Portfolio Risk and Change Request Dashboard.
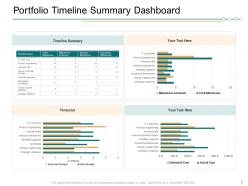
Slide 7: This slide presents the Portfolio Timeline Summary Dashboard.
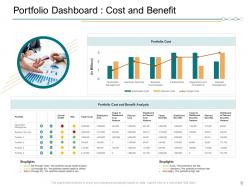
Slide 8: This slide presents the Portfolio Dashboard: Cost and Benefit.
Slide 9: This slide presents the Portfolio Management Dashboard.
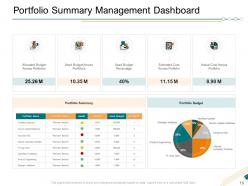
Slide 10: This slide presents the Portfolio Summary Management Dashboard.
Slide 11: Portfolio Management Securities Allocation Dashboard.
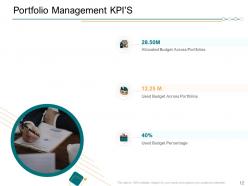
Slide 12: This slide presents the Portfolio Management KPI’s.
Slide 13: This slide presents the Portfolio Management Investment Allocation KPI’s.
Slide 14: This is the Icons Slide for Finance Portfolio Management KPIs and Dashboard.
Slide 15: This is the Coffee Break slide.
Slide 16: This slide introduces the Additional Slides.
Slide 17: This slide shows a Stacked Bar that compares 3 products’ finances over a timeline of years.
Slide 18: This slide shows a Clustered Column that compares 3 products’ finances over a timeline of years.
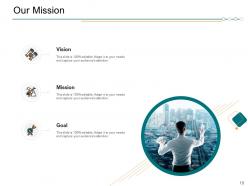
Slide 19: This slide provides the Mission for the entire company. This includes the vision, the mission, and the goal.
Slide 20: This slide shows the members of the company team with their name, designation, and photo.
Slide 21: This slide presents a comparison between the percentage of male and female Instagram users.
Slide 22: This slide presents the Financial with a data’s numbers at minimum, medium, and maximum percentage.
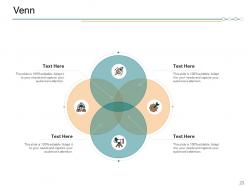
Slide 23: This slide provides a Venn diagram that can be used to show interconnectedness and overlap between various departments, projects, etc.
Slide 24: This is a Thank You slide where details such as the address, contact number, email address are added.
Finance Portfolio Management KPIs And Dashboard Powerpoint Presentation Slides with all 24 slides:
Use our Finance Portfolio Management KPIs And Dashboard Powerpoint Presentation Slides to effectively help you save your valuable time. They are readymade to fit into any presentation structure.
-
Illustrative design with editable content. Exceptional value for money. Highly pleased with the product.
-
Editable templates with innovative design and color combination.
-
Excellent products for quick understanding.
-
Design layout is very impressive.
-
Use of different colors is good. It's simple and attractive.
-
It saves your time and decrease your efforts in half.
-
Attractive design and informative presentation.
-
Good research work and creative work done on every template.
-
Easily Editable.
-
The content is very helpful from business point of view.


