Digital Transformation For Data Driven Decision Making Training Ppt
This set of slides provides information about the use case of digital transformation in enabling organizations to make data-driven decisions. It also covers the new developments in business intelligence, such as data mining, performance benchmarking, statistical analysis, and data visualization. Further, it has dashboards and scorecards to monitor the organizations performance on multiple metrics and key performance indicators KPIs.
You must be logged in to download this presentation.
 Impress your
 audience
Editable
of Time
PowerPoint presentation slides
Presenting Digital Transformation for Data Driven Decision Making. These slides are 100 percent made in PowerPoint and are compatible with all screen types and monitors. They also support Google Slides. Premium Customer Support is available. Suitable for use by managers, employees, and organizations. These slides are easily customizable. You can edit the color, text, icon, and font size to suit your requirements.
People who downloaded this PowerPoint presentation also viewed the following :
Content of this Powerpoint Presentation
Slide 1
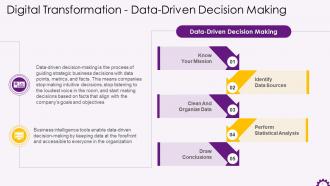
This slide depicts data-driven decision-making information. It emphasizes that data-driven decision-making uses data points, metrics, and facts to guide strategic business decisions. It also mentions that business intelligence tools gives you data, accessible to everyone, that enable decisions to be made.
Slide 2
This slide showcases the steps of Data-Driven Decision Making. The steps include understanding context, defining KPIs, visualizing, action plan, prioritizing decision, executing, analyzing results, learning from them and changing your action plan.
Slide 3
This slide depicts the benefits of data-driven decision-making. The benefits include valuable insights, continuous growth growth, improved program outcomes, prediction of future trends, and actionable insights.
Slide 4
This slide depicts Business Intelligence (BI) in the data age. It highlights that business intelligence can assist organizations in making better decisions. Experts can use business intelligence to provide performance and competitor benchmarks, allowing smoother running of the organization, with improved efficiency.
Instructor’s Notes: Developments in Business Intelligence are:
- Data mining: Discovering trends in large datasets using databases, statistics, and machine learning
- Performance metrics and benchmarking: Comparing current performance data to historical data aids in measuring performance against goals, which is typically accomplished through customized dashboards
- Descriptive analytics: Using preliminary data analysis to determine what happened
- Querying: Business intelligence extracts the answers to data-specific questions from the data set
- Statistical analysis: Taking descriptive analytics results and further exploring the data with statistics to determine how and why this trend occurred
- Data visualization: Data analysis is transformed into visual representations such as charts, graphs, and histograms to make data easier to consume
- Visual analysis: Exploration of data through visual storytelling to communicate insights
- Data preparation: Compiling multiple data sources, identifying dimensions and measurements, and preparing the data for analysis
Slide 5
This slide depicts the digital transformation metrics and success KPIs. Success metrics include innovation rate, customer advocacy, data capitalization, digital operations, and work and labor supply. The KPIs are Financial KPI, Business KPI and Operational KPI.
Slide 6
This slide illustrates the digital transformation scorecard. The digital transformation scorecard has values for customers, business leaders, and IT leaders.
Slide 7
This slide illustrates the business intelligence KPI dashboard with sales by a representative, revenue by type, customer distribution, etc., as its elements.
Slide 8
This slide depicts the Data-Driven Decision-Making Dashboard. It highlights the revenue and customer overview for Q1 2022.
Digital Transformation For Data Driven Decision Making Training Ppt with all 24 slides:
Use our Digital Transformation For Data Driven Decision Making Training Ppt to effectively help you save your valuable time. They are readymade to fit into any presentation structure.
-
Love how there are no boring templates here! The design is fresh and creative, just the way I like it. Can't wait to edit and use them for my extended projects!
-
Great experience, I would definitely use your services further.


