Crm Life Cycle Phases And Project Management Powerpoint Presentation Slides
If you are wonderstruck on how to make crm and project management presentation, then look on further just try our ready-made 70 slides Crm Life Cycle Phases And Project Management Powerpoint Presentation Slides deck example. A customer relationship management system is necessary for any business or company that aims to succeed and grow steadily. This project life cycle phases PPT templates will help you on various stages of the cycle such as customer initiatives, customer focus, core vs extended customer service, customer perceived value, transaction vs relationship marketing, CRM model, customer lifecycle management, CRM components, process of E-CRM, CRM capabilities, CRM dashboard etc. It helps you to determine the impact of your customer relationship management program. You can also utilize this customer relationship presentation sample to get acquainted with similar topics. This project management life cycle presentation PPT sample also has slides like current lead status, leads by source, deals by expected close date, lead acquisition & deal acquisition, top Customers, marketing dashboard, intranet dashboard, and various types of bar graphs like stacked column, line chart, pie charts etc. just to name a few. A great crm strategy means customer satisfaction and tons of revenue for your company. If you wish to easily establish contact and maintain long-term relationship with your clients, then download our Crm Life Cycle Phases And Project Management Powerpoint Presentation Slides. Our Crm Life Cycle Phases And Project Management Powerpoint Presentation Slides encourage forward looking ideas. Keep the audience focused ahead.
You must be logged in to download this presentation.
 Impress your
 audience
Editable
of Time
PowerPoint presentation slides
Presenting Crm Life Cycle Phases And Project Management PowerPoint Presentation Slides. Set of 70 PowerPoint Slides and professional layouts. When you download the PPT, you get the deck in both widescreen (16:9) and standard (4:3) aspect ratio. This ready-to-use PPT comprises visually stunning PowerPoint templates, vector icons, images, data-driven charts and graphs and business diagrams. The PowerPoint presentation is 100% editable. Customize the presentation background, font, and colors as per your company’s branding. The slide templates are compatible with Google slides, PDF and JPG formats.
People who downloaded this PowerPoint presentation also viewed the following :
Content of this Powerpoint Presentation
Slide 1: This slide introduces CRM Life Cycle Phases and Project Management. State your company name and begin.
Slide 2: This slide showcases Agenda. You can add/ edit the agenda of your company.
Slide 3: This slide states the Importance of Customer Initiatives with the following points- Reduce costs, Leverage investments, Enhance products & services, Enhance executive decision making, Reach the customer, Participate in global village, Remain in business, Increase revenue, Optimize resources & minimize costs.
Slide 4: This slide presents Customer is the Focus framework with the following components- Customer, Strategy, People, Systems, Process, Structure.
Slide 5: This is Core vs Extended Customer Service graph slide. It shows Customer Expectation and Perceived Value with the following five parameters- Failing, Unsatisfactory, Satisfactory, Out Standing, Exceeds Expectations.
Slide 6: This slide showcases Customer Perceived Value with Total Customer Benefit and Total Customer Cost.
Slide 7: This slide presents Emphasis on Customer Transaction with text boxes.
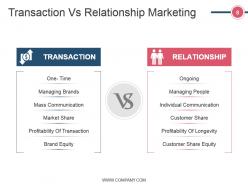
Slide 8: This is Transaction Vs Relationship Marketing slide. Use it to compare these two aspects- TRANSACTION, RELATIONSHIP.
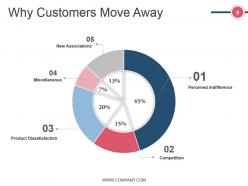
Slide 9: This slide shows reasons Why Customers Move Away in a pie chart/ graph form. These reasons are categorized as- Competition, Miscellaneous, New Associations, Perceived Indifference, Product Dissatisfaction.
Slide 10: This slide shows the Economics of Customer Retention with these three points- Cost of retaining current customer, Cost of acquiring new customer, Cost of retaining current customer.
Slide 11: This slide showcases CRM Model with the following stages- Interact & Deliver, Develop & Customer, Understand & Differentiate, Acquire & Retain.
Slide 12: This slide shows Customer Lifecycle Management with these four important points- Customer Retention And Referrals For New Customers, Customer Equity Leverage Through Cross Selling , And Up Selling, Customer Need Assessment And Acquisition, Customer Development Through Personalization And Customization,
Slide 13: This slide showcases the Stages of CRM listed as- Collecting Information, Storing Information, Accessing Information, Analyzing Customer Behavior, Marketing More Effectively, Enhancing The Customer Experience.
Slide 14: This slide states CRM Components with its Various System. These include- Customer Sales, Customer Marketing, Customer Field Service, Customer Service, Customer Analysis & Reporting.
Slide 15: This slide showcases the Process of E-CRM in a circular form with arrow imagery.
Slide 16: This slide showcases the CRM Process with the following ten aspects to consider- Close Order Process, Define Expectations, Deliver on Expectations, Support, Negotiate, Marketing, Prospecting Web, Qualify, Design Engineer, Specify, Propose Quote, Collections Receivables.
Slide 17: This slide shows the steps of Basic CRM and Enhanced CRM- Service Delivery, Order, Quote, Meet, Repurchase, Support, Lead, Prospect, Quality,
Slide 18: This slide shows CRM Capabilities with respect to- Marketing, Support, Orders, Sales.
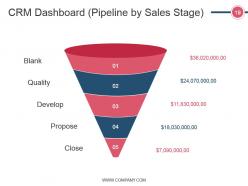
Slide 19: This slide presents a five level CRM Dashboard (Pipeline by Sales Stage) with the following levels- Blank, Quality, Develop, Propose, Close.
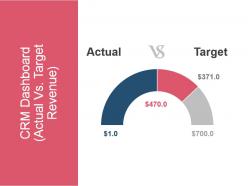
Slide 20: This slide displays CRM Dashboard stating a comparison between Actual and Target Revenue
Slide 21: This is a Coffee break slide. You can change the slide content as per need.
Slide 22: This slide showcases CRM Dashboard (Opportunity by Rating) in a graphical form.
Slide 23: This slide shows CRM Dashboard (Current Lead Status) in a bar graph/ chart form.
Slide 24: This is CRM Dashboard (Leads by Source) slide showing- Advertisement, Email Campaign, Exhibition, Online Site.
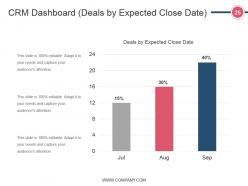
Slide 25: This slide shows CRM Dashboard (Deals by Expected Close Date) in a bar chart/ graph form.
Slide 26: This slide showcases CRM Dashboard (Lead Acquisition & Deal Acquisition). Use it to state Lead Acquisition and Deal Acquisition.
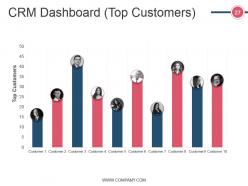
Slide 27: This slide showcases CRM Dashboard (Top Customers) in a bar chart/ graph image form. Use it to state your Top Customers.
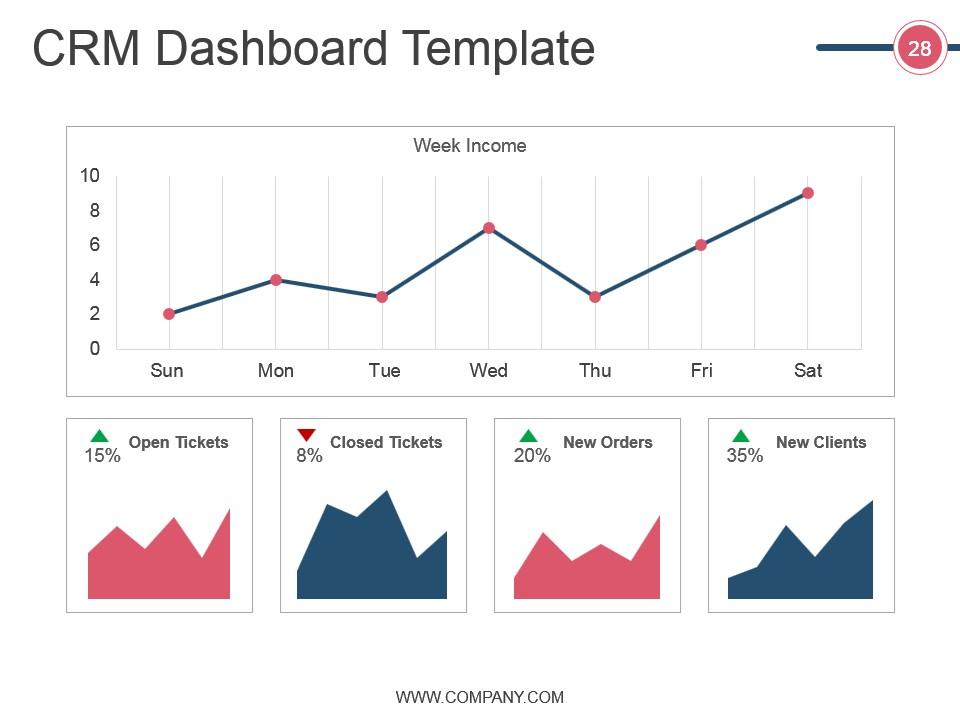
Slide 28: This slide shows CRM Dashboard Template in charts and graphs.
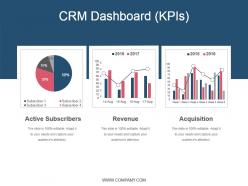
Slide 29: This slide displays CRM Dashboard (KPIs) in charts and graphs. Use it to show- Active Subscribers, Revenue, Acquisition.
Slide 30: This slide showcases CRM (Sales Rep Dashboard) in charts and graphs.
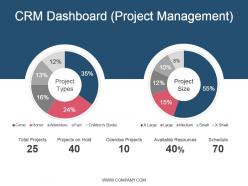
Slide 31: This is CRM Dashboard (Project Management) slide showing- Project Types, Project Size.
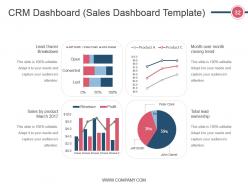
Slide 32: This slide shows CRM Dashboard (Sales Dashboard Template) in charts and graphs.
Slide 33: This slide shows CRM Dashboard (This Year Sales Vs. Last Year Sales).
Slide 34: This slide showcases CRM (Marketing Dashboard). Use it to graphically present- Leads This Week (Query) Target (50), Leads Per Week.
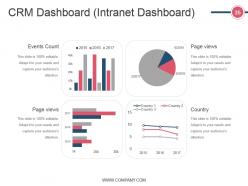
Slide 35: This slide displays CRM Dashboard (Intranet Dashboard) in charts and graphs.
Slide 36: This slide is titled Bar Graph.
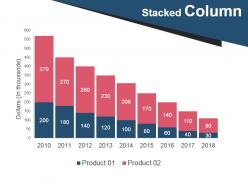
Slide 37: This is a Stacked Column graph slide to show product/ entity comparison, specifications etc.
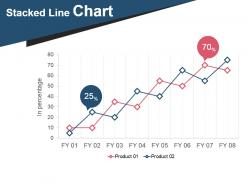
Slide 38: This is a Stacked Line Chart slide to show product/ entity comparison, specifications etc.
Slide 39: This is a Pie Chart slide to show product/ entity comparison, specifications etc.
Slide 40: This is a Stacked Line Chart slide to show product/ entity comparison, specifications etc.
Slide 41: Area Chart
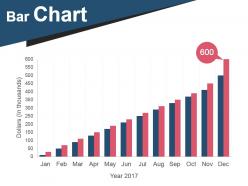
Slide 42: This slide showcases Bar Chart. Compare the products with this.
Slide 43: This is a Scatter Bubble Chart slide to show product/ entity comparison, specifications etc.
Slide 44: This is a Combo Chart slide to show information, comparison specifications etc.
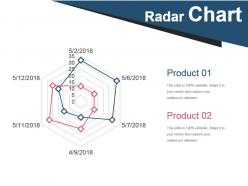
Slide 45: This is a Radar Chart slide to show product/ entity comparison, specifications etc.
Slide 46: This slide is titled Additional Slides to move forward. You can change the slide content as per need.
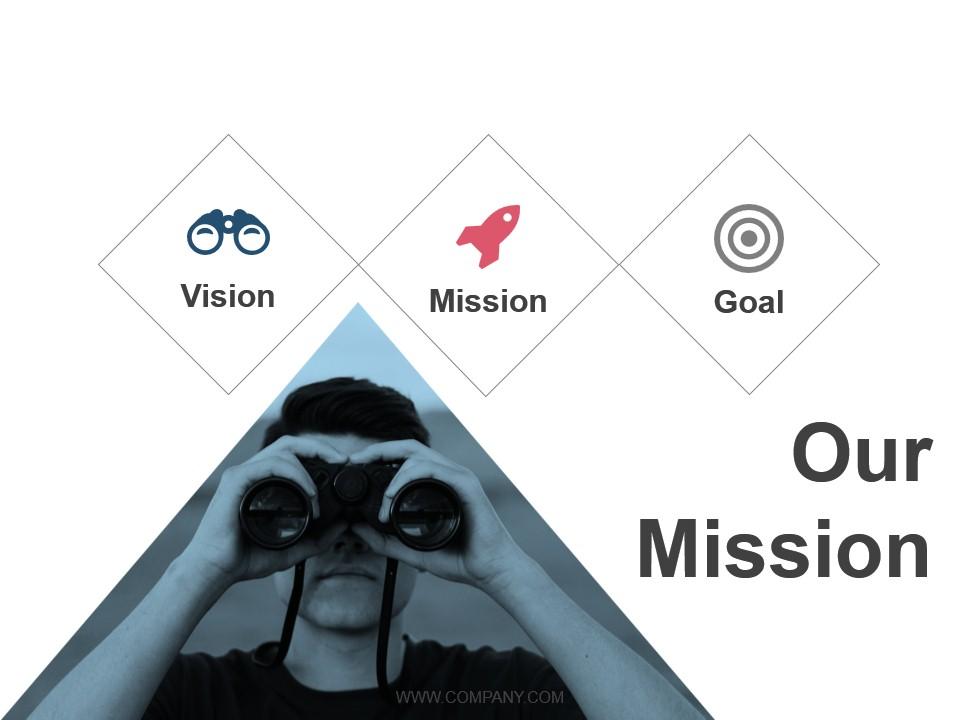
Slide 47: This slide showcases Our Mission. Show your company mission and goals here.
Slide 48: This is Meet Our Team slide with name, designation and image boxes.
Slide 49: This is an About Us slide. State team/ company specifications here.
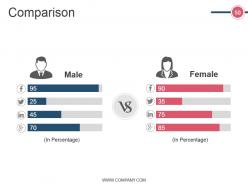
Slide 50: This slide showcases Comparison of two entities in male female chart imagery form.
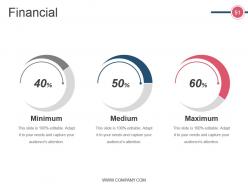
Slide 51: This is a Financial score slide. State financial aspects, information etc. here.
Slide 52: This is a Quotes slide to convey company/ organization message, beliefs etc. You may change the slide content as per need.
Slide 53: This is a Dashboard slide to show information in percentages etc.
Slide 54: This is a Location slide to show global growth, presence etc. on a world map image.
Slide 55: This slide presents a Timeline to show growth, milestones etc.
Slide 56: This slide also presents a Timeline to show growth, milestones etc.
Slide 57: This slide displays Post It Notes to mark events, important information etc.
Slide 58: This is a Newspaper slide to highlight something or add memorabilia.
Slide 59: This is a Puzzle pieces image slide to show information, specifications etc.
Slide 60: This is a Target slide. State targets, etc. here.
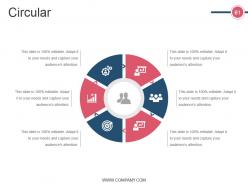
Slide 61: This is a Circular image slide. State specifications, information here.
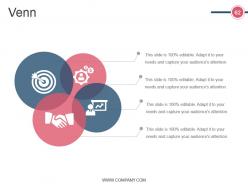
Slide 62: This is a Venn diagram image slide to show information, specifications etc.
Slide 63: This is a LEGO slide with text boxes to show information.
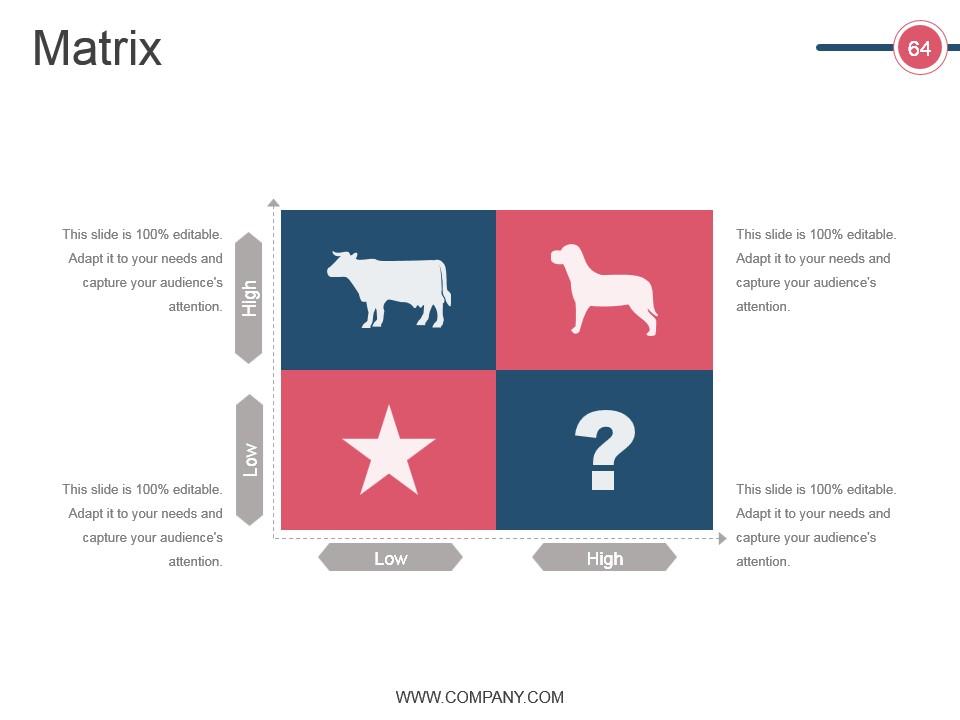
Slide 64: This is a Matrix slide to show information, specifications etc.
Slide 65: This is a Mind Map image slide to show behavioral segmentation, information or anything relative.
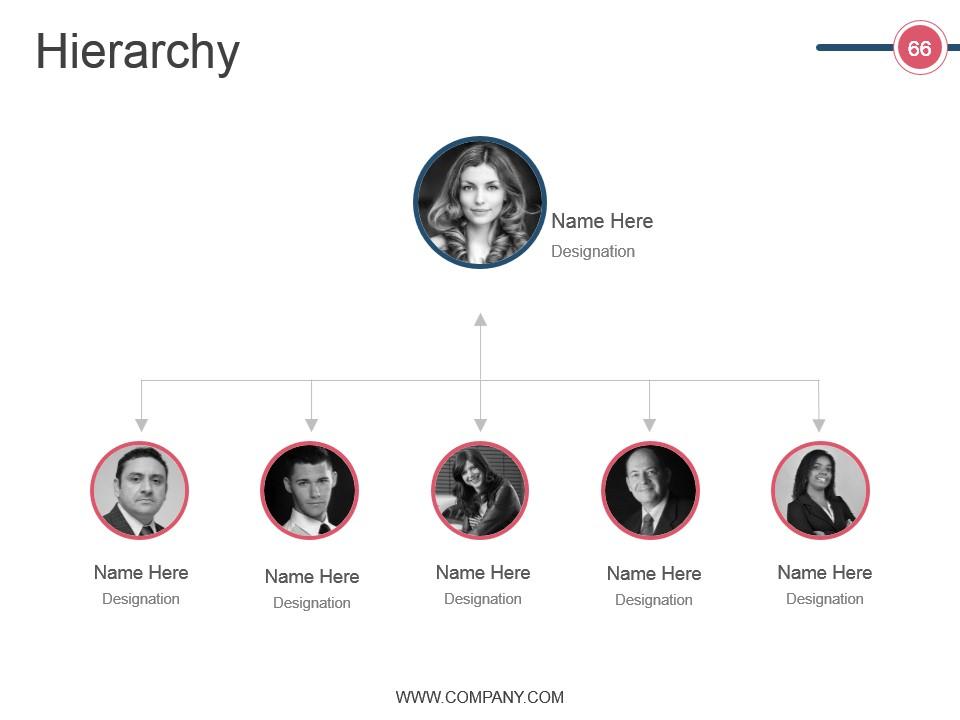
Slide 66: This is a Hierarchy slide to show information, organization structural specifications etc.
Slide 67: This is a Bulb & Idea image slide to show ideas, innovative information etc.
Slide 68: This is a Magnifying Glass image slide to show information, specifications etc.
Slide 69: This is a Funnel image slide to show information, funneling aspects, specifications etc.
Slide 70: This is a Thank You image slide with Address, Email and Contact number.
Crm Life Cycle Phases And Project Management Powerpoint Presentation Slides with all 70 slides:
Instigate good growth with our Crm Life Cycle Phases And Project Management Powerpoint Presentation Slides. Be a catalyst for impressive development.
-
Perfect template with attractive color combination.
-
Designs have enough space to add content.


