49939064 style essentials 2 compare 2 piece powerpoint presentation diagram infographic slide
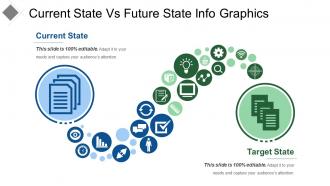
Connect with your audience through our, current state vs future state info graphics. A plathora of business icons are shown here connecting two stages shown, current state and future state. Elaborate your current goal and compare them with your future statistics. Get a better idea of where you can improve. Set your hard work apart and explore through contextualized text-based notes. Include better ideas in your current process, seal the leaks, meet deadlines and keep a track on your progress. Here at Slide Team, we are ceaselessly working on better ideas for producing superior results and walking a step to step with the technology. Current state vs future state info graphics PPT image slide will heighten the quality of your presentations Fashion a connection with your audience. Let our Current State Vs Future State Info Graphics dress up your thoughts.
You must be logged in to download this presentation.
 Impress your
 audience
Editable
of Time
PowerPoint presentation slides
Presenting, current state vs future state info graphics. Edit the icons used n the PPT template. Use of high-resolution images, and computer technology layout. Filled with styles and effects to create an impact. Can be quickly converted into JPEG/JPG or PDF formats as per the requirements. Compatible with google slides. Project to a widescreen without worrying about pixelating. compatible with google slides and can be instantly downloaded with just a click.
49939064 style essentials 2 compare 2 piece powerpoint presentation diagram infographic slide with all 5 slides:
Our Current State Vs Future State Info Graphics are really kosher. They are descendants of a pure lineage.
-
Excellent products for quick understanding.
-
Best Representation of topics, really appreciable.


