43024967 style essentials 2 compare 2 piece powerpoint presentation diagram infographic slide
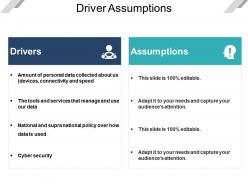
Drive the operational and financial results of the business by employing Driver assumptions slideshow. Represent the common business drivers with the help of the flow chart present in the PPT slide. Describe how drivers impact the financial aspects of the business such as revenues, expenses, capital and costs using this business operator PPT visual. Also, showcase how to determine the business driver utilizing this effective PowerPoint graphic. Give an idea about the operational drivers in business such as salespeople, the number of stores, website traffic, number and price of products sold, units of production, etc. monitor the results of the business and make strategic decisions to improve performance in the future by taking advantage of this effective PPT layout. You can generate a report on business drivers with the help of impressive charts and graphs present in the slideshow. Thus, helps executives and key decision-makers envisage what’s happening in the business by downloading this readily available business analysis PowerPoint Presentation.
You must be logged in to download this presentation.
 Impress your
 audience
Editable
of Time
PowerPoint presentation slides
Presenting Driver Assumptions Presentation. You can alter the font size, font type, font color, and shape used according to your needs as this PPT layout is 100% customizable. This slide is easy to download and can be opened and saved in various formats like JPG, PDF, and PNG. This PowerPoint template is Google Slides compatible and is easily accessible.
43024967 style essentials 2 compare 2 piece powerpoint presentation diagram infographic slide with all 5 slides:
Experience goodness with our Driver Assumptions. They conform to the best criteria.
-
Enough space for editing and adding your own content.
-
Unique and attractive product design.


