13800134 style essentials 2 compare 2 piece powerpoint presentation diagram infographic slide
Establish faith with our Current State Vs Future State With The Graphical Representation. They will generate belief in the audience.
You must be logged in to download this presentation.
 Impress your
 audience
Editable
of Time
PowerPoint presentation slides
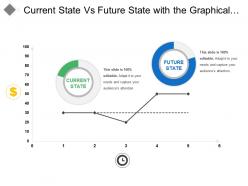
Presenting this set of slides with name - Current State Vs Future State With The Graphical Representation. This is a two stage process. The stages in this process are Before After, Current Vs Future, Past Present Future.
Content of this Powerpoint Presentation
Description:
The image depicts a PowerPoint slide titled "Current State Vs Future State with the Graphical..." which suggests it's a comparative analysis presentation slide. It features a line graph with two significant markers labeled "CURRENT STATE" and "FUTURE STATE," each accompanied by a circular progress or status indicator. The "CURRENT STATE" is indicated with a partially filled gauge, while the "FUTURE STATE" is shown with a more complete gauge, suggesting improvement or growth.
Use Cases:
This slide can be used across multiple industries for various purposes:
1. Financial Services:
Use: Showing financial growth projections.
Presenter: Financial Analyst
Audience: Investors, company executives
2. Healthcare:
Use: Depicting health outcomes improvement over time.
Presenter: Healthcare Administrator
Audience: Medical staff, health policymakers
3. Education:
Use: Illustrating progress in educational achievements or initiatives.
Presenter: Educational Consultant
Audience: Educators, school boards
4. Technology:
Use: Demonstrating technological advancements from current to future capabilities.
Presenter: Tech Company Executive
Audience: Investors, tech team
5. Real Estate:
Use: Presenting market value appreciation forecasts.
Presenter: Real Estate Analyst
Audience: Investors, real estate agents
6. Marketing:
Use: Comparing current and projected brand reach.
Presenter: Marketing Director
Audience: Marketing team, stakeholders
7. Manufacturing:
Use: Outlining efficiency gains from current operations to future improvements.
Presenter: Operations Manager
Audience: Production staff, management team
13800134 style essentials 2 compare 2 piece powerpoint presentation diagram infographic slide with all 5 slides:
Bring about clarity of actual intentions with our Current State Vs Future State With The Graphical Representation. Decipher the journalese involved.
-
I discovered this website through a google search, the services matched my needs perfectly and the pricing was very reasonable. I was thrilled with the product and the customer service. I will definitely use their slides again for my presentations and recommend them to other colleagues.
-
Much better than the original! Thanks for the quick turnaround.


