86383110 style essentials 2 dashboard 1 piece powerpoint presentation diagram infographic slide
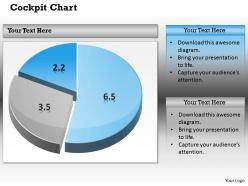
Check our pie chart dashboard design PPT slide. There are a variety of different kinds of business dashboards that you can use to display the information compiled in your reports. Pie charts are used for making comparisons and showing proportions. These are very effective when you visually compare a few categories. Our PowerPoint graphic makes it extremely easy to convert information into pie chart. The slide has a 3D pie chart which is linked to an excel sheet. So, you can change the values of the pie slides as per the information you want to represent. Also, ample space has been provided beside the chart so that you can enter important points related to the pie chart and its categories. This presentation diagram assists you to display your financial information in the best possible manner. If you want to check more pie chart dashboards then you can visit our website as there are many related and similar PPT designs. Give your audience a fulfilling experience. They will find our 0314 Pie Chart Dashborad Design elevating.
You must be logged in to download this presentation.
 Impress your
 audience
Editable
of Time
PowerPoint presentation slides
Makes the information clear in the mind of the audience. Editable visuals, colors and text. Easy to edit and customize as per your needs. Beneficial for industry professionals, technologists, managers, executives, researchers, sales people, etc. Flexible presentation designs can be presented in standard and widescreen view. Has a futuristic and realistic approach. Privilege of insertion of logo and trademarks for more personalization.
86383110 style essentials 2 dashboard 1 piece powerpoint presentation diagram infographic slide with all 3 slides:
Our 0314 Pie Chart Dashborad Design put you in the forefront. Your innovative thoughts will make an impact.
-
Use of icon with content is very relateable, informative and appealing.
-
Much better than the original! Thanks for the quick turnaround.


