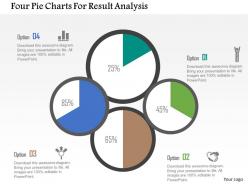
62390824 style division pie 4 piece powerpoint presentation diagram infographic slide
Pie charts are undoubtedly one of the best ways to communicate the information which has various sections and sub sections attached to it. The four pie charts for result analysis flat PowerPoint design have four circles with individual colorful sections created on the sphere, representing varied topics. Apart from this, PowerPoint icons have been used as visuals to depict what each circle represents. Talk about your sales percentages or market share or percentage contribution of each department of the organization and many such topics which otherwise become very complicated when it comes to sharing them with the team. Turn away from boring presentations. With compelling Four Pie Charts For Result Analysis Flat Powerpoint Design your ideas will take flight.
You must be logged in to download this presentation.
 Impress your
 audience
Editable
of Time
PowerPoint presentation slides
High quality visuals with splendid resolution. 100 percent editable PPT slide templates. Aesthetically designed and professionally proficient. Include or exclude the slide content at your ease and requirement. Compatible with several software options. Harmonious with numerous format options life JPEG, JPG or PDF. Ease of personalization with your company specific name, logo and or trademark.
62390824 style division pie 4 piece powerpoint presentation diagram infographic slide with all 5 slides:
Our Four Pie Charts For Result Analysis Flat Powerpoint Design ensure you never go over their heads. They make comprehension a certainty.
-
I discovered this website through a google search, the services matched my needs perfectly and the pricing was very reasonable. I was thrilled with the product and the customer service. I will definitely use their slides again for my presentations and recommend them to other colleagues.
-
Use of different colors is good. It's simple and attractive.


