Business operations cycles powerpoint presentation slides
Finding difficulty in managing financial and operating plans for your business? Not to worry! We present you professionally created business operations cycles PowerPoint presentation slides. This content ready pre-designed business management cycle presentation design covers many significant topics like company mission & vision, changes in competitive environment, current sources of revenue, company milestone, key performance indicators, financial summary, new customer acquisition cost, customer lifetime value, gross margin improvement, operating plan, hiring plan, team goals, risk management strategies, operating cost, product roadmap and many more. Not just this, by using these organizational process PPT presentation templates you can also create various other related topics like organizational process, operational development process, strategic development, company management process, strategic operations, trade process etc. So what are you waiting for? It only takes seconds to download our business operations cycles PPT graphics. Our PowerPoint designs are best in class. Bask in the applause your ideas generate with our Business Operations Cycles Complete Powerpoint Deck With Slides. You will enjoy your innings.
You must be logged in to download this presentation.
 Impress your
 audience
Editable
of Time
PowerPoint presentation slides
Fully editable graphics. 52 deeply researched slides are available to download. This PPT is suitable with standard as well as widescreen devices. Can be opened using Google Slides. Suitable for businessmen, start-ups, industrialists. Instantly downloadable with just a single click. Premium Customer Support provided.The stages in this process are strategic planning, operational plan, operational planning process, operation cost.
People who downloaded this PowerPoint presentation also viewed the following :
Content of this Powerpoint Presentation
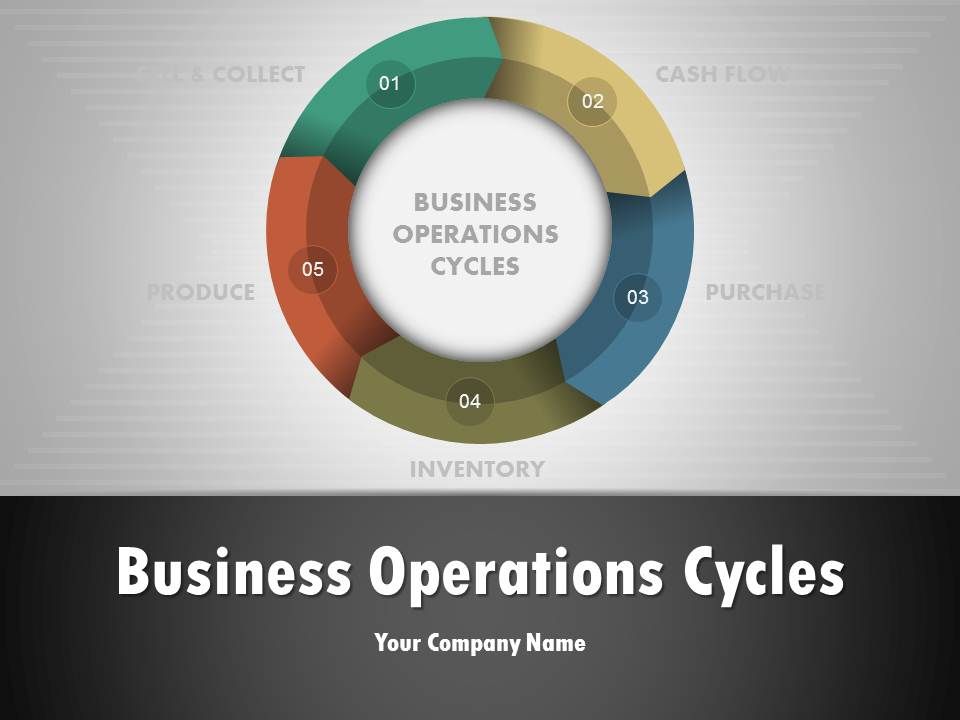
Slide 1: This slide introduces Business Operational Concept And Structure. State Your Company Name and get started.
Slide 2: This slide presents Executive Summary with the following points- Business problem, Solutions, Key to success, Competitors.
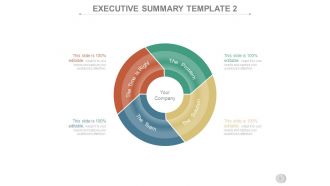
Slide 3: This slide showcases Executive Summary with the following points- The Problem, The Solution, The Team, The Time Is Right.
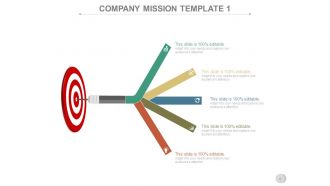
Slide 4: This slide shows Company Mission. State it here.
Slide 5: This slide shows Company Mission with a world map background. State it here.
Slide 6: This slide showcases Company Mission. State your mission here.
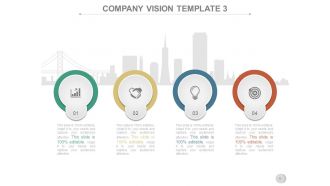
Slide 7: This slide presents Company Vision. State your vision here.
Slide 8: This slide also presents Company Vision. State your vision here.
Slide 9: This slide presents another variation of Company Vision. State your vision here.
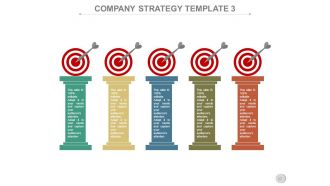
Slide 10: This slide showcases Company Strategy. List down your strategies here.
Slide 11: This slide too presents Company Strategy. List down your strategies here.
Slide 12: This slide also displays another variation of Company Strategy. List down your strategies here.
Slide 13: This slide displays Changes In Competitive Environment in terms of different brands with engagement calculations.
Slide 14: This slide shows Changes In Competitive Environment in table form.
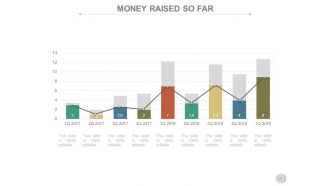
Slide 15: This slide shows a graph for Money Raised So Far.
Slide 16: This slide displays Current Sources Of Revenue in pie chart image form.
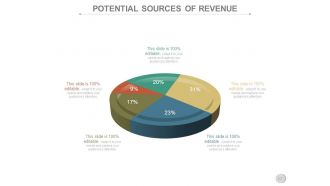
Slide 17: This slide lists Potential Sources Of Revenue in pie chart image form.
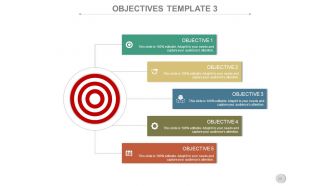
Slide 18: This slide displays Objectives For Next 12 Months. State them here.
Slide 19: This slide displays Objectives. State them here.
Slide 20: This is an Objectives slide. State them here.
Slide 21: This slide displays Company Milestones. State them here.
Slide 22: This is another slide displaying Company Milestones. State them here.
Slide 23: This slide also displaying Company Milestones. State them here.
Slide 24: This slide shows Key Performance Indicators.
Slide 25: This slide also shows Key Performance Indicators in a different variation.
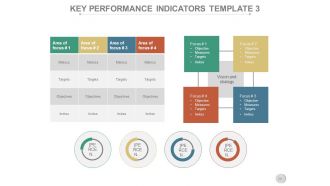
Slide 26: This slide displays Key Performance Indicators with area of focus.
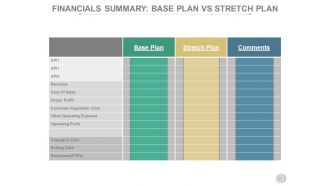
Slide 27: This slide shows Financials Summary: Base Plan Vs Stretch Plan
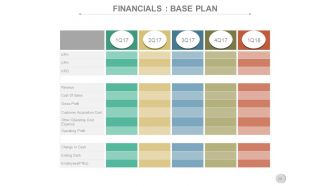
Slide 28: This slide shows Financials : Base Plan.
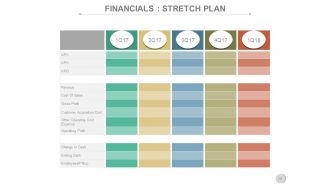
Slide 29: This slide displays Financials : Stretch Plan
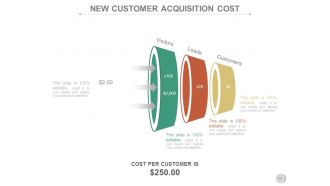
Slide 30: This slide displays New Customer Acquisition Cost in funnel form.
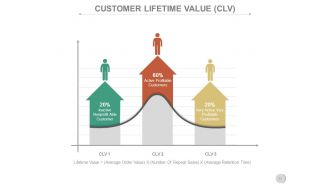
Slide 31: This slide presents Customer Lifetime Value (CLV) with- Active Profitable Customers, Very Active Very Profitable Customers, Inactive Nonprofit Able Customer.
Slide 32: This slide showcases Calculating Customer Lifetime Value (CLV).
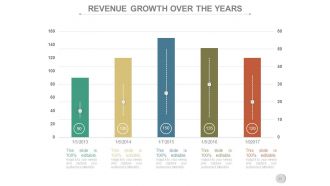
Slide 33: This slide presents Revenue Growth Over The Years in graph form.
Slide 34: This slide shows Gross Margin Improvement in graph form.
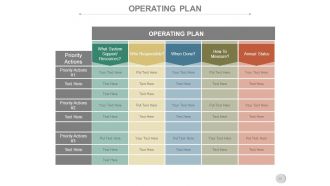
Slide 35: This slide showcases an Operating Plan.
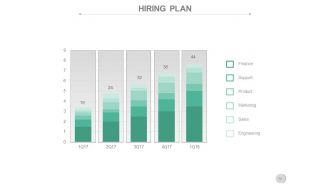
Slide 36: This slide shows a Hiring Plan.
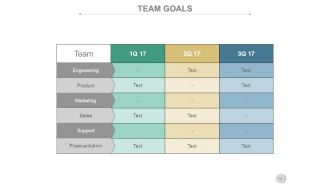
Slide 37: This slide displays Team Goals with team mate names, objective.
Slide 38: This slide presents Team Goals to state and pursue.
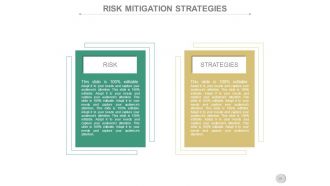
Slide 39: This slide presents Risk Mitigation Strategies with Risk and Strategies as main sub headings.
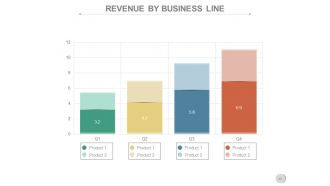
Slide 40: This slide showcases Revenue By Business Line of different products.
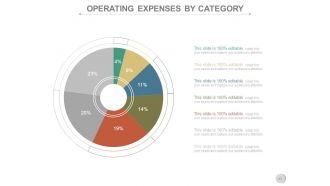
Slide 41: This slide shows Operating Expenses By Category.
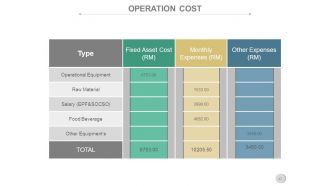
Slide 42: This slide displays Operation Cost.
Slide 43: This slide shows Cash Position By Quarter (four quarters).
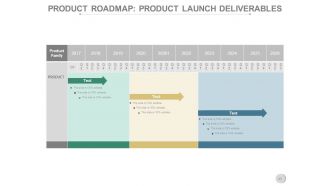
Slide 44: This slide showcases Product Roadmap: Product Launch Deliverables. State your deliverables with their respective timings here.
Slide 45: This slide also showcases Product Roadmap: Product Launch Deliverables. State your deliverables with their respective timings here.
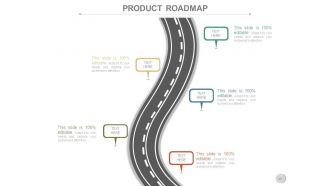
Slide 46: This slide showcases a Product Roadmap.
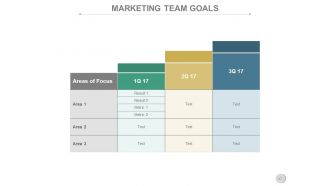
Slide 47: This slide shows Marketing Team Goals for three areas and three quarters.
Slide 48: This slide shows Engineering Team Goals for three quarters and three areas.
Slide 49: This slide is titled Additional Slides to proceed forward. You mayc change as per need.
Slide 50: This is a Quotes slide. State a quote here or anything you want to convey.
Slide 51: This slide displays a Dashboard with percentages.
Slide 52: This is a Thanks For Watching slide with Contact Numbers, Email Address, and Address.
Business operations cycles powerpoint presentation slides with all 53 slides:
Bring an end to any adverse influences on the group with our Business Operations Cycles Complete Powerpoint Deck With Slides. Identify demoralising elements.
-
Great designs, Easily Editable.
-
Design layout is very impressive.
-
Informative design.
-
Qualitative and comprehensive slides.


