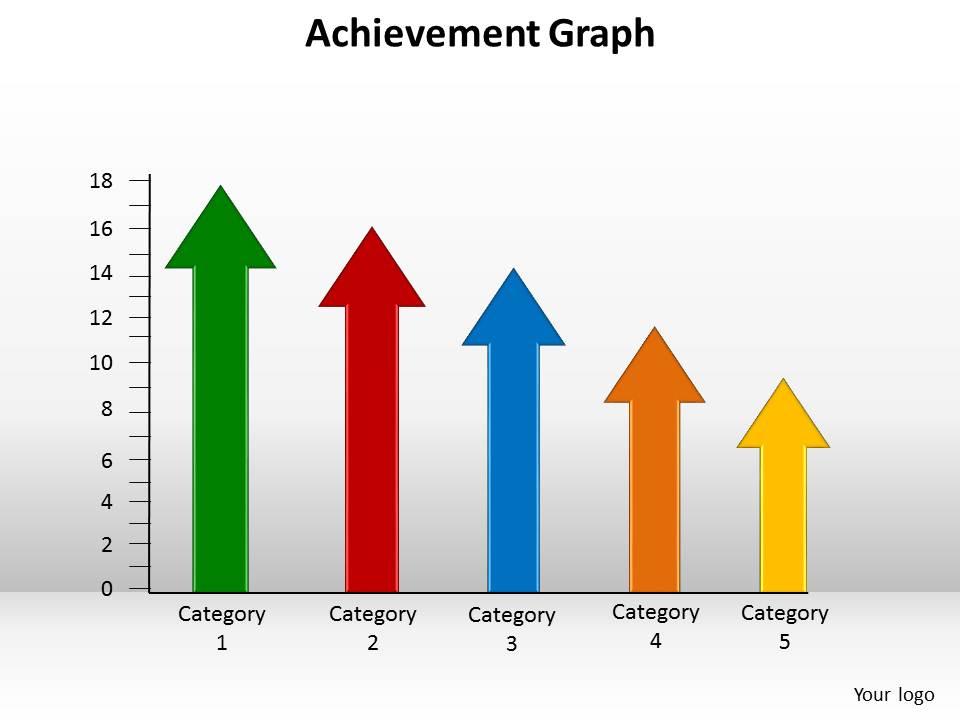
Achievement graph
Our Achievement Graph will let your ideas bloom. Create a bed of roses for your audience.
You must be logged in to download this presentation.
 Impress your
 audience
Editable
of Time
PowerPoint presentation slides
This template is skillfully designed and is completely editable to suit all the needs and requirements of the user. The color of the font, its size, style, and all other elements can be customized according to the user's desire The text in the PPT placeholder can be replaced with the desired information making this template highly flexible and adaptable as well. This template is also compatible with various Microsoft versions and formats like Google Slides, JPG, PDF, etc so the user will face no issue in saving it in the format of his choice.
People who downloaded this PowerPoint presentation also viewed the following :
Content of this Powerpoint Presentation
Description:
The image depicts a colorful "Achievement Graph" with five upward pointing arrows of varying colors (green, red, blue, darker orange, and yellow) over a simple bar graph that lacks actual bars. The arrows represent the different categories, denoted as "Category 1" through "Category 5," which can be assumed to correspond to different metrics or performance areas. The base of each arrow starts at zero on the Y-axis and points to various heights on the graph, suggesting different levels of achievement across the categories. The Y-axis is numbered from 0 to 18, allowing viewers to quantify the achievements associated with each category. The X-axis, reserved for the categories, splits the data into five distinct areas for comparison. In the top right corner, there is a placeholder for "Your logo," indicating that the slide can be customized for a particular company or presentation.
Use Cases:
This Achievement Graph appears relevant and versatile enough to be used across multiple industries for showcasing performance metrics, growth, or target achievement.
1. Sales:
Use: Performance review of sales team.
Presenter: Sales Manager.
Audience: Sales Representatives.
2. Marketing:
Use: Tracking campaign effectiveness.
Presenter: Marketing Analyst.
Audience: Marketing Team.
3. Education:
Use: Displaying student achievement across different subjects.
Presenter: School Administrator.
Audience: Educators and Parents.
4. Finance:
Use: Visualizing financial targets vs. achievements.
Presenter: Financial Analyst.
Audience: Stakeholders.
5. Manufacturing:
Use: Illustrating production goals vs. actual output.
Presenter: Operations Manager.
Audience: Production Staff.
6. Healthcare:
Use: Comparing patient outcomes by treatment category.
Presenter: Healthcare Administrator.
Audience: Medical Professionals.
7. Retail:
Use: Comparing sales achievements across product categories.
Presenter: Store Manager.
Audience: Retail Associates and Management Team.
Achievement graph with all 5 slides:
Build relationships with our Achievement Graph. Your team will start reaching out to you.
-
I discovered this website through a google search, the services matched my needs perfectly and the pricing was very reasonable. I was thrilled with the product and the customer service. I will definitely use their slides again for my presentations and recommend them to other colleagues.
-
Nice and innovative design.


