Powerpoint Templates and Google slides for Set Measures Kpi
Save Your Time and attract your audience with our fully editable PPT Templates and Slides.
-
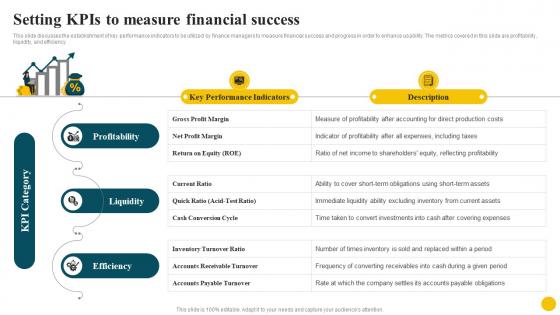
 Setting Kpis To Measure Financial Success Resolving Corporate Issues
This slide discusses the establishment of key performance indicators to be utilized by finance managers to measure financial success and progress in order to enhance usability. The metrics covered in this slide are profitability, liquidity, and efficiency. Introducing Setting Kpis To Measure Financial Success Resolving Corporate Issues to increase your presentation threshold. Encompassed with two stages, this template is a great option to educate and entice your audience. Dispence information on Key Performance Indicators, Profitability, Liquidity, using this template. Grab it now to reap its full benefits.
-
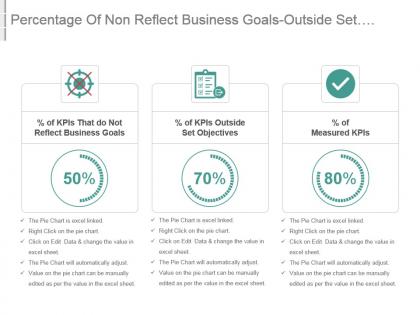
 Percentage of non reflect business goals outside set objectives measured kpis ppt slide
Presenting percentage of non reflect business goals outside set objectives measured kpis ppt slide. This presentation slide shows three Key Performance Indicators or KPIs in a Dashboard style design. The first KPI that can be shown is percentage of KPIs That do Not Reflect Business Goals. The second KPI is percentage of KPIs Outside Set Objectives and the third is percentage of Measured KPIs. These KPI Powerpoint graphics are all data driven, and the shape automatically adjusts according to your data. Just right click on the KPI graphic, enter the right value and the shape will adjust automatically. Make a visual impact with our KPI slides.
-
 Percentage of set objectives measurement cost automatically measured kpis powerpoint slide
Presenting percentage of set objectives measurement cost automatically measured kpis powerpoint slide. This presentation slide shows three Key Performance Indicators or KPIs in a Dashboard style design. The first KPI that can be shown is percentage of KPIs Within Set Objectives. The second KPI is Cost of KPI Measurement and the third is percentage of KPIs That are Automatically Measured. These KPI Powerpoint graphics are all data driven, and the shape automatically adjusts according to your data. Just right click on the KPI graphic, enter the right value and the shape will adjust automatically. Make a visual impact with our KPI slides.
-
 Steps To Set Up Facebook KPIs To Measure Performance
The following slide explains various stages to help company in defining relevant KPIs to reach specific business objectives. It includes levels such as mentioning KPI objectives, naming, communicating results, etc. Presenting our set of slides with Steps To Set Up Facebook KPIs To Measure Performance. This exhibits information on six stages of the process. This is an easy to edit and innovatively designed PowerPoint template. So download immediately and highlight information on Identifying Kpis, Communicating Results, Reviewing Kpis, Defining Cadence.
-
 Set KPIs For Measure Customer Communication And Engagement Performance
This slide shows the key performance indicators used to measure the performance of customer engagement strategies. Increase audience engagement and knowledge by dispensing information using Set KPIs For Measure Customer Communication And Engagement Performance. This template helps you present information on six stages. You can also present information on Reviews And Ratings, Referral Rates, Retention Rate, Customer Communication using this PPT design. This layout is completely editable so personaize it now to meet your audiences expectations.


