Powerpoint Templates and Google slides for Ratio
Save Your Time and attract your audience with our fully editable PPT Templates and Slides.
-
 Postal kpi for non employee total delivery ratio employee costs presentation slide
Presenting postal kpi for non employee total delivery ratio employee costs presentation slide. This presentation slide shows Three Key Performance Indicators or KPIs in a Dashboard style design. The first KPI that can be shown is Average Non Employee Costs Per Delivery. The second KPI is Total Cost of Delivery. The third is Ratio Employee Costs Versus Non employee Costs Per Delivery. These KPI Powerpoint graphics are all data driven, and the shape automatically adjusts according to your data. Just right click on the KPI graphic, enter the right value and the shape will adjust automatically. Make a visual impact with our KPI slides.
-
 Ratio fixed average corrective maintenance time variable costs kpi presentation slide
Presenting ratio fixed average corrective maintenance time variable costs kpi presentation slide. This presentation slide shows Three Key Performance Indicators or KPIs in a Dashboard style design. The first KPI that can be shown is Ratio Fixed Versus Variable Costs Per Truck. The second KPI is Average Corrective Maintenance Time Per Truck. The third is Average Variable Costs Per Truck. These KPI Powerpoint graphics are all data driven, and the shape automatically adjusts according to your data. Just right click on the KPI graphic, enter the right value and the shape will adjust automatically. Make a visual impact with our KPI slides.
-
 Airline kpi for corrective preventive maintenance time ratio corrective powerpoint slide
Presenting airline kpi for corrective preventive maintenance time ratio corrective powerpoint slide. This presentation slide shows three Key Performance Indicators or KPIs in a Dashboard style design. The first KPI that can be shown is Average Corrective Maintenance Time Per Airplane. The second KPI is Average Preventive Maintenance Time Per Airplane and the third is Ratio Corrective Versus Preventive Maintenance Time Per Airplane. These KPI Powerpoint graphics are all data driven, and the shape automatically adjusts according to your data. Just right click on the KPI graphic, enter the right value and the shape will adjust automatically. Make a visual impact with our KPI slides.
-
 Flight kpi for available seat profit ratio employee and non employee costs powerpoint slide
Presenting flight kpi for available seat profit ratio employee and non employee costs powerpoint slide. This presentation slide shows three Key Performance Indicators or KPIs in a Dashboard style design. The first KPI that can be shown is Cost of Available Seat Kilometers. The second KPI is Profit Per Airplane and the third is Ratio Employee Costs Versus Non Employee Costs Per Airplane. These KPI Powerpoint graphics are all data driven, and the shape automatically adjusts according to your data. Just right click on the KPI graphic, enter the right value and the shape will adjust automatically. Make a visual impact with our KPI slides.
-
 Kpi for ratio dentist versus non dentist new patients reappointed presentation slide
Presenting kpi for ratio dentist versus non dentist new patients reappointed presentation slide. This presentation slide shows three Key Performance Indicators or KPIs in a Dashboard style design. The first KPI that can be shown is Ratio Dentist Versus Non Dentist Time Per Dentist Treatment. The second KPI is Percentage of New Patients to Dentist Visits and the third is Percentage of Patients Reappointed to Dentist Visits. These KPI Powerpoint graphics are all data driven, and the shape automatically adjusts according to your data. Just right click on the KPI graphic, enter the right value and the shape will adjust automatically. Make a visual impact with our KPI slides.
-
 Kpi for ratio fixed and variable costs profit materials vs revenue ratio ppt slide
Presenting kpi for ratio fixed and variable costs profit materials vs revenue ratio ppt slide. This presentation slide shows three Key Performance Indicators or KPIs in a Dashboard style design. The first KPI that can be shown is Ratio Fixed Versus Variable Costs Per Laboratory Test. The second KPI is Profit Per Laboratory Test and the third is Materials Vs Revenue Ratio. These KPI Powerpoint graphics are all data driven, and the shape automatically adjusts according to your data. Just right click on the KPI graphic, enter the right value and the shape will adjust automatically. Make a visual impact with our KPI slides.
-
 Medical kpi for non patient revenue ratio patient subscription presentation slide
Presenting medical kpi for non patient revenue ratio patient subscription presentation slide. This presentation slide shows two Key Performance Indicators or KPIs in a Dashboard style design. The first KPI that can be shown is percentage of Revenue From Non Patient Subscriptions. The second KPI is Ratio Patient Subscription Revenue Versus Other Sources. These KPI Powerpoint graphics are all data driven, and the shape automatically adjusts according to your data. Just right click on the KPI graphic, enter the right value and the shape will adjust automatically. Make a visual impact with our KPI slides.
-
 Kpi for average employee non employee costs ratio cost per test ppt slide
Presenting kpi for average employee non employee costs ratio cost per test ppt slide. This presentation slide shows three Key Performance Indicators or KPIs in a Dashboard style design. The first KPI that can be shown is Average Employee Costs Per Laboratory Test. The second KPI is Average Non Employee Costs Per Laboratory Test and the third is Ratio Employee Costs Versus Non Employee Costs Per Laboratory Test. These KPI Powerpoint graphics are all data driven, and the shape automatically adjusts according to your data. Just right click on the KPI graphic, enter the right value and the shape will adjust automatically. Make a visual impact with our KPI slides.
-
 Kpi for demand ratio volume received inventory turnover powerpoint slide
Presenting kpi for demand ratio volume received inventory turnover powerpoint slide. This presentation slide shows Three Key Performance Indicators or KPIs in a Dashboard style design. The first KPI that can be shown is Independent Demand Ratio. The second KPI is Inbound Volume Received. The third is Inventory Turnover. These KPI Powerpoint graphics are all data driven, and the shape automatically adjusts according to your data. Just right click on the KPI graphic, enter the right value and the shape will adjust automatically. Make a visual impact with our KPI slides.
-
 Kpi for picked line items dock to stock time goods ratio powerpoint slide
Presenting kpi for picked line items dock to stock time goods ratio powerpoint slide. This presentation slide shows Three Key Performance Indicators or KPIs in a Dashboard style design. The first KPI that can be shown is Percentage of Correctly Picked Line Items. The second KPI is Average Dock to Stock Time for Receiving. The third is Inventory to Obsolete Goods Ratio. These KPI Powerpoint graphics are all data driven, and the shape automatically adjusts according to your data. Just right click on the KPI graphic, enter the right value and the shape will adjust automatically. Make a visual impact with our KPI slides.
-
 Business highlights of year over year evaluation of total assets equity capital and equity ratio
Presenting this set of slides with name - Business Highlights Of Year Over Year Evaluation Of Total Assets Equity Capital And Equity Ratio. This is a five stage process. The stages in this process are Business Highlights, Company Highlights, Business Key Points.
-
 Spend analysis rationalize suppliers and implement process improvements
Presenting this set of slides with name - Spend Analysis Rationalize Suppliers And Implement Process Improvements. This is a one stage process. The stages in this process are Spend Analysis, Spend Management, Procurement.
-
 Kpi dashboard showing overtime cost gender diversity ratio
Presenting this set of slides with name - Kpi Dashboard Showing Overtime Cost Gender Diversity Ratio. This is a six stage process. The stages in this process are Human Resource, Hrm, Human Capital.
-
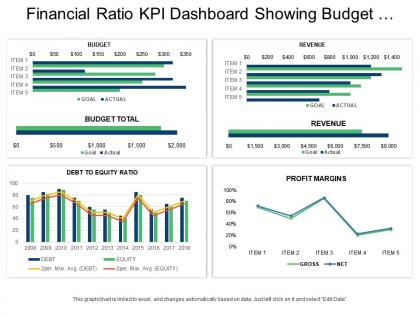 Financial ratio kpi dashboard snapshot showing budget revenue and profit margins
Presenting this set of slides with name - Financial Ratio Kpi Dashboard Snapshot Showing Budget Revenue And Profit Margins. This is a four stage process. The stages in this process are Accounting Ratio, Financial Statement, Financial Ratio.
-
 Financial ratio kpi dashboard showing cost of office space per employee and sales per employee
Presenting this set of slides with name - Financial Ratio Kpi Dashboard Showing Cost Of Office Space Per Employee And Sales Per Employee. This is a two stage process. The stages in this process are Accounting Ratio, Financial Statement, Financial Ratio.
-
 Financial ratio kpi dashboard snapshot showing delinquency charge offs and net worth ratio
Presenting this set of slides with name - Financial Ratio Kpi Dashboard Snapshot Showing Delinquency Charge Offs And Net Worth Ratio. This is a four stage process. The stages in this process are Accounting Ratio, Financial Statement, Financial Ratio.
-
 Financial ratio kpi dashboard showing iea total assets and return on investment
Presenting this set of slides with name - Financial Ratio Kpi Dashboard Showing Iea Total Assets And Return On Investment. This is a three stage process. The stages in this process are Accounting Ratio, Financial Statement, Financial Ratio.
-
 Financial ratio kpi dashboard showing liquidity ratio analysis current ratio and quick ratio
Presenting this set of slides with name - Financial Ratio Kpi Dashboard Showing Liquidity Ratio Analysis Current Ratio And Quick Ratio. This is a three stage process. The stages in this process are Accounting Ratio, Financial Statement, Financial Ratio.
-
 Financial ratio kpi dashboard snapshot showing liquidity ratio and profitability ratio
Presenting this set of slides with name - Financial Ratio Kpi Dashboard Snapshot Showing Liquidity Ratio And Profitability Ratio. This is a three stage process. The stages in this process are Accounting Ratio, Financial Statement, Financial Ratio.
-
 Financial ratio kpi dashboard showing revenue net profit margin and debt to equity
Presenting this set of slides with name - Financial Ratio Kpi Dashboard Showing Revenue Net Profit Margin And Debt To Equity. This is a five stage process. The stages in this process are Accounting Ratio, Financial Statement, Financial Ratio.
-
 Financial performance kpi dashboard showing burn rate opex ratio gross profit
Presenting this set of slides with name - Financial Performance Kpi Dashboard Showing Burn Rate Opex Ratio Gross Profit. This is a four stage process. The stages in this process are Financial Performance, Financial Report, Financial Review.
-
 Financial performance kpi dashboard showing payroll headcount ratio cost per lead
Presenting this set of slides with name - Financial Performance Kpi Dashboard Showing Payroll Headcount Ratio Cost Per Lead. This is a seven stage process. The stages in this process are Financial Performance, Financial Report, Financial Review.
-
 Financial performance kpi dashboard showing quick ratio current ratio working capital
Presenting this set of slides with name - Financial Performance Kpi Dashboard Showing Quick Ratio Current Ratio Working Capital. This is a three stage process. The stages in this process are Financial Performance, Financial Report, Financial Review.
-
 Financial performance kpi dashboard showing regional sales status cash and ratios
Presenting this set of slides with name - Financial Performance Kpi Dashboard Showing Regional Sales Status Cash And Ratios. This is a four stage process. The stages in this process are Financial Performance, Financial Report, Financial Review.
-
 Financial performance kpi dashboard showing revenue quick ratio short term assets
Presenting this set of slides with name - Financial Performance Kpi Dashboard Showing Revenue Quick Ratio Short Term Assets. This is a four stage process. The stages in this process are Financial Performance, Financial Report, Financial Review.
-
 R and d kpi dashboard showing outsource ratio cost intensity by country and r and d to sales ratio
Presenting this set of slides with name - R And D Kpi Dashboard Showing Outsource Ratio Cost Intensity By Country And R And D To Sales Ratio. This is a four stage process. The stages in this process are R And D, Research And Development, Research And Technological Development.
-
 Mining oil and gas extraction kpi dashboard showing steam to oil ratio and oil reserves
Presenting this set of slides with name - Mining Oil And Gas Extraction Kpi Dashboard Showing Steam To Oil Ratio And Oil Reserves. This is a four stage process. The stages in this process are Mining, Oil And Gas Extraction, Refinery, Natural Gas.
-
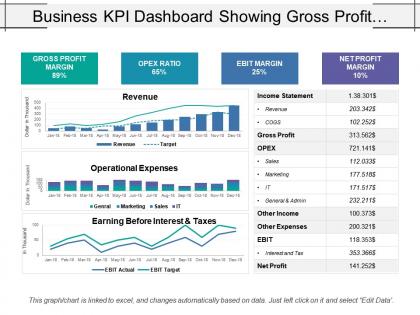 Business kpi dashboard showing gross profit margin opex ratio and ebit margin
Presenting this set of slides with name - Business Kpi Dashboard Showing Gross Profit Margin Opex Ratio And Ebit Margin. This is a three stage process. The stages in this process are Business Dashboard, Business Kpi, Business Performance.
-
 Business kpi dashboard showing lead to opportunity ratio
Presenting this set of slides with name - Business Kpi Dashboard Showing Lead To Opportunity Ratio. This is a three stage process. The stages in this process are Business Dashboard, Business Kpi, Business Performance.
-
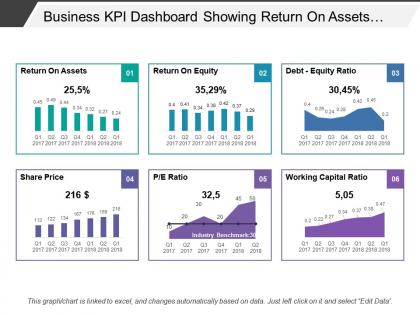 Business kpi dashboard showing return on assets debt-equity ratio
Presenting this set of slides with name - Business Kpi Dashboard Showing Return On Assets Debt-Equity Ratio. This is a six stage process. The stages in this process are Business Dashboard, Business Kpi, Business Performance.
-
 Executing reporting kpi dashboard showing trading summary performance summary and sales ratio
Presenting this set of slides with name - Executing Reporting Kpi Dashboard Showing Trading Summary Performance Summary And Sales Ratio. This is a four stage process. The stages in this process are Executive Reporting, Executive Analysis, Executive Performance.
-
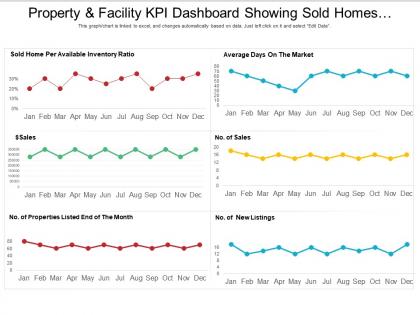 Property and facility kpi dashboard showing sold homes per available inventory ratio
Get a chance to go through, property and facility KPI dashboard showing sold homes per available inventory ratio PowerPoint Presentation Slide. This Presentation has been designed by professionals and is fully editable. You can have access to play with the font size, font type, colors, and even the background. This Template is attainable with Google Slide and can be saved in JPG or PDF format without any hurdles created during the saving process. Fast download at the click of the button.
-
 Workforce kpi dashboard showing number of employee overhead ratio and salary
Presenting this set of slides with name - Workforce Kpi Dashboard Showing Number Of Employee Overhead Ratio And Salary. This is a three stage process. The stages in this process are Staff, Personnel, Workforce.
-
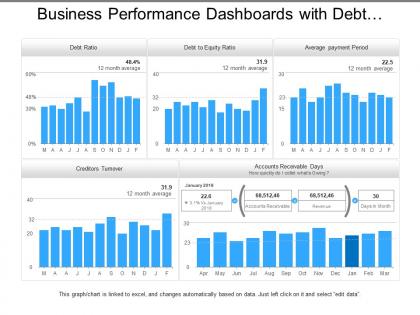 Business performance dashboards with debt equity ratio
Presenting, business performance dashboards with debt-equity ratio PPT deck, that can be used by businesses experts for their business performance indication Presentations. The issues and data shown in the flat design can be quickly edited in respect with color, text, and fonts by just by following few steps. The color and orientation of the elements can also be adjusted easily. This PPT slide is cooperative with Google Slides and can be obtained in pdf or jpeg format.
-
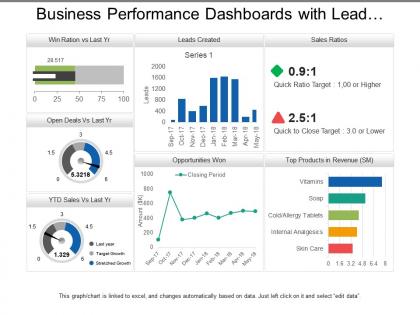 Business performance dashboards with lead creation and sales ratios
Presenting, business performance dashboards with lead creation and sales ratios for cost efficiency and performance indication PPT presentation. Bright and informative PowerPoint presentation slides. Gives regulations to achieve business success and targets. Produces error-free execution. Acts as a model for planning future assignments for marketing capabilities. Fully editable by any user at any point in time. Performs a clarity of marketing and presentation objectives without creating any confusions and misconceptions. Simple to be projected to widescreen without degradation in quality.
-
 Business performance dashboards with revenue and ratios
Presenting, our business performance dashboards with revenue and ratios PPT deck. Pre-designed chart sheet directed PowerPoint Presentation template. Administration of high-resolution images, graphs, and comparison diagrams. Filled with methods and effects to create an impact. Can be quickly converted into JPEG/JPG or PDF formats as per the requirements. Congenial with Google Slides for ease. Project to widescreen without cringing about pixelating, after downloading explore these characteristics.
-
 Media and publishing average direct costs and ratios dashboard
Presenting this set of slides with name - Media And Publishing Average Direct Costs And Ratios Dashboard. This is a six stage process. The stages in this process are Media And Publishing, Media Communication.
-
 Media and publishing ratios fixed and direct cost dashboard
Presenting this set of slides with name - Media And Publishing Ratios Fixed And Direct Cost Dashboard. This is a two stage process. The stages in this process are Media And Publishing, Media Communication.
-
 Financial results return on assets capital ratio
Sharing financial results return on assets capital ratio presentation slide. PowerPoint design can be downloaded and save into JPG and PDF format. PPT template can be downloaded in standard and widescreen view. Fully compliant slide design with Google slides. Easy to edit as color, text and font can be amended. Perfect to share business communication as pixels don’t break even when shared on large screen. Presentation graphic can be accessed with different nodes and stages.
-
 Financial results return on assets capital ratio ppt design
Exhibiting financial results return on assets capital ratio PPT design. Fully amendable content as color, text and shape are easily editable. Easy to add business name, icon or title. Awesome picture quality as do not break when anticipated on large screen. Easy and quick download with saving options. The PowerPoint slide can be presented in standard and widescreen view. Preference to download with different nodes and stages. PPT diagram can be shared with Google slides.
-
 Procurement inventory turnover and sales ratio dashboard
Presenting this set of slides with name - Procurement Inventory Turnover And Sales Ratio Dashboard. This is a five stage process. The stages in this process are Purchase, Procurement, Buy.
-
 Lead conversion and opportunity ratio sales dashboards
Presenting this set of slides with name - Lead Conversion And Opportunity Ratio Sales Dashboards. This is a four stage process. The stages in this process are Sales Dashboard, Sales Kpis, Sales Performance.
-
 Sales growth ratio and booking this month dashboard
Presenting this set of slides with name - Sales Growth Ratio And Booking This Month Dashboard. This is a four stage process. The stages in this process are Sales Dashboard, Sales Kpis, Sales Performance.
-
 Ratio of direct and indirect cost telecommunications dashboard
Presenting this set of slides with name - Ratio Of Direct And Indirect Cost Telecommunications Dashboard. Presentation template can be presented in both standard and widescreen view. Quick download and transform into JPEG and PDF document. PPT slides are totally compatible with Google slides. Presentation design is accessible to download with easy saving options. Similar PowerPoint designs with different nodes and stages. Easily editable PowerPoint graphic as color, text and font are editable. PPT slide is available with choice to insert symbol and image for personalization.
-
 Business data visualization percentage ratio comparison chart
Presenting this set of slides with name - Business Data Visualization Percentage Ratio Comparison Chart. This is a three stage process. The stages in this process are Data Visualization, Data Management, Data Representation.
-
 Insurance average cost per claim and claims ratio dashboard
Presenting this set of slides with name - Insurance Average Cost Per Claim And Claims Ratio Dashboard. This is a five stage process. The stages in this process are Assurance, Surety, Insurance.
-
 Insurance claim by problem type net income ratio dashboard
Presenting this set of slides with name - Insurance Claim By Problem Type Net Income Ratio Dashboard. This is a five stage process. The stages in this process are Assurance, Surety, Insurance.
-
 Businesses process market decisions product rationalization inventory management cpb
Presenting this set of slides with name - Businesses Process Market Decisions Product Rationalization Inventory Management Cpb. This is an editable four stages graphic that deals with topics like Businesses Process, Market Decisions, Product Rationalization, Inventory Management to help convey your message better graphically. This product is a premium product available for immediate download, and is 100 percent editable in Powerpoint. Download this now and use it in your presentations to impress your audience.
-
 Hoshin kanri project management tools rational unified process cpb
Presenting this set of slides with name - Hoshin Kanri Project Management Tools Rational Unified Process Cpb. This is an editable two stages graphic that deals with topics like Hoshin Kanri Project Management Tools, Rational Unified Process to help convey your message better graphically. This product is a premium product available for immediate download, and is 100 percent editable in Powerpoint. Download this now and use it in your presentations to impress your audience.
-
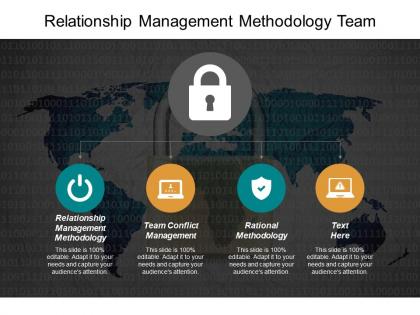 Relationship management methodology team conflict management rational methodology cpb
Presenting this set of slides with name - Relationship Management Methodology Team Conflict Management Rational Methodology Cpb. This is an editable four stages graphic that deals with topics like Relationship Management Methodology, Team Conflict Management, Rational Methodology to help convey your message better graphically. This product is a premium product available for immediate download,and is 100 percent editable in Powerpoint. Download this now and use it in your presentations to impress your audience.
-
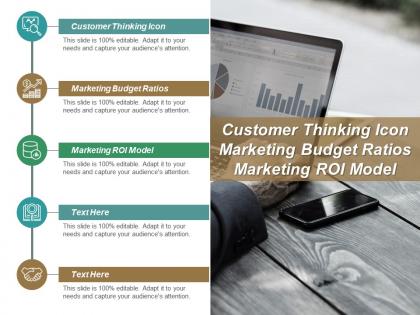 Customer thinking icon marketing budget ratios marketing roi model cpb
Presenting this set of slides with name - Customer Thinking Icon Marketing Budget Ratios Marketing Roi Model Cpb. This is an editable five stages graphic that deals with topics like Customer Thinking Icon, Marketing Budget Ratios, Marketing Roi Model to help convey your message better graphically. This product is a premium product available for immediate download, and is 100 percent editable in Powerpoint. Download this now and use it in your presentations to impress your audience.
-
 Sales and ratios percentage circle
Presenting this set of slides with name - Sales And Ratios Percentage Circle. This is a two stage process. The stages in this process are Percentage Circle, Percentage Round, Pie Chart.
-
 Rational process ppt powerpoint presentation outline graphics design cpb
Presenting this set of slides with name - Rational Process Ppt Powerpoint Presentation Outline Graphics Design Cpb. This is an editable three stages graphic that deals with topics like Rational Process to help convey your message better graphically. This product is a premium product available for immediate download, and is 100 percent editable in Powerpoint. Download this now and use it in your presentations to impress your audience.
-
 Financial statement ratio analysis ppt powerpoint presentation model graphics cpb
Presenting this set of slides with name - Financial Statement Ratio Analysis Ppt Powerpoint Presentation Model Graphics Cpb. This is an editable three stages graphic that deals with topics like Financial Statement Ratio Analysis to help convey your message better graphically. This product is a premium product available for immediate download, and is 100 percent editable in Powerpoint. Download this now and use it in your presentations to impress your audience.
-
 Expense ratios ppt powerpoint presentation slides graphics pictures cpb
Presenting this set of slides with name - Expense Ratios Ppt Powerpoint Presentation Slides Graphics Pictures Cpb. This is an editable three stages graphic that deals with topics like to help convey your message better graphically. This product is a premium product available for immediate download, and is 100 percent editable in Powerpoint. Download this now and use it in your presentations to impress your audience.
-
 Management staff ratio ppt powerpoint presentation icon skills cpb
Presenting this set of slides with name - Management Staff Ratio Ppt Powerpoint Presentation Icon Skills Cpb. This is an editable four stages graphic that deals with topics like Management Staff Ratio to help convey your message better graphically. This product is a premium product available for immediate download, and is 100 percent editable in Powerpoint. Download this now and use it in your presentations to impress your audience.
-
 Profitability measures ratios ppt powerpoint presentation show professional cpb
Presenting Profitability Measures Ratios Ppt Powerpoint Presentation Show Professional Cpb slide which is completely adaptable. The graphics in this PowerPoint slide showcase four stages that will help you succinctly convey the information. In addition, you can alternate the color, font size, font type, and shapes of this PPT layout according to your content. This PPT presentation can be accessed with Google Slides and is available in both standard screen and widescreen aspect ratios. It is also a useful set to elucidate topics like Profitability Measures Ratios. This well-structured design can be downloaded in different formats like PDF, JPG, and PNG. So, without any delay, click on the download button now.
-
 Rational expectations economics ppt powerpoint presentation ideas layouts cpb
Presenting our Rational Expectations Economics Ppt Powerpoint Presentation Ideas Layouts Cpb PowerPoint template design. This PowerPoint slide showcases four stages. It is useful to share insightful information on Rational Expectations Economics This PPT slide can be easily accessed in standard screen and widescreen aspect ratios. It is also available in various formats like PDF, PNG, and JPG. Not only this, the PowerPoint slideshow is completely editable and you can effortlessly modify the font size, font type, and shapes according to your wish. Our PPT layout is compatible with Google Slides as well, so download and edit it as per your knowledge.
-
 Key valuation ratio of the company raise funding from financial market
The slide provides the key ratios and a brief summary about the relevance of those ratios. Key ratios include return on capital employed, earning per share, price earning ratio, return on equity, dividend yield etc. Present the topic in a bit more detail with this Key Valuation Ratio Of The Company Raise Funding From Financial Market. Use it as a tool for discussion and navigation on Industry Average, Price, Equity. This template is free to edit as deemed fit for your organization. Therefore download it now.
-
 High ratio stocks ppt powerpoint presentation infographics slide portrait cpb
Presenting our High Ratio Stocks Ppt Powerpoint Presentation Infographics Slide Portrait Cpb PowerPoint template design. This PowerPoint slide showcases eight stages. It is useful to share insightful information on High Ratio Stocks This PPT slide can be easily accessed in standard screen and widescreen aspect ratios. It is also available in various formats like PDF, PNG, and JPG. Not only this, the PowerPoint slideshow is completely editable and you can effortlessly modify the font size, font type, and shapes according to your wish. Our PPT layout is compatible with Google Slides as well, so download and edit it as per your knowledge.


