Powerpoint Templates and Google slides for Percentage.
Save Your Time and attract your audience with our fully editable PPT Templates and Slides.
-
 Goal success achievement percentage diagram powerpoint slides
Use of high-resolution images. Easy to download and save. Allow instant replacement of the icons or images. Offer trouble free insertion of business name. Customize the background, orientation or size of the images or icons. Offered instructions to make changes and modify the slide icons. Useful for the business entrepreneurs, business presenters and the team leaders.
-
 Globe with colored flags for business percentage ppt presentation slides
Presenting globe with colored flags for business percentage ppt presentation slides. This Power Point template slide has been crafted with graphic of globe with colored flags .This PPT slide contains the concept of global financial analysis . Use this PPT side for business and finance related presentations.
-
 Business peoples team and percentage pie chart ppt presentation slides
Presenting business peoples team and percentage pie chart ppt presentation slides. This Power Point template slide has been crafted with graphic of business people?s team and percentage pie chart. This PPT slide contains the concept of global business team management and financial analysis. Use this PPT side for business and finance related presentations.
-
 Business peoples social media percentage powerpoint slides
Presenting business peoples social media percentage powerpoint slides. This Power Point template diagram slide has been crafted with graphic of business peoples and percentage diagram. This PPT diagram contains the concept of social media communication. Use this PPT diagram for business and internet related presentations.
-
 Four tags and percentage chart financial analysis powerpoint slides
Presenting four tags and percentage chart financial analysis powerpoint slides. This Power Point template diagram slide has been crafted with graphic of four tags and percentage chart diagram. This PPT diagram contains the concept of financial analysis. Use this PPT diagram for business and finance related presentations.
-
 Linear sequential compare chart with percentage powerpoint slides
Presenting linear sequential compare chart with percentage powerpoint slides. This Power Point template diagram slide has been crafted with graphic of linear sequential chart and percentage diagram. This PPT diagram contains the concept of data comparison analysis representation. Use this PPT diagram for business and finance related presentations.
-
 Social media clouds with percentage diagram powerpoint slides
Presenting social media clouds with percentage diagram powerpoint slides. This Power Point template diagram slide has been crafted with graphic of social media cloud and percentage diagram. This PPT diagram contains the concept of cloud computing representation. Use this PPT diagram for business and technology related presentations.
-
 Ten staged business percentage circle chart powerpoint slides
Presenting ten staged business percentage circle chart powerpoint slides. This Power Point template diagram slide has been crafted with graphic of ten staged circle chart diagram. This PPT diagram contains the concept of business data analysis. Use this PPT diagram for business and finance related presentations.
-
 Three tags financial chart with percentage powerpoint slides
Presenting three tags financial chart with percentage powerpoint slides. This Power Point template diagram slide has been crafted with graphic of three tags and chart diagram. This PPT diagram contains the concept of financial data analysis representation. Use this PPT diagram for business and finance related presentations.
-
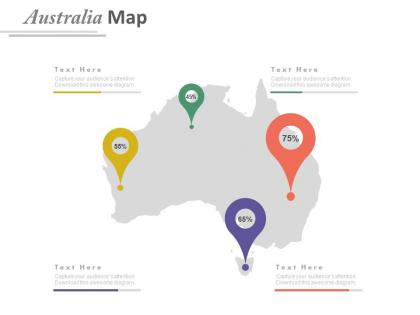 Map of australia with location percentage icons powerpoint slides
Presenting map of australia with location percentage icons powerpoint slides. This power point template icon slide has been crafted with graphic of map for Australia. This PPT icon slide contains the concept of location indication representation Use this PPT icon slide for business and travel related presentations.
-
 Percentage chart for people growth powerpoint slides
Presentation designs arranged by professional experts. Icons in the PPT diagrams can be edited as per desired color, size and direction. All the presentation slides are well-suited with Google slides. Attractive graphics and clear visuals have been utilized. Can be used for the comparison of the numerical data and evaluation of employees by business organizations. Constructive for marketing and communication purpose.
-
 One test tubes with percentage analysis flat powerpoint design
Presenting one test tubes with percentage analysis flat powerpoint design. This Power Point template diagram slide has been crafted with graphic of test tubes and percentage diagram. This PPT diagram contains the concept of financial analysis. Use this PPT diagram for business and marketing related presentations.
-
 Four staged sales comparison chart with percentage powerpoint slides
Presenting four staged sales comparison chart with percentage powerpoint slides. This Power Point template slide has been crafted with graphic of four staged sales chart and percentage diagram. This PPT slide contains the concept of sales report analysis .Use this PPT slide for business and marketing related presentations.
-
 Testtubes with different percentage values powerpoint slides
Presenting testtubes with different percentage values powerpoint slides. This Power Point template slide has been crafted with graphic of test tubes and percentage diagram. This PPT slide contains the concept of data analysis .Use this PPT slide for business and marketing related presentations.
-
 Three tags with percentage chart and icons powerpoint slides
Presenting three tags with percentage chart and icons powerpoint slides. This Power Point template slide has been crafted with graphic of three tags and percentage chart diagram. This PPT slide contains the concept of financial data analysis and flow representation .Use this PPT slide for business and finance related presentations.
-
 Four circles with percentage icons dashboard chart powerpoint slides
Recognized quality pictures utilized. Can shape a vital piece of various business points’ presentation. Utilization of splendid hues ensures dynamic quality in introduction. Gives an expert standpoint to your PowerPoint introduction. High determination of PPT symbols guarantees bother free projection on wide screen. Perfect with different programming alternatives accessible both on the web and disconnected. Benefitted for business analyst, finance executives, sales professionals, educational institutes etc.
-
 Dollar lock percentage symbol piggy financial saving ppt icons graphics
Presenting dollar lock percentage symbol piggy financial saving ppt icons graphics. This Power Point template diagram slide has been crafted with finance and business icons. This PPT diagram slide contains the concept of financial saving analysis. Use this PPT slide for finance and business related presentations.
-
 Percentage symbol financial decay process control financial investment ppt icons graphics
Presenting percentage symbol financial decay process control financial investment ppt icons graphics. This Power Point template diagram slide has been crafted with finance icons. This PPT diagram slide contains the concept of financial process control and investment representation. Use this PPT slide for finance and business related presentations.
-
 Five staged financial percentage chart powerpoint slides
Presenting five staged financial percentage chart powerpoint slides. This Power Point template slide has been crafted with graphic of five staged percentage chart. This PPT slide contains the concept of financial analysis. Use this PPT slide for business and finance related presentations.
-
 Five staged percentage market analysis powerpoint slides
Presenting five staged percentage market analysis powerpoint slides. This Power Point template slide has been crafted with graphic of five staged percentage chart. This PPT slide contains the concept of financial growth and market analysis. Use this PPT slide for business and finance related presentations.
-
 Five staged sequential arrows and percentage powerpoint slides
Presenting five staged sequential arrows and percentage powerpoint slides. This Power Point template slide has been crafted with graphic of five staged arrow and percentage chart. This PPT slide contains the concept of financial growth analysis. Use this PPT slide for business and finance related presentations.
-
 Four arrows labels with percentage charts powerpoint slides
Presenting four arrows labels with percentage charts powerpoint slides. This Power Point template slide has been crafted with graphic of four arrows labels and percentage chart. This PPT slide contains the concept of financial data analysis. Use this PPT slide for business and finance related presentations.
-
 Percentage cycle with bar graph for financial analysis powerpoint slides
Presenting percentage cycle with bar graph for financial analysis powerpoint slides. This Power Point template slide has been crafted with graphic of percentage cycle and bar graph. This PPT slide contains the concept of financial analysis. Use this PPT slide for business and finance related presentations.
-
 Three tags with percentage and icons powerpoint slides
Presenting three tags with percentage and icons powerpoint slides. This Power Point template slide has been crafted with graphic of three tags and percentage diagram. This PPT slide contains the concept of financial data analysis. Use this PPT slide for business and finance related presentations.
-
 Map of finland and percentage analysis powerpoint slides
Presenting map of finland and percentage analysis powerpoint slides. This Power Point template slide has been crafted with graphic of map of Finland and percentage analysis. This PPT diagram contains the concept of financial analysis representation. Use this PPT diagram for business and finance related presentations.
-
 Map of ireland with percentage analysis powerpoint slides
Presenting map of ireland with percentage analysis powerpoint slides. This Power Point template slide has been crafted with graphic of map of Ireland and percentage analysis. This PPT diagram contains the concept of financial analysis. Use this PPT diagram for business and finance related presentations.
-
 Map with years and state percentage diagram powerpoint slides
Presenting map with years and state percentage diagram powerpoint slides. This Power Point template slide has been crafted with graphic of map, states and years. This PPT diagram contains the concept of financial analysis for different states. Use this PPT diagram for business and finance related presentations.
-
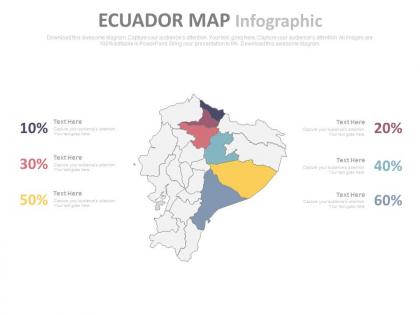 Six different percentage charts for ecuador map powerpoint slides
Presenting six different percentage charts for ecuador map powerpoint slides. This Power Point template slide has been crafted with graphic of six different percentages chart for Ecuador map. This PPT diagram contains the concept of financial analysis. Use this PPT diagram for business and finance related presentations.
-
 World map for our services and percentage powerpoint slides
Professionals can easily portray their organization's financial agendas and locations through this eco-friendly powerpoint presentation. The color of the countries and other elements can easily be changed and you can edit the text section according to your analysis. SlideTeam watermark is temporary and is removed after downloading. This Ppt slide is also compatible with google slides.
-
 World map various percentage analysis powerpoint slides
Presenting world map various percentage analysis powerpoint slides. This Power Point template slide has been crafted with graphic of world map and percentage. This PPT diagram contains the concept of percentage analysis. Use this PPT diagram for business and finance related presentations.
-
 World map with percentage analysis powerpoint slides
Presenting world map with percentage analysis powerpoint slides. This Power Point template slide has been crafted with graphic of world map and percentage. This PPT diagram contains the concept of global financial percentage analysis. Use this PPT diagram for business and finance related presentations.
-
 Four profiles for about us percentage powerpoint slides
Presenting four profiles for about us percentage powerpoint slides. This Power Point slide has been crafted with graphic of four profile and percentage diagram .This PPT slide contains the concept of business profiles representation. Use this PPT slide for business and marketing related presentations.
-
 Comparison Charts With Percentage Powerpoint Slides
Presenting, comparison charts with the percentage of PowerPoint slides. Adjust the infographics according to your data. Personalize the percentage value and color schemes. Convenient and fast to download with ease. Adjust the size and orientation of presentation infographics to your liking. Alter the text to suit the context. Include your own logo, company mane, trademark, brand-name etc. No alteration in original high resolution of PPT images after editing. Convert into JPEG/PDF as per requirement.
-
 Four Percentage Charts For Comparison Powerpoint Slides
The slides are equipped with superior resolution. Modify the slide outlook by changing the colors, size, and placement of graphics. The option of easy downloading is accompanied with the convenient saving of the template in multiple formats. Play the Ppt template in Google slides anytime anywhere. Remove the Slide-Team's watermark after completing the downloading process. Utilize the ample space for the content addition.
-
 Four trucks graphics with percentage comparison powerpoint slides
The slides transmit a powerful display quality impacting an everlasting impression. Download the slide info graphics in various file formats (JPEG, JPG, PDF.) Play the slides in Google slides as a convenient measure. Transform the slide as per your own suitability in terms of colour and size adjustment. Position the graphics accordingly to recast its outlook. The watermark of Slide Team is easily removable.
-
 Three batteries with percentage analysis powerpoint slides
Presenting three batteries with percentage analysis powerpoint slides. This Power Point icon template slide has been crafted with graphic of three batteries and percentage . This icon PPT slide contains the concept of percentage analysis. Use this icon PPT slide for business and finance related presentations.
-
 Four circle chart with finance percentage diagram powerpoint slides
Presentation slide representing circle charts with finance percentages. Useful combination of charts and percentages. Compatible with number of software options. Colors, text and fonts can be easily changed as the PPT slide is completely editable. Personalize the presentation with individual company name and logo. Available in both Standard and Widescreen slide size. Easy and quick downloading process. Flexible option for conversion in PDF or JPG formats. Can use with Google slides.
-
 Four clouds with percentage analysis and icons powerpoint slides
Presenting four clouds with percentage analysis and icons powerpoint slides. This Power Point template diagram with graphic of four clouds and percentage. This PPT diagram contains the concept of financial analysis. Use this PPT diagram for business and finance related presentations.
-
 Four pyramids with percentage analysis powerpoint slides
Presenting four pyramids with percentage analysis powerpoint slides. This Power Point template diagram with graphic of four pyramid and percentage. This PPT diagram contains the concept of percentage analysis. Use this PPT diagram for business and finance related presentations.
-
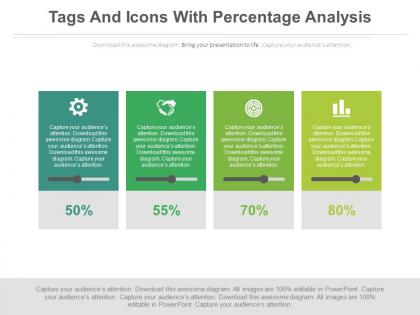 Four tags and icons with percentage analysis powerpoint slides
Presenting four tags and icons with percentage analysis powerpoint slides. This Power Point template diagram with graphic of four staged tags and icons. This PPT diagram contains the concept of percentage analysis. Use this PPT diagram for business and finance related presentations.
-
 Six staged percentage analysis chart powerpoint slides
Presenting six staged percentage analysis chart powerpoint slides. This Power Point template diagram with graphic of six staged percentage chart. This PPT diagram contains the concept of financial analysis. Use this PPT diagram for business and finance related presentations.
-
 Three pie charts with percentage analysis powerpoint slides
Splendid picture quality which does not pixelate when projected on wide screen. Compatible with multiple online/offline software options. Compatible with multiple format options like JPEG/JPG/PNG. Easy to comprehend and visually appealing. Ease of personalization with own name, logo or trademark insertion. 100 percent editable PowerPoint slide design. Modify the icons, colors, shades, orientation or even font as per your choice. Widely applicable by varied group of professionals, students, freelancers and more.
-
 Triangle with percentage financial analysis powerpoint slides
Presenting triangle with percentage financial analysis powerpoint slides. This Power Point template diagram with graphic of triangle and percentage diagram. This PPT diagram contains the concept of financial analysis. Use this PPT diagram for business and finance related presentations.
-
 Map with percentage and social objectives powerpoint slides
Presenting map with percentage and social objectives powerpoint slides. This Power Point template diagram slide has been crafted with map and percentage. This PPT slide contains the concept of social objective analysis. Use this PPT slide for business and marketing related presentations.
-
 Three business maps with percentages powerpoint slides
Presenting three business maps with percentages powerpoint slides. This Power Point template diagram slide has been crafted with three map and percentage. This PPT slide contains the concept of location based financial analysis. Use this PPT slide for business and marketing related presentations.
-
 World map with five various locations and percentage powerpoint slides
Presenting world map with five various locations and percentage powerpoint slides. This Power Point template diagram slide has been crafted with world map and five various locations. This PPT slide contains the concept of global business analysis. Use this PPT slide for business and marketing related presentations.
-
 Five staged sequential timeline with percentage powerpoint slides
Presenting five staged sequential timeline with percentage powerpoint slides. This Power Point template slide has been crafted with graphic of five staged sequential timeline and percentage. This PPT slide contains the concept of timeline formation. Use this PPT diagram for business and marketing related presentations.
-
 Four arrows with percentage and years timeline powerpoint slides
Presenting four arrows with percentage and years timeline powerpoint slides. This Power Point template slide has been crafted with graphic of four arrows and percentage diagram. This PPT slide contains the concept of financial timeline formation. Use this PPT diagram for business and marketing related presentations.
-
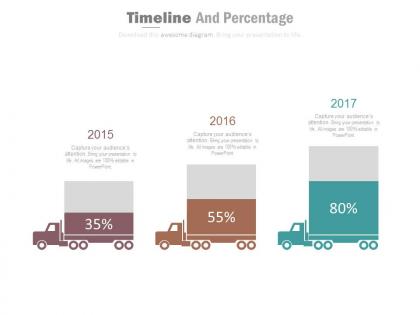 Three truck tags timeline and percentage powerpoint slides
Presenting three truck tags timeline and percentage powerpoint slides. This Power Point template slide has been crafted with graphic of three truck tags and timeline diagram. This PPT slide contains the concept of business success timeline representation. Use this PPT diagram for business and marketing related presentations.
-
 Thank you slide for percentage analysis powerpoint slides
PPT slides are compatible with Google slides. Multiple options to display in standard or in widescreen view. Stunning image background enhance the quality of the presentation slide. Data can be added at any stage even before presenting. Perfect for business and marketing related presentations.
-
 Five staged concentric financial chart with percentage powerpoint slides
The graphics present a flamboyant projection delivering utmost clarity. The slides are compatible with the Google Slides and the multiple file formats are available to save the template post downloading. Explore the wide range of customization of its colors, orientation, and size scheme. Remove the watermark of Slide Team and insert the desired text, watermark and logo at few clicks.
-
 Five Staged Pie Charts With Percentage Analysis Powerpoint Slides
Capture the interest of your audience with a vibrant showcase of supreme quality visuals. Customize on the colour part, orientation scheme, and size restructuring to cast a suitable interface of the slide. Play it on Google Slides with a convenient download option in multiple file formats. Utilize the ample text space for an explanatory write-up. A complete user guide follows the slide for easy transformation.
-
 Three staged percentage analysis charts powerpoint slides
Presenting three staged percentage analysis charts powerpoint slides. This Power Point template slide has been crafted with graphic of five staged percentage chart. This PPT slide contains the concept of financial analysis. Use this PPT slide for business and finance related presentations.
-
 Customer service benchmarking dashboard snapshot percentage ppt slides
This PPT slide can be used by anyone looking to project their Customer Service Bench marking related ideas. This PowerPoint template is 100% editable, which means text, color, and shapes of the given elements can be altered according to your liking. These slides are also compatible with Google slides. You can edit the text section to write a short brief about the process.The stages in this process are finance, marketing, strategy, business.
-
 Candidate selection factory growth percentage chart ppt icons graphics
Presenting candidate selection factory growth percentage chart ppt icons graphics. This Power Point icon template diagram has been crafted with graphic of factory, percentage chart and candidate icons. This icon PPT contains the concept of financial growth management. Use this icon PPT diagram for business and finance related presentations.
-
 Location navigation percentage indication global location meter ppt icons graphics
Presenting location navigation percentage indication global location meter ppt icons graphics. This Power Point icons template has been crafted with graphic of location, percentage and globe icons. This icon PPT contains the concept of global business locations representation. Use this icon PPT for map and transportation related presentations.
-
 Target selection percentage analysis report gears ppt icons graphics
Presenting target selection percentage analysis report gears ppt icons graphics. This Power Point icon template diagram has been crafted with graphic of target, percentage and report icons. This icon PPT diagram contains the concept of business target analysis representation .Use this icon PPT for business and finance related presentations.
-
 Column chart percentage analysis powerpoint slides
Presenting column chart percentage analysis powerpoint slides. This is a column chart percentage analysis powerpoint slides. This is a five stage process. The stages in this process are financials.
-
 Creative bar graph for percentage analysis powerpoint slides
Presenting creative bar graph for percentage analysis powerpoint slides. This is a creative bar graph for percentage analysis powerpoint slides. This is a seven stage process. The stages in this process are financials.
-
 Four circle arrows and percentage for finance powerpoint slides
Presenting four circle arrows and percentage for finance powerpoint slides. This is a four circle arrows and percentage for finance powerpoint slides. This is a four stage process. The stages in this process are financials.


