Powerpoint Templates and Google slides for Percentage.
Save Your Time and attract your audience with our fully editable PPT Templates and Slides.
-
 Map of belgium and venezuela with population density percentage powerpoint slides
Presenting map of belgium and venezuela with population density percentage powerpoint slides. This Power Point template slide has been crafted with graphic of maps for Belgium and Venezuela. This PPT slide contains the concept of population density representation. Use this PPT slide for business and marketing related presentations.
-
 Map of belgium with percentage section powerpoint slides
Presenting map of belgium with percentage section powerpoint slides. This Power Point template slide has been crafted with graphic of map for Belgium. This PPT slide contains the concept of percentage and company location representation. Use this PPT slide for business and marketing related presentations.
-
 Map of ecuador with percentage chart powerpoint slides
Presenting map of ecuador with percentage chart powerpoint slides. This Power Point template slide has been crafted with graphic of map of Ecuador and percentage chart. This PPT slide contains the concept of financial analysis. Use this PPT slide for business and finance related presentations.
-
 Map with percentage segments for analysis powerpoint slides
Presenting map with percentage segments for analysis powerpoint slides. This Power Point template slide has been crafted with graphic of map and percentage. This PPT slide contains the concept of financial segmentation and analysis based on locations. Use this PPT slide for business and finance related presentations.
-
 World map with social media network percentage powerpoint slides
Presenting world map with social media network percentage powerpoint slides. This Power Point template slide has been crafted with graphic of world map with social media network. This PPT slide contains the concept of social media networking. Use this PPT slide for business and finance related presentations.
-
 World map with specific location percentage powerpoint slides
Presenting world map with specific location percentage powerpoint slides. This Power Point template slide has been crafted with graphic of world map with locations. This PPT slide contains the concept of location based analysis .Use this PPT slide for business and finance related presentations.
-
 Business area coverage with percentage value powerpoint slides
Presenting business area coverage with percentage value powerpoint slides. This Power Point template slide has been crafted with graphic of coverage and percentage value diagram. This PPT slide contains the concept of business area coverage representation. Use this PPT slide for business and finance related presentations.
-
 Country map with four percentage sections powerpoint slides
Presenting country map with four percentage sections powerpoint slides. This Power Point template slide has been crafted with graphic of country maps and four percentage sections diagram. This PPT slide contains the concept of location indication representation. Use this PPT slide for business and finance related presentations.
-
 Map with social media coverage percentage location indication powerpoint slides
Presenting map with social media coverage percentage location indication powerpoint slides. This Power Point template slide has been crafted with graphic of map diagram. This PPT slide contains the concept of social media coverage and location indication representation. Use this PPT slide for business and finance related presentations.
-
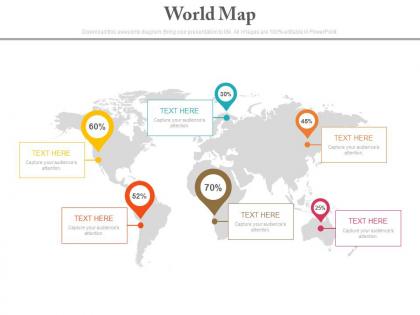 World map with percentage indication for financial management powerpoint slides
This PowerPoint slide can be used by business professional for displaying their core finance related matters through a PowerPoint presentation. Colors of the stages used here can be altered in any PowerPoint software; also you can resize any shape and edit colors of the elements and also use your own icons and use your own image in any slide.
-
 Five staged market trends and percentage chart powerpoint slides
Presenting five staged market trends and percentage chart powerpoint slides. This Power Point template slide has been crafted with graphic of five staged market and percentage chart. This PPT slide contains the concept of financial analysis. Use this PPT slide for business and finance related presentations.
-
 Bar graph with percentage for financial analysis powerpoint slides
Presenting bar graph with percentage for financial analysis powerpoint slides. This Power Point template slide has been crafted with graphic of bar graph and percentage icons. This PPT slide contains the concept of financial analysis. Use this PPT slide for business and finance related presentations.
-
 Five staged market trends percentage and icons powerpoint slides
Presenting five staged market trends percentage and icons powerpoint slides. This Power Point template slide has been crafted with graphic of five staged percentage and icons. This PPT slide contains the concept of financial growth analysis. Use this PPT slide for business and finance related presentations.
-
 Bar graph with percentage values and team powerpoint slides
Presenting bar graph with percentage values and team powerpoint slides. This is a bar graph with percentage values and team powerpoint slides. This is a six stage process. The stages in this process are financials.
-
 Percentage charts for financial revenue analysis powerpoint slides
Presenting percentage charts for financial revenue analysis powerpoint slides. This is a percentage charts for financial revenue analysis powerpoint slides. This is a three stage process. The stages in this process are financials.
-
 Train diagram with business icons and percentage powerpoint slides
Presenting train diagram with business icons and percentage powerpoint slides. This is a train diagram with business icons and percentage powerpoint slides. This is a three stage process. The stages in this process are financials.
-
 World map with specific percentage for locations powerpoint slides
Presenting world map with specific percentage for locations powerpoint slides. This is a world map with specific percentage for locations powerpoint slides. This is a four stage process. The stages in this process are company location.
-
 Sales percentage achieved in multiple locations powerpoint slide show
Presenting sales percentage achieved in multiple locations powerpoint slide show. This is a sales percentage achieved in multiple locations powerpoint slide show. This is a five stage process. The stages in this process are north america, south america, africa, asia, australia.
-
 Real estate market listing percentage sample of ppt
Presenting real estate market listing percentage sample of ppt. This is a real estate market listing percentage sample of ppt. This is a three stage process. The stages in this process are new listings, active listings, average dom.
-
 Comparison chart with percentage and description powerpoint slide ideas
Presenting comparison chart with percentage and description powerpoint slide ideas. This is a comparison chart with percentage and description powerpoint slide ideas. This is a two stage process. The stages in this process are business, compare, strategic, marketing, analysis.
-
 Portfolio diversification with percentage and pie chart ppt design
Presenting portfolio diversification with percentage and pie chart ppt design. This is a portfolio diversification with percentage and pie chart ppt design. This is a four stage process. The stages in this process are pie, percentage, divide, chart, portfolio.
-
 Doughnut chart for data visualization comparison of percentages powerpoint slides design
Presenting doughnut chart for data visualization comparison of percentages powerpoint slides design. This is a doughnut chart for data visualization comparison of percentages powerpoint slides design. This is a four stage process. The stages in this process are business, marketing, financial, percentage, increase.
-
 Market trends analysis percentage spending by region powerpoint slide introduction
Presenting market trends analysis percentage spending by region powerpoint slide introduction. This is a market trends analysis percentage spending by region powerpoint slide introduction. This is a two stage process. The stages in this process are western europe, asia, north america, eastern europe, latin america, middle east, africa.
-
 Pie chart with percentage analysis ppt template slide
Presenting pie chart with percentage analysis ppt template slide. This is a pie chart with percentage analysis ppt template slide. This is a six stage process. The stages in this process are pie chart, analysis, process, management, business.
-
 Creative data visualization for percentage analysis powerpoint slide themes
Presenting creative data visualization for percentage analysis powerpoint slide themes. This is a creative data visualization for percentage analysis powerpoint slide themes. This is a three stage process. The stages in this process are business, marketing, strategy, success, process.
-
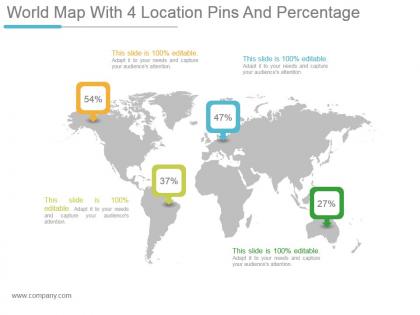 World map with 4 location pins and percentage powerpoint topics
Presenting world map with 4 location pins and percentage powerpoint topics. This is a world map with 4 location pins and percentage powerpoint topics. This is a four stage process. The stages in this process are finance, geographical, percentage, management, global.
-
 Magnifying glass with percentage values for success analysis presentation visual
Presenting magnifying glass with percentage values for success analysis presentation visual. This is a magnifying glass with percentage values for success analysis presentation visual. This is a one stage process. The stages in this process are percentage, glass, magnify, glass, finance, research.
-
 Three bars with percentage values for asset management ppt slide
Presenting three bars with percentage values for asset management ppt slide. This is a three bars with percentage values for asset management ppt slide. This is a three stage process. The stages in this process are business, marketing, financial, percentage, bar.
-
 Percentage of men vs women in business locations presentation diagrams
Presenting percentage of men vs women in business locations presentation diagrams. Presenting percentage of men vs women in business locations presentation diagrams. This is a percentage of men vs women in business locations presentation diagrams. This is a two stage process. The stages in this process are 60 percent men, 40 percent women.
-
 Four vertical columns for percentage comparison powerpoint design
Presenting four vertical columns for percentage comparison powerpoint design. Presenting four vertical columns for percentage comparison powerpoint design. This is a four vertical columns for percentage comparison powerpoint design. This is a four stage process. The stages in this process are percentage, finance, business, marketing, success.
-
 Percentage column chart for performance comparison ppt slide
Presenting percentage column chart for performance comparison ppt slide. Presenting percentage column chart for performance comparison ppt slide. Presenting percentage column chart for performance comparison ppt slide. This is a percentage column chart for performance comparison ppt slide. This is a four stage process. The stages in this process are column chart, percentage, strategy, business, success.
-
 Customer product usage percentage infographic powerpoint show
Presenting customer product usage percentage infographic powerpoint show. This is a customer product usage percentage infographic powerpoint show. This is a five stage process. The stages in this process are business, marketing, finance, planning, strategy.
-
 Finance statistics percentage value powerpoint slide layout
Presenting finance statistics percentage value powerpoint slide layout. This is a finance statistics percentage value powerpoint slide layout. This is a three stage process. The stages in this process are technology, marketing, business, success, management.
-
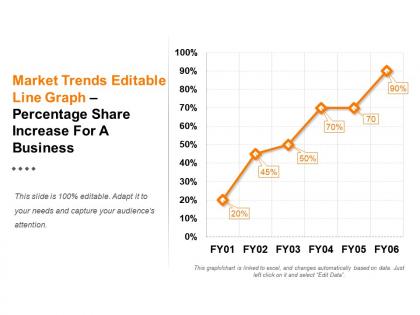 Market trends editable line graph percentage share increase for a business ppt design
Presenting market trends editable line graph percentage share increase for a business ppt design. This is a market trends editable line graph percentage share increase for a business ppt design. This is a six stage process. The stages in this process are business, finance, bar graph, marketing, management.
-
 Work life balance percentage powerpoint slide
SlideTeam brings to you its most demanded and downloaded work life balance percentage PowerPoint slides. The slideshow lets you change the font size, font color and font style of the text used in it. After downloading the PPT template it can be viewed in standard size display ratio of 4:3 or widescreen display ratio of 16:9. Following simple instructions given in the sample slides you can make the required changes to the predesigned set of slides. The slideshow presentation is also compatible with Google Slides, which makes it even easier to use. So download, edit and present it.
-
 Primary growth drivers with percentages ppt design
SlideTeam would like to introduce you all with this primary growth with percentages PPT design. The editable nature of the PPT slideshow lets you add or delete any given information from the pre-designed slides including the font size, font color and font style. The PPT template allows you to view the slides in standard size display ratio of 4:3 or widescreen display ratio of 16:9 after being downloaded. The given set of slides is compatible with Google Slides and can also be saved in the format of PDF or JPG as per your requirements.
-
 Growth drivers with percentages editable doughnut chart slide
Presenting a PPT template named Growth drivers with percentages editable doughnut chart slide. This template is professionally designed and is completely editable. The Font color, Font size, Font style, background color and color of the diagram can be altered as per your suitability. The text in the template can be rewritten and replaced with your desired content. The slide is totally compatible with Google slides and can be easily saved in JPG or PDF format. You can customize the template conveniently by changing the data in excel sheet, as this template is Excel-linked. Editable icons make the presentation more presentable. Download it now to make a hassle free presentation.
-
 Key findings circle with percentage chart sample ppt presentation
SlideTeam would want to present to all of you it’s 100% adjustable key findings circle with percentage chart sample PPT presentation. The slideshow is fully customizable which makes it very user- friendly. The slideshow once downloaded can be viewed in standard size display ratio of 4:3 or widescreen display ratio of 16:9. The template is also compatible with Google Slides. The PPT template can be alternatively saved in the format of either JPG or PDF as per your requirements. A number of changes can be made to the slides.
-
 Key findings sequential pyramid for employee skill percentage chart ppt background
SlideTeam feels immense pleasure in presenting all of you with its most purchased key finding sequential pyramid for employee skill percentage chart PPT background. The slides are 100% editable that allow you to make a number of changes to the predesigned slides. You can alter the font size, font color and even the font style of the text used in the PPT template. The slides can be viewed in widescreen display ratio of 16:9 or standard size display ratio of 4:3. The PowerPoint presentation is also compatible with Google Slides.
-
 Key findings social media connection percentage ppt infographic template
SlideTeam would like to introduce all of you with this highly user friendly key findings social media connection percentage PPT infographic template. The given set of slides is very user- friendly as well as compatible with Google Slides, which makes it very easy to use. You can view the given deck of slides in standard size display ratio of 4:3 or widescreen display ratio of 16:9 after you download the slideshow. This PPT sample can also be saved in PDF or JPG format. A number of changes can be made to the presentation.
-
 3 arrow shows percentage increase powerpoint slide show
SlideTeam feels very pleased in presenting to all of you totally user friendly and 100% customizable 3 arrow shows percentage increase PowerPoint slide show. These business slides can be viewed in widescreen display ratio of 16:9 or standard size display ratio of 4:3 after you download the slideshow. The PowerPoint presentation is very easy to deal with, as it is compatible with Google Slides. The slides let you alter the font style, font color and font size of the text used in the slides.
-
 3 percentage increase over time powerpoint slide show
Presenting, our 3 Percentage increase over time PowerPoint slide show. This is a fully editable PPT slide enabling you to customize your display with colors, text, fonts, photos, outcomes, and backgrounds of your selection. Personalize the layout by including your company data and business logo/trademark. We have created a sharp graphics format which does not deteriorate in quality when edited or pitched to a widescreen. These percentage icons PPT be used in 4:3 standard and full-screen version 16:9. Instantly download this design to make adjustments and export to pdf, jpg, and other formats as required.
-
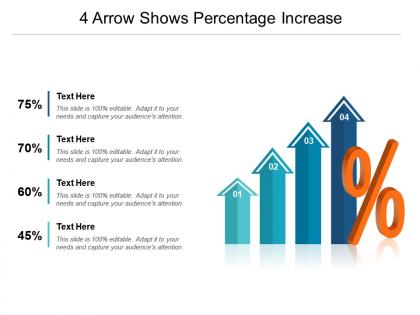 4 arrow shows percentage increase powerpoint slides
Showcasing 4 arrow shows percentage increase PowerPoint slides. Enthralling picture quality as pixels doesn’t break even on large display. PPT layout can be seen in standard and widescreen view. Opportunity altering the design with commerce name, icon and logo. Presentation design is known well with Google Slides as can be shared with them accordingly. Similar designs are available with different nodes and stages. Easy to download and change into other formats like JPG and PDF.
-
 4 percentage increase over time powerpoint slides design
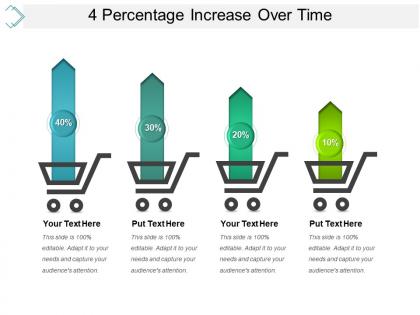
Presenting, percentage increase over time PowerPoint slides design. Use this layout for business performance processes and quickly convert into pdf or jpg formats and design on wide screens without pixelation. Substitute them icons with our countless options accessible online. Icons shown here can be resized and altered. Easily included your company data just by following a few steps. This PPT layout supports Google sides and is available and do not deteriorate when pitched on widescreens. Include this percentage increase layout in your meetings and use it in both standard 4:3 and widescreen format 16:9 after downloading.
-
 5 arrow shows percentage increase powerpoint slide rules
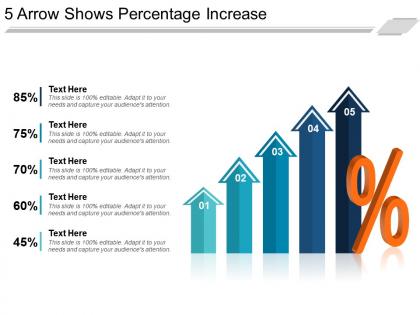
SlideTeam would like to introduce you all with this totally adjustable 5 arrow shows percentage increase PowerPoint slide rules. Using this fully editable slideshow you can change the font style, font color and font size of the text so used. Following simple instructions given in the sample slides, you can easily make the required alterations. The PPT template once downloaded can be viewed in standard size display ratio of 4:3 or widescreen display ratio of 16:9. The slides are also compatible with Google Slides.
-
 5 percentage increase over time powerpoint slides templates
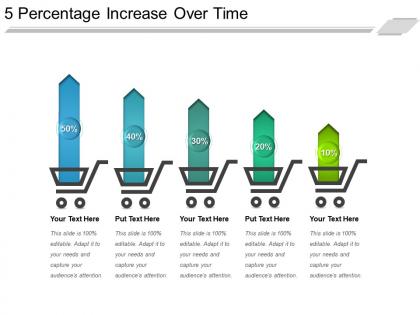
Sharing 5 percentage increases over time PowerPoint slides templates. Easy to download and can be changed into JPG and PDF format. Fully editable presentation visual as color, text and font can be amended. PPT graphic can be shared in both standard and widescreen display. Similar designs are accessible with different nodes and stages. Ready to share PPT slide is well familiar with Google Slides and can be merged. Choice customizes the design with business name and logo.
-
 6 arrow shows percentage increase powerpoint templates
SlideTeam feels immense pleasure in presenting to you our most purchased and downloaded 6 arrow shows increase PowerPoint templates. The slides let you alter the color, size, and orientation of the features of the slideshow. The business template can be saved in the format of JPG or PDF. Once the PPT presentation is downloaded by you it can be viewed in standard size display ratio of 4:3 or widescreen display ratio of 16:9. So hit the download button to make most of it.
-
 6 percentage increase over time ppt background
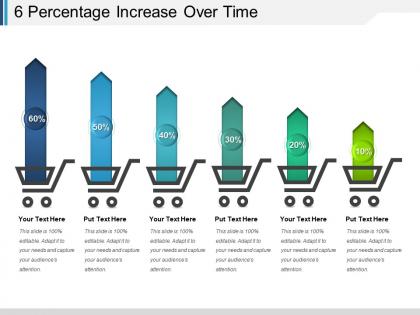
SlideTeam feels very happy in presenting to all of you this totally adjustable 6 percentage increase over time PPT background. This slideshow is 100% editable and user-friendly in nature thereby allowing you to edit the font color, font size and font style of the text used. The business template can be viewed in widescreen display ratio of 16:9 or standard size display ratio of 4:3 after being downloaded. The slides are also compatible with Google Slides, which makes it very easy to deal with.
-
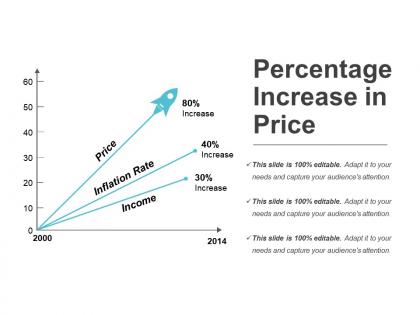 Percentage increase in price ppt diagrams
Presenting the percentage increase in price PPT diagrams PPT slide. Aesthetically designed and professionally equipped slides. High resolution and impressive picture quality which do not pixelate when projected on a wide screen. Compatible with multiple sets of software available both online and offline. PPT is compatible with a team of formats like JPEG, JPG and PDF. Modify the contents at your ease. 100 percent editable slide design. Execute the changes with the provided assistance. Personalize the contents with your company name and logo. Used by marketing managers, marketers, MBA students, and other professionals.
-
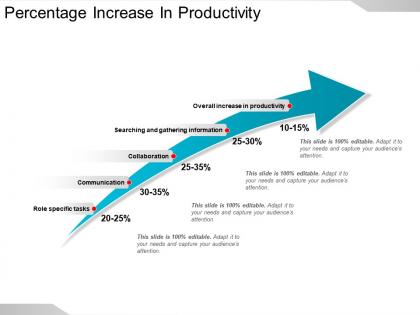 Percentage increase in productivity ppt example
Presenting a PPT template named Percentage increase in productivity PPT example. It is a professionally designed template and is fully customizable. You can edit the colour, text and font size as per your need. You can add or delete the content if required. The slide is compatible with Google Slides and can be exported in both PDF as well as JPG formats. You can avail this PPT slide in both standard screen size and wide screen size. Add or remove high quality graphic icons in the PPT slide. You are just a click to away to have this readymade presentation. Click the download button now.
-
 Displaying percentage values on a pie chart powerpoint templates
Introducing pie chart PowerPoint template. They are highly enriched PowerPoint template. They are conveniently flexible into different compositions like PDF, XML, and JPG etc. They have immensely trait features .They have quite amusing Presentation graphic design which provides enthralling experience to viewers. They have revise able vector based PPT layout, forms, shades, and icons. This PPT design provides enough storage space.
-
 Percentage value pie chart graphic design ppt background
Presenting percentage value pie chart graphic design PPT background PPT slide. PPT has high resolution impressive visuals. No fear of image pixelation when projected on widescreen. 100 percent editable slide design background. Ease of executing changes. Guidelines for carrying out changes have been provided. PPT is compatible with numerous online and offline software options. It is compatible with multiple format options like JPEG/JPG and PNG. It is compatible with Google Slides, Windows and Mac. Ease of personalization with company specific name, logo and trademark. Used by market analyst, business analysts, students and teachers.
-
 Percentage values with pie chart design ppt background images
Presenting percentage values with pie chart design PPT background images PPT slide. This PPT is equipped with professional proficiency, accuracy and aesthetic appeal. Ease of application. The graphics have no solid color background and hence can be used with any background. Scale to any size without loss of the display resolution. Customize each and every slide component with company name and logo. PPT is compatible with Windows and Mac and also with software and formats.
-
 Pie chart infographic with percentage values ppt background template
Presenting pie chart infographic with percentage values PPT background template PPT slide. It is impressively designed PowerPoint slides and is visually impressive. Well crafted and aesthetically sound. This is an immaculate presentation of visuals and colors. It is thoroughly editable slide design layout. Ease of customization. Ease of personalization with company-specific name, logo and trademark. Compatible with multiple format and software options. It is harmonious with Windows and Mac.
-
 Pie chart with percentage values ppt example 2018
Presenting a pie chart with percentage values PPT example 2018 PPT slide. There is the maintenance of superior quality visuals throughout the presentation. Compatible with widescreen output, without the fear of the pixelation. PPT can be effectively used with any number of online and offline software. The business slide example is harmonious with multiple format options. Give it a more personalized look with your company logo and name. Edit the PPT shape, colors, shade, text and more for making it more specific to your content. Used by marketing consultants, sales managers, and project managers.
-
 Pie chart with values and percentages ppt examples slides
Presenting a pie chart with values and percentages PPT examples slides PPT slide. The PPT has easy to modify colors, text, fonts, and backgrounds. Convenient to incorporate text and other personalized elements like company name and logo. Go a step ahead of clipart with our ease of designing PowerPoint presentation. Enjoy beyond smart art designing with our customizable slides. Use of vector based diagrams. No hassle of blurred view when projected on a large screen. PPT is compatible with numerous software and format options. Used by professionals and students and marketing professionals.
-
 Trade off percentage icon ppt summary
Presenting Trade Off Percentage Icon PPT Summary template. You can modify the font type, size, diagram color, and background color according to your requirement. This slide is compatible with Google Slides. Apart from that, it can be saved in multiple image or document formats such as JPEG, or PDF without any hassle. High-quality graphics are included so that quality does not deteriorate.
-
 Pie chart comparison with four different percentage
Presenting Pie Chart Comparison With Four Different Percentage. Made up of high-resolution graphics. Easy to download and can be saved in a variety of formats. Access to open on a widescreen preview. Compatible with the Google Slides and PowerPoint software. Alter the style, size, and the background of the slide icons as per your needs. Useful for business owners, students, and managers. Can be viewed on standard screen and widescreen without any fear of pixelation.
-
 People resource allocation showing percentages ppt icon
Presenting People Resource Allocation Showing Percentages PPT Icons. The template is readily available in both 4:3 and 16:9 aspect ratio. It is compatible with Google Slides, which makes it easily accessible at once. Can be changed into various formats like PDF, JPG, and PNG. You can customize the color, font, font type, and font size of the slide as per the requirements.
-
 Resource allocation showing different tasks with percentages ppt sample file
Presenting Resource Allocation Showing Different Tasks With Percentages PPT Sample File. Individualize this template as per your needs. Match it with your presentation theme by changing its colors, background, font type, and font size. It can be viewed on standard screen and widescreen without any fear of pixelation. Get this slide by converting into various file formats, including JPG, and PDF file formats. Its adaptability with Google Slides makes it accessible at once. Download this template now and deliver quality presentations in no time.


