Powerpoint Templates and Google slides for KPI
Save Your Time and attract your audience with our fully editable PPT Templates and Slides.
-
 Warehousing kpi dashboard showing goods in status
The presentation design is easy to edit by anyone even having without any specific knowledge. Design elements are editable including font, type, color, size, style, shape, background, images etc. Slides are completely compatible with Google Slides and MS PowerPoint software. Both standard and full screen view available; no change on design quality will happen when opened on full screen view.
-
 Warehousing kpi dashboard showing operating costs and order rate
The main advantage of this highly versatile PPT design is that it’s completely editable; you can include your business logo, trademarks to personalize the design. Also, you can include business related custom content over text place holders. Design can be opened and edited with Google Slides and MS PowerPoint software. You can download this PowerPoint design into JPEG and PDF formats.
-
 Warehousing kpi dashboard showing order status and active pickers
The design template is compatible with Google Slides and MS PowerPoint software. You can download this design into various formats such as JPEG or PDF format. The warehouse KPI dashboard PPT design template is 100% editable; you can modify and personalize the design according to your business requirements. Design is fully supported on standard and full screen view; no change in design quality on full screen view.
-
 Warehousing kpi dashboard showing perfect order rate and inventory accuracy
PPT design can instantly be downloaded as JPEG and PDF formats. Design template is easily editable, the best advantage of this business oriented PPT design is the use of excel linked charts, where charts in PPT design will automatically get changed when you update storage related figures on linked excel sheet. The PPT design is fully compatible with Google Slides and MS PowerPoint software. Design can be viewed both in standard and full screen view.
-
 Warehousing kpi dashboard showing picking rates and daily replenishments
The professionally built, business oriented slide is completely editable; you can modify and customize the design according to your business needs. You may include business logo, trademarks to personalize the slideshow. The slideshow can be opened and updated with Google Slides and MS PowerPoint software. Quick and easy downloading available; PPT design can be downloaded as JPEG or PDF format.
-
 Warehousing kpi dashboard showing stock value and dispatched items
This storage KPI dashboard PPT design is completely editable; you can modify and personalize the design as per your business needs; include business logo and trademark to look PPT more authentic, put your business warehousing figures in excel and linked charts in design will get updated automatically. You can download the design into JPEG or PDF formats; easy and swift downloading available. Design is compatible with Google Slides and MS PowerPoint software.
-
 Warehousing kpi dashboard showing total dispatches
This highly versatile PPT design is completely editable; you can modify and personalize the design according to your business needs. You can use excel linked chart to display your business related and figures in presentation. PPT slides are easily downloadable as JPEG or PDF formats. Design can be opened both in standard and wide screen view; no change on design quality on full screen view.
-
 Warehousing kpi dashboard showing weekly performance by picker
The best part of this PPT design is the use of excel linked editable charts. You can change your business related information, statistics and figures in excel sheet and changes will reflect in PPT design. PPT design is 100% editable; you can change the design elements according to your business needs. You can download and save this design as JPEG or PDF formats. Design is fully supported on Google Slides and MS PowerPoint software.
-
 Education and research kpi dashboard by country language and education types
Presenting education and research KPI dashboard by country language and education types PPT slide. The different language PPT template designed by the professional team of SlideTeam. The different country language report slide is fully editable in PowerPoint. The country language KPI report PowerPoint slide is compatible with Google Slide so a user can share this language dashboard slide with others. A user can make changes in the font size, font type, color as well as dimensions of the education distribution PPT template as per the requirement. You may edit the value in the new research program metric report template as the slide gets linked with the Excel sheet. .
-
 Education and research kpi dashboard showing attendance and suspension rate
Presenting education and research KPI dashboard showing attendance and suspension rate PPT slide. The suspension rate KPI dashboard PPT slide designed by the professional team of SlideTeam. The attendance rate report slide is 100% editable in PowerPoint. The attendance and detention KPI dashboard PowerPoint slide is compatible with Google Slide so a user can share this attendance rate dashboard slide with others. A user can make changes in the font size, font type, color as well as dimensions of the college acceptance rate dashboard PPT template as per the requirement. You may edit the value in the reporting tool KPI dashboard presentation template as the slide gets linked with the Excel sheet.
-
 Education and research kpi dashboard showing degree attainment and proficiency
Presenting education and research KPI dashboard showing degree attainment and proficiency PPT slide. The educational degree attainment KPI report presentation slide designed by the professional team of SlideTeam. The education population analysis PPT template is fully editable in PowerPoint. The research status KPI report presentation template is compatible with Google Slide so a user can share this degree attainment metric dashboard slide with others. A user can make changes in the font size, font type, color as well as dimensions of the proficiency KPI dashboard PPT slide as per the requirement. You may edit the value in the education proficiency report slide as the slide gets linked with the Excel sheet.
-
 Education and research kpi dashboard snapshot showing enrolment and sap
Presenting education and research KPI dashboard snapshot showing enrolment and SAP PPT slide. The enrolment and SAP analytic KPI dashboard PowerPoint template designed by the professional team of SlideTeam. The SAP package KPI report slide is fully editable in PowerPoint. The research SAP dashboard presentation slide is compatible with Google Slide so a user can share this SAP analytic dashboard slide with others. A user can make changes in the font size, font type, color as well as dimensions of the SAP analytics cloud business content dashboard PowerPoint template as per the requirement.
-
 Education and research kpi dashboard snapshot showing enrolment breakdown
Presenting education and research KPI dashboard snapshot showing enrolment breakdown PPT slide. The student enrolment dashboard PowerPoint slide designed by the professional team of SlideTeam. The enrolment page KPI report template is fully editable in PowerPoint. The research enrolment KPI report PPT template is compatible with Google Slide so a user can share this enrolment dashboard slide with others. A user can make changes in the font size, font type, color as well as dimensions of the campus and college dashboard slide as per the requirement. You may edit the value in the enrollment reporting system dashboard template as the slide gets linked with the Excel sheet.
-
 Education and research kpi dashboard showing research expenditure
Presenting education and research KPI dashboard showing research expenditure PPT slide. The expenditure on research and development presentation slide designed by the professional team of SlideTeam. The research expenditure PPT template is fully editable in PowerPoint. The research and development expenditure PowerPoint template is compatible with Google Slide so a user can share this dashboard slide with others. A user can make changes in the font size, font type, color as well as dimensions of the research expenditure PPT template as per the requirement. You may edit the value in the expense research and development presentation slide as the slide gets linked with the Excel sheet.
-
 Education and research kpi dashboard Snapshot showing research outputs and amount
Presenting education and research KPI dashboard snapshot showing research outputs and amount PPT slide. The research data metric presentation slide designed by professional team of SlideTeam. The education and research report PPT slide is 100% customizable in PowerPoint. The research amount KPI dashboard slide is also compatible with Google Slide so a user can share this slide with others. A user can make changes in the font size, font type, color as well as dimensions of the research key measure PPT template as per the requirement. You may edit the value in the research key measure PPT template as the slide gets linked with the Excel sheet.
-
 Education and research kpi dashboard showing research project allocation
Presenting education and research KPI dashboard showing research project allocation PPT slide. The project reporting design presentation template designed by professional team of SlideTeam. The research project PPT slide is fully customizable in PowerPoint. The project allocation dashboard PowerPoint slide is also compatible with Google Slide so a user can share this slide with others. A user can make changes in the font size, font type, color as well as dimensions of the allocated project report detail slide as per the requirement. You may edit the value in the education KPI dashboard PowerPoint template as the slide gets linked with the Excel sheet.
-
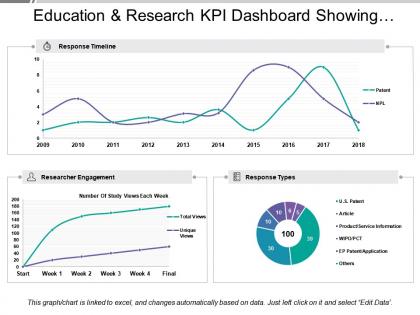 Education and research kpi dashboard showing response timeline and researcher engagement
Presenting education and research KPI dashboard showing response timeline and researcher engagement PPT slide. The education report PPT slide designed by professional team of SlideTeam. The research grant KPI dashboard presentation template is customizable in PowerPoint. The student attendance rate KPI report PowerPoint slide is also compatible with Google Slide so a user can share this template with others. A user can make changes in the font size, font type, color as well as dimensions of the education finance metric dashboard template as per the requirement. You may edit the value in the education KPI dashboard PowerPoint template as the slide gets linked with the Excel sheet. .
-
 Education and research kpi dashboard showing retention rate and admissions
Presenting education and research KPI dashboard showing retention rate and admissions PPT slide. The KPI for school teachers PPT slide designed by professional team of SlideTeam. The education presentation slide is customizable in PowerPoint. The education KPI dashboard PowerPoint template is also compatible with Google Slide so a user can share this template with others via the internet. A user can make changes in the font size, font type, color as well as dimensions of the key performance indicators for schools & education management PPT slide as per the requirement. You may edit the value in the KPI dashboard higher education template as the template get linked with Excel sheet.
-
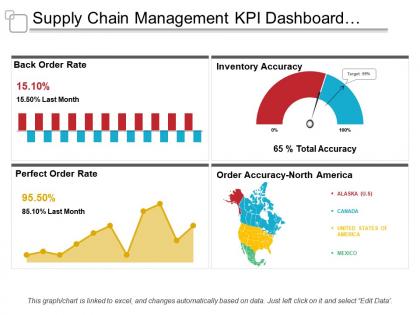 Supply chain management kpi dashboard showing back order rate and order accuracy
Presenting this set of slides with name - Supply Chain Management Kpi Dashboard Showing Back Order Rate And Order Accuracy. This is a four stage process. The stages in this process are Demand Forecasting, Predicting Future Demand, Supply Chain Management.
-
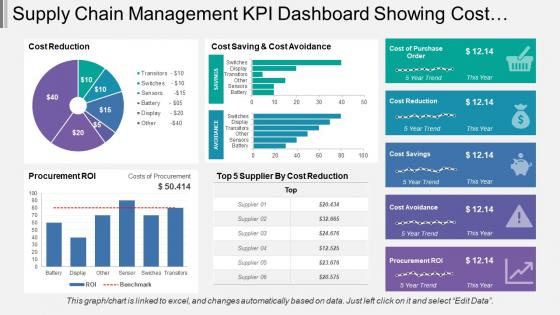 Supply Chain Management Kpi Dashboard Showing Cost Reduction And Procurement Roi
Presenting this set of slides with name - Supply Chain Management Kpi Dashboard Showing Cost Reduction And Procurement Roi. This is a five stage process. The stages in this process are Demand Forecasting, Predicting Future Demand, Supply Chain Management.
-
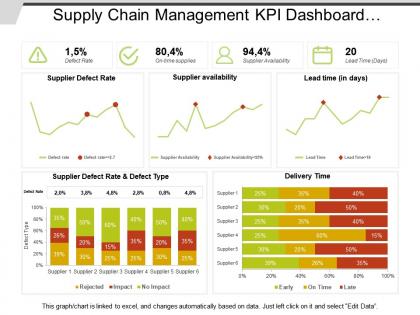 Supply chain management kpi dashboard showing defect rate and delivery time
Presenting this set of slides with name - Supply Chain Management Kpi Dashboard Showing Defect Rate And Delivery Time. This is a three stage process. The stages in this process are Demand Forecasting, Predicting Future Demand, Supply Chain Management.
-
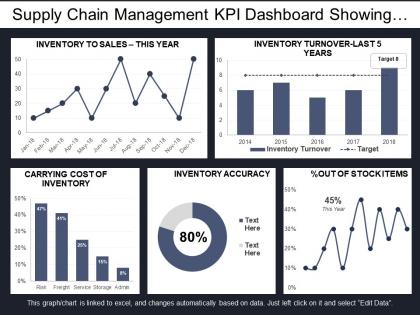 Supply chain management kpi dashboard showing inventory accuracy and turnover
Presenting this set of slides with name - Supply Chain Management Kpi Dashboard Showing Inventory Accuracy And Turnover. This is a five stage process. The stages in this process are Demand Forecasting, Predicting Future Demand, Supply Chain Management.
-
 Supply chain management kpi dashboard showing order status volume and inventory
Presenting this set of slides with name - Supply Chain Management Kpi Dashboard Showing Order Status Volume And Inventory. This is a two stage process. The stages in this process are Demand Forecasting, Predicting Future Demand, Supply Chain Management.
-
 Supply chain management kpi dashboard showing procurement vs utilization
Presenting this set of slides with name - Supply Chain Management Kpi Dashboard Showing Procurement Vs Utilization. This is a six stage process. The stages in this process are Demand Forecasting, Predicting Future Demand, Supply Chain Management.
-
 Supply chain management kpi dashboard showing quarterly inventory and asset turnover
Presenting this set of slides with name - Supply Chain Management Kpi Dashboard Showing Quarterly Inventory And Asset Turnover. This is a ten stage process. The stages in this process are Demand Forecasting, Predicting Future Demand, Supply Chain Management.
-
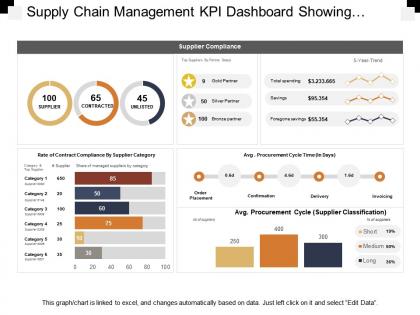 Supply chain management kpi dashboard showing supplier compliance stats
Presenting this set of slides with name - Supply Chain Management Kpi Dashboard Showing Supplier Compliance Stats. This is a four stage process. The stages in this process are Demand Forecasting, Predicting Future Demand, Supply Chain Management.
-
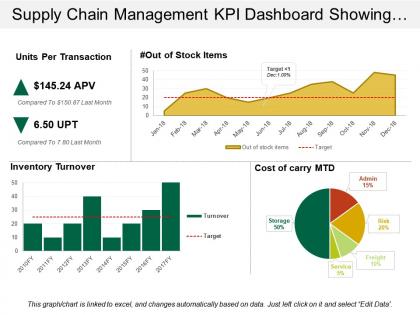 Supply chain management kpi dashboard showing units per transaction
Presenting predesigned Supply Chain Management KPI Dashboard Showing Warehouse Operating Costs PPT slide. Download of the template design is simple. You can modify the layout font type, font size, colors and the background as per needs. Template slide is fully flexible with Google Slides and other online software’s. You can alter the design using the instructional slides provided with the template. You can remove the watermark with your brand name, trademark, signature or logo. You can save the template into PNG or JPEG formats. Supreme quality layouts are used to create this template which is editable in PowerPoint. Sample content can be replaced with your presentation content.
-
 Supply chain management kpi dashboard showing warehouse operating costs
Presenting predesigned Supply Chain Management KPI Dashboard Showing Warehouse Operating Costs PPT slide. Download of the template design is simple. You can modify the layout font type, font size, colors and the background as per needs. Template slide is fully flexible with Google Slides and other online software’s. You can alter the design using the instructional slides provided with the template. You can remove the watermark with your brand name, trademark, signature or logo. You can save the template into PNG or JPEG formats. Supreme quality layouts are used to create this template which is editable in PowerPoint. Sample content can be replaced with your presentation content.
-
 Entertainment recreation and arts kpi dashboard average annual expenditure and time spent
Presenting this set of slides with name - Entertainment Recreation And Arts Kpi Dashboard Average Annual Expenditure And Time Spent. This is a three stage process. The stages in this process are Entertainment, Recreation And Arts, Attractions, Culture, Entertainment.
-
 Entertainment recreation and arts kpi dashboard distribution of video game sales
Presenting this set of slides with name - Entertainment Recreation And Arts Kpi Dashboard Distribution Of Video Game Sales. This is a four stage process. The stages in this process are Entertainment, Recreation And Arts, Attractions, Culture, Entertainment.
-
 Entertainment recreation and arts kpi dashboard market value and percentage of time spend
Presenting this set of slides with name - Entertainment Recreation And Arts Kpi Dashboard Market Value And Percentage Of Time Spend. This is a three stage process. The stages in this process are Entertainment, Recreation And Arts, Attractions, Culture, Entertainment.
-
 Entertainment recreation and arts kpi dashboard revenue players and payers
Presenting this set of slides with name - Entertainment Recreation And Arts Kpi Dashboard Revenue Players And Payers. This is a four stage process. The stages in this process are Entertainment, Recreation And Arts, Attractions, Culture, Entertainment.
-
 Entertainment recreation and arts kpi dashboard revenue ticketing merchandise vip and guest
Presenting this set of slides with name - Entertainment Recreation And Arts Kpi Dashboard Revenue Ticketing Merchandise Vip And Guest. This is a four stage process. The stages in this process are Entertainment, Recreation And Arts, Attractions, Culture, Entertainment.
-
 Entertainment recreation and arts kpi dashboard showing active daily players and today tournaments
Presenting this set of slides with name - Entertainment Recreation And Arts Kpi Dashboard Showing Active Daily Players And Today Tournaments. This is a four stage process. The stages in this process are Entertainment, Recreation And Arts, Attractions, Culture, Entertainment.
-
 Entertainment recreation and arts kpi dashboard showing digital media sources of capital
Presenting this set of slides with name - Entertainment Recreation And Arts Kpi Dashboard Showing Digital Media Sources Of Capital. This is a three stage process. The stages in this process are Entertainment, Recreation And Arts, Attractions, Culture, Entertainment.
-
 Entertainment recreation and arts kpi dashboard showing market revenue growth
Presenting this set of slides with name - Entertainment Recreation And Arts Kpi Dashboard Showing Market Revenue Growth. This is a two stage process. The stages in this process are Entertainment, Recreation And Arts, Attractions, Culture, Entertainment.
-
 Entertainment recreation and arts kpi dashboard showing of media usage and time spent per user
Presenting this set of slides with name - Entertainment Recreation And Arts Kpi Dashboard Showing Of Media Usage And Time Spent Per User. This is a four stage process. The stages in this process are Entertainment, Recreation And Arts, Attractions, Culture, Entertainment.
-
 Entertainment recreation and arts kpi dashboard spend per head and hour spend online on social media
Presenting this set of slides with name - Entertainment Recreation And Arts Kpi Dashboard Spend Per Head And Hour Spend Online On Social Media. This is a four stage process. The stages in this process are Entertainment, Recreation And Arts, Attractions, Culture, Entertainment.
-
 Workforce kpi dashboard showing average age female percentage and average tenure
Presenting this set of slides with name - Workforce Kpi Dashboard Showing Average Age Female Percentage And Average Tenure. This is a four stage process. The stages in this process are Staff, Personnel, Workforce.
-
 Workforce kpi dashboard showing dynamics structure and span of control
Presenting this set of slides with name - Workforce Kpi Dashboard Showing Dynamics Structure And Span Of Control. This is a two stage process. The stages in this process are Staff, Personnel, Workforce.
-
 Workforce kpi dashboard showing headcount full time employee and turnover rate
Presenting this set of slides with name - Workforce Kpi Dashboard Showing Headcount Full Time Employee And Turnover Rate. This is a three stage process. The stages in this process are Staff, Personnel, Workforce.
-
 Workforce kpi dashboard showing number of employee overhead ratio and salary
Presenting this set of slides with name - Workforce Kpi Dashboard Showing Number Of Employee Overhead Ratio And Salary. This is a three stage process. The stages in this process are Staff, Personnel, Workforce.
-
 Workforce kpi dashboard showing part time vs full time employee
Presenting this set of slides with name - Workforce Kpi Dashboard Showing Part Time Vs Full Time Employee. This is a four stage process. The stages in this process are Staff, Personnel, Workforce.
-
 Workforce kpi dashboard showing resignation rate manager instability rate and performance workflow process
Presenting this set of slides with name - Workforce Kpi Dashboard Showing Resignation Rate Manager Instability Rate And Performance Workflow Process. This is a six stage process. The stages in this process are Staff, Personnel, Workforce.
-
 Workforce kpi dashboard showing staff split by gender and average tenure by department
Presenting this set of slides with name - Workforce Kpi Dashboard Showing Staff Split By Gender And Average Tenure By Department. This is a six stage process. The stages in this process are Staff, Personnel, Workforce.
-
 Workforce kpi dashboard showing starters headcount leavers promotions and joiners
Presenting this set of slides with name - Workforce Kpi Dashboard Showing Starters Headcount Leavers Promotions And Joiners. This is a three stage process. The stages in this process are Staff, Personnel, Workforce.
-
 Workforce kpi dashboard showing visibility headcount and direct compensation change
Presenting this set of slides with name - Workforce Kpi Dashboard Showing Visibility Headcount And Direct Compensation Change. This is a five stage process. The stages in this process are Staff, Personnel, Workforce.
-
 Workforce planning kpi dashboard showing salary merit bonus headcount and performance
Presenting this set of slides with name - Workforce Planning Kpi Dashboard Showing Salary Merit Bonus Headcount And Performance. This is a five stage process. The stages in this process are Staff, Personnel, Workforce.
-
 Transportation kpi dashboard showing cost and on time final delivery
Presenting transportation KPI dashboard showing cost and on time final delivery PPT slide. This deck offers you plenty of space to put in titles and sub titles. This template is Excel linked just right click to input your information. High resolution based layout, does not change the image even after resizing. This presentation icon is fully compatible with Google slides. Quick downloading speed and simple editing options in color text and fonts.PPT icons can easily be changed into JPEG and PDF applications.
-
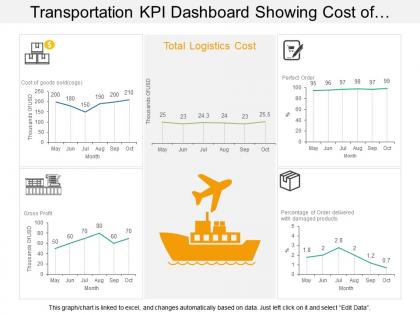 Transportation kpi dashboard showing cost of good sold logistics cost and gross profit
Presenting KPI dashboard showing cost of goods sold logistics cost and gross profit PPT slide. This layout is fully compatible with Google slides and data driven. User can edit the data in linked excel sheet and graphs and charts gets customized accordingly. Easy to put in company logo, trademark or name; accommodate words to support the key points. Images do no distort out even when they are projected on large screen. Adjust colors, text and fonts as per your business requirements
-
 Transportation kpi dashboard snapshot showing fleet delivery status loading time and weight
Presenting transportation KPI dashboard snapshot showing fleet delivery status loading time and weight PPT slide. Simple data input with linked Excel chart, just right click to input values. This PowerPoint theme is fully supported by Google slides. Picture quality of these slides does not change even when project on large screen. Fast downloading speed and formats can be easily changed to JPEG and PDF applications. This template is suitable for marketing, sales persons, business managers and entrepreneurs.
-
 Transportation kpi dashboard showing maintenance cost insurance cost available fleet
Presenting transportation KPI dashboard showing maintenance cost insurance cost available fleet PowerPoint slide. Simple data input with linked Excel chart, just right click to input values. This PowerPoint theme is fully supported by Google slides. Picture quality of these slides does not change even when project on large screen. Fast downloading speed and formats can be easily changed to JPEG and PDF applications. This template is suitable for marketing, sales persons, business managers and entrepreneurs. Adjust PPT layout, font, text and color as per your necessity.
-
 Transportation kpi dashboard snapshot showing revenue costs profit fleet status
Presenting KPI dashboard snapshot showing revenue costs profit fleet status slideshow. Change PowerPoint structure, font, text, color and design as per your requirements. Easy to input data with excel linked charts, just right to click to input data. This presentation theme is totally attuned with Google slides. Easy conversion to other software’s like JPG and PDF formats. Image quality of these PPT diagram remains the unchanged even when you resize the image or portray on large screens.
-
 Transportation kpi dashboard showing shipments by country and transit time
Presenting transportation KPI Dashboard showing shipments by country and transit time PPT slide. This deck offers you plenty of space to put in titles and subtitles. This template is Excel linked just right click to input your information. High resolution based layout, does not change the image even after resizing. This presentation icon is fully compatible with Google slides. Quick downloading speed and simple editing options in color text and fonts.PPT icons can easily be changed into JPEG and PDF applications
-
 Transportation kpi dashboard snapshot showing shipments ground vs air channel
Presenting our transportation KPI dashboard snapshot showing shipments ground vs. air channel PPT slide. This layout is compatible with Google slides and data can be updated with excel linked file. This template is Excel linked just right click to input your information. Images do no blur out even when they are projected on large screen.PPT template can be utilized by sales and marketing teams and business managers. Instantly downloadable slide and supports formats like JPEG and PDF.
-
 Transportation kpi dashboard showing shipping revenue and outbound shipping costs
Presenting transportation KPI dashboard showing shipping revenue and outbound shipping costs PPT slide. Simple data input like company logo, name or trademark. User can edit the data in linked excel sheet and graphs and charts gets customized accordingly .This PPT slide offers you plenty of space to put in titles and sub titles. High resolution based presentation layout, does not change the image even after resizing. This presentation icon is data driven and template can be downloaded via excel file to incorporate data.
-
 Transportation kpi dashboard snapshot showing warehouse operating cost distribution
Presenting transportation KPI dashboard snapshot showing warehouse operating cost distribution PPT slide. Simple data input like company logo, name or trademark. User can edit the data in linked excel sheet and graphs and charts gets customized accordingly. Picture quality of these slides does not change even when project on large screen. Fast downloading speed and formats can be easily changed to JPEG and PDF applications. This template is suitable for marketing, sales persons, business managers and entrepreneurs.
-
 Transportation kpi dashboard showing warehouse operating costs perfect order rate
Presenting transportation KPI dashboard showing warehouse operating costs perfect order rate PPT slide. This layout is fully compatible with Google slides and data driven. User can edit the data in linked excel sheet and graphs and charts gets customized accordingly. Easy to put in company logo, trademark or name; accommodate words to support the key points. Images do no distort out even when they are projected on large screen. Adjust colors, text and fonts as per your business requirements.
-
 Banking kpi dashboard assets cash flow liabilities income statement
Presenting this set of slides with name - Banking Kpi Dashboard Assets Cash Flow Liabilities Income Statement. This is a three stage process. The stages in this process are Banking, Finance, Money.
-
 Banking kpi dashboard showing accounts expenditures fundings
Presenting this set of slides with name - Banking Kpi Dashboard Showing Accounts Expenditures Fundings. This is a three stage process. The stages in this process are Banking, Finance, Money.


