Powerpoint Templates and Google slides for KPI
Save Your Time and attract your audience with our fully editable PPT Templates and Slides.
-
 Advertising kpi for commercial videos online video brand images powerpoint slide
Presenting advertising kpi for commercial videos online video brand images powerpoint slide. This presentation slide shows three Key Performance Indicators or KPIs in a Dashboard style design. The first KPI that can be shown is Number of Times Commercial Videos From Brand are Watched Online. The second KPI is Number of People That Posted Video Online About Brand and the third is Number of People That Posted Pictures Focused on Brand. These KPI Powerpoint graphics are all data driven, and the shape automatically adjusts according to your data. Just right click on the KPI graphic, enter the right value and the shape will adjust automatically. Make a visual impact with our KPI slides.
-
 Brand Followers Kpi On Social Networks Microblogging Site Focused Groups Ppt Slide
Presenting brand followers kpi on social networks microblogging site focused groups ppt slide. This presentation slide shows three Key Performance Indicators or KPIs in a Dashboard style design. The first KPI that can be shown is Number of Followers of Brand on Social Networks. The second KPI is Number of Followers of Brand on Micro Blogging Site and the third is Number of People That Joined Groups Focused on Brand. These KPI Powerpoint graphics are all data driven, and the shape automatically adjusts according to your data. Just right click on the KPI graphic, enter the right value and the shape will adjust automatically. Make a visual impact with our KPI slides.
-
 Branding Kpi For Micro Blog Post Social Network Brand Survey Presentation Slide
Presenting branding kpi for micro blog post social network brand survey presentation slide. This presentation slide shows three Key Performance Indicators or KPIs in a Dashboard style design. The first KPI that can be shown is Number of People That Posted a Micro Blog About Brand. The second KPI is Number of People That Posted Social Network Status Focused on Brand and the third is Number of People That Joined Online Panel or Survey For Brand. These KPI Powerpoint graphics are all data driven, and the shape automatically adjusts according to your data. Just right click on the KPI graphic, enter the right value and the shape will adjust automatically. Make a visual impact with our KPI slides.
-
 Content creation kpi for story published about page powerpoint slide
Presenting content creation kpi for story published about page powerpoint slide. This presentation slide shows two Key Performance Indicators or KPIs in a Dashboard style design. The first KPI that can be shown is Number of Impressions of a Story Published By a Friend About Your Page. The second KPI is Number of People Who Saw Your Page or One of Its Posts From a Story Published By a Friend. These KPI Powerpoint graphics are all data driven, and the shape automatically adjusts according to your data. Just right click on the KPI graphic, enter the right value and the shape will adjust automatically. Make a visual impact with our KPI slides.
-
 Conversion rate percentage kpi for social media online traffic ppt slide
Presenting conversion rate percentage kpi for social media online traffic ppt slide. This presentation slide shows one Key Performance Indicators or KPIs in a Dashboard style design. The first KPI that can be shown is Conversion Rate of Social Media Online Traffic. These KPI Powerpoint graphics are all data driven, and the shape automatically adjusts according to your data. Just right click on the KPI graphic, enter the right value and the shape will adjust automatically. Make a visual impact with our KPI slides.
-
 Data analytics kpi for page viewed stories domain impressions presentation slide
Presenting data analytics kpi for page viewed stories domain impressions presentation slide. This presentation slide shows two Key Performance Indicators or KPIs in a Dashboard style design. The first KPI that can be shown is Number of Times People Viewed Stories That Link to Your Site in News Feed or Page. The second KPI is Number of Comments Box Impressions on Your Domain. These KPI Powerpoint graphics are all data driven, and the shape automatically adjusts according to your data. Just right click on the KPI graphic, enter the right value and the shape will adjust automatically. Make a visual impact with our KPI slides.
-
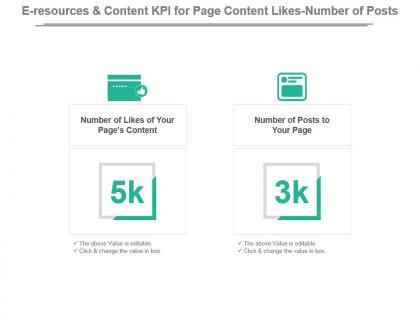 E resources and content kpi for page content likes number of posts powerpoint slide
Presenting e resources and content kpi for page content likes number of posts powerpoint slide. This presentation slide shows two Key Performance Indicators or KPIs in a Dashboard style design. The first KPI that can be shown is Number of Likes of Your Pages Content. The second KPI is Number of Posts to Your Page. These KPI Powerpoint graphics are all data driven, and the shape automatically adjusts according to your data. Just right click on the KPI graphic, enter the right value and the shape will adjust automatically. Make a visual impact with our KPI slides.
-
 E resources and content kpi for post impressions viewed page posts ppt slide
Presenting e resources and content kpi for post impressions viewed page posts ppt slide. This presentation slide shows two Key Performance Indicators or KPIs in a Dashboard style design. The first KPI that can be shown is Number of Discussions Created on Your Pages Discussion Board. The second KPI is Number of Existing Reviews Modified For Your Page. These KPI Powerpoint graphics are all data driven, and the shape automatically adjusts according to your data. Just right click on the KPI graphic, enter the right value and the shape will adjust automatically. Make a visual impact with our KPI slides.
-
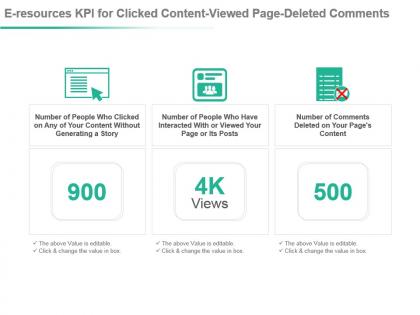 E resources kpi for clicked content viewed page deleted comments presentation slide
Presenting e resources kpi for clicked content viewed page deleted comments presentation slide. This presentation slide shows three Key Performance Indicators or KPIs in a Dashboard style design. The first KPI that can be shown is Number of People Who Clicked on Any of Your Content Without Generating a Story. The second KPI is Number of People Who Have Interacted With or Viewed Your Page or Its Posts and the third is Number of Comments Deleted on Your Pages Content. These KPI Powerpoint graphics are all data driven, and the shape automatically adjusts according to your data. Just right click on the KPI graphic, enter the right value and the shape will adjust automatically. Make a visual impact with our KPI slides.
-
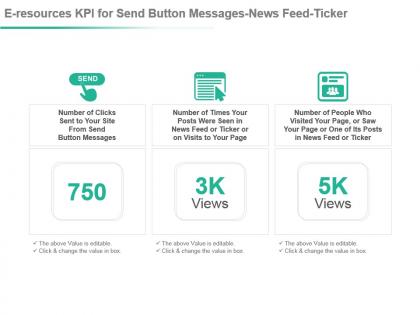 E resources kpi for send button messages news feed ticker powerpoint slide
Presenting e resources kpi for send button messages news feed ticker powerpoint slide. This presentation slide shows three Key Performance Indicators or KPIs in a Dashboard style design. The first KPI that can be shown is Number of Clicks Sent to Your Site From Send Button Messages. The second KPI is Number of Times Your Posts Were Seen in News Feed or Ticker or on Visits to Your Page and the third is Number of People Who Visited Your Page, or Saw Your Page or One of Its Posts in News Feed or Ticker. These KPI Powerpoint graphics are all data driven, and the shape automatically adjusts according to your data. Just right click on the KPI graphic, enter the right value and the shape will adjust automatically. Make a visual impact with our KPI slides.
-
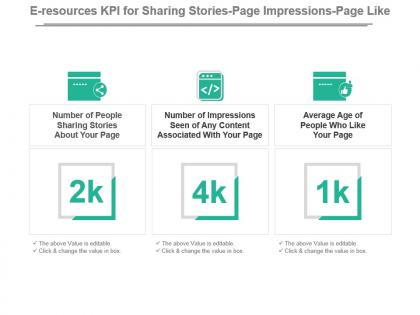 E resources kpi for sharing stories page impressions page like ppt slide
Presenting e resources kpi for sharing stories page impressions page like ppt slide. This presentation slide shows three Key Performance Indicators or KPIs in a Dashboard style design. The first KPI that can be shown is Number of People Sharing Stories About Your Page. The second KPI is Number of Impressions Seen of Any Content Associated With Your Page and the third is Average Age of People Who Like Your Page. These KPI Powerpoint graphics are all data driven, and the shape automatically adjusts according to your data. Just right click on the KPI graphic, enter the right value and the shape will adjust automatically. Make a visual impact with our KPI slides.
-
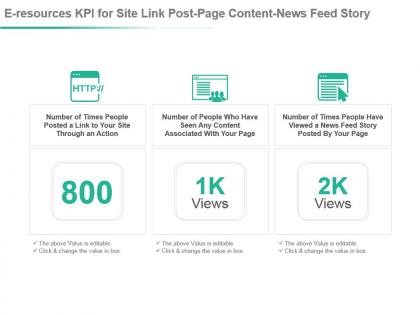 E resources kpi for site link post page content news feed story presentation slide
Presenting e resources kpi for site link post page content news feed story presentation slide. This presentation slide shows three Key Performance Indicators or KPIs in a Dashboard style design. The first KPI that can be shown is Number of Times People Posted a Link to Your Site Through an Action. The second KPI is Number of People Who Have Seen Any Content Associated With Your Page and the third is Number of Times People Have Viewed a News Feed Story Posted By Your Page. These KPI Powerpoint graphics are all data driven, and the shape automatically adjusts according to your data. Just right click on the KPI graphic, enter the right value and the shape will adjust automatically. Make a visual impact with our KPI slides.
-
 Impressions kpi for sponsored story advertisement page posts powerpoint slide
Presenting impressions kpi for sponsored story advertisement page posts powerpoint slide. This presentation slide shows three Key Performance Indicators or KPIs in a Dashboard style design. The first KPI that can be shown is Number of Impressions of a Sponsored Story or Ad Pointing to Your Page. The second KPI is Number of People Who Saw a Sponsored Story or Ad About Your Page and the third is Number of Impressions of Your Page Posts in an Ad or Sponsored Story. These KPI Powerpoint graphics are all data driven, and the shape automatically adjusts according to your data. Just right click on the KPI graphic, enter the right value and the shape will adjust automatically. Make a visual impact with our KPI slides.
-
 Klout score potential reach number of uploads social media kpi ppt slide
Presenting klout score potential reach number of uploads social media kpi ppt slide. This presentation slide shows three Key Performance Indicators or KPIs in a Dashboard style design. The first KPI that can be shown is Klout Score. The second KPI is Potential Reach and the third is Number of uploads. These KPI Powerpoint graphics are all data driven, and the shape automatically adjusts according to your data. Just right click on the KPI graphic, enter the right value and the shape will adjust automatically. Make a visual impact with our KPI slides.
-
 Kpi for account users non existing account users page stories presentation slide
Presenting kpi for account users non existing account users page stories presentation slide. This presentation slide shows three Key Performance Indicators or KPIs in a Dashboard style design. The first KPI that can be shown is Number of Views of Page From Logged in Users. The second KPI is Number of Views of Page From Not Logged in Users and the third is Number of Stories Created About Your Page. These KPI Powerpoint graphics are all data driven, and the shape automatically adjusts according to your data. Just right click on the KPI graphic, enter the right value and the shape will adjust automatically. Make a visual impact with our KPI slides.
-
 Kpi For Blog Post Times Online Video Game Ppt Slide
Presenting kpi for blog post times online video game ppt slide. This presentation slide shows three Key Performance Indicators or KPIs in a Dashboard style design. The first KPI that can be shown is Number of People That Read Blog Post Sponsored By Brand. The second KPI is Number of Times That Blog Posts Sponsored By Brand Are Read and the third is Number of People That Played Online Video Game Sponsored By Brand. These KPI Powerpoint graphics are all data driven, and the shape automatically adjusts according to your data. Just right click on the KPI graphic, enter the right value and the shape will adjust automatically. Make a visual impact with our KPI slides.
-
 Kpi For Blog Posts People Social Network Status Focused On Brand Powerpoint Slide
Presenting kpi for blog posts people social network status focused on brand powerpoint slide. This presentation slide shows three Key Performance Indicators or KPIs in a Dashboard style design. The first KPI that can be shown is Number Blog Posts Posted Focused on Brand. The second KPI is Number of People That Posted Blog Posts Focused on Brand and the third is Number of Social Network Statuses Posted Focused on Brand. These KPI Powerpoint graphics are all data driven, and the shape automatically adjusts according to your data. Just right click on the KPI graphic, enter the right value and the shape will adjust automatically. Make a visual impact with our KPI slides.
-
 Kpi for number of feedback entries received on brand website presentation slide
Presenting kpi for number of feedback entries received on brand website presentation slide. This presentation slide shows one Key Performance Indicators or KPIs in a Dashboard style design. The first KPI that can be shown is Number of Feedback Entries on Brand Website. These KPI Powerpoint graphics are all data driven, and the shape automatically adjusts according to your data. Just right click on the KPI graphic, enter the right value and the shape will adjust automatically. Make a visual impact with our KPI slides.
-
 Kpi for number of news feed clicks send button impressions powerpoint slide
Presenting kpi for number of news feed clicks send button impressions powerpoint slide. This presentation slide shows two Key Performance Indicators or KPIs in a Dashboard style design. The first KPI that can be shown is Number of Clicks Sent to Your Site From Stories in News Feed or Page. The second KPI is Number of Impressions on The Send Button on Your Domain. These KPI Powerpoint graphics are all data driven, and the shape automatically adjusts according to your data. Just right click on the KPI graphic, enter the right value and the shape will adjust automatically. Make a visual impact with our KPI slides.
-
 Kpi for number of times people comments viewed clicked ppt slide
Presenting kpi for number of times people comments viewed clicked ppt slide. This presentation slide shows three Key Performance Indicators or KPIs in a Dashboard style design. The first KPI that can be shown is Number of Times People Left Comments on Your Site Using The Comments Plugin. The second KPI is Number of Times People Viewed Like Buttons on Your Site and the third is Number of Times People Clicked The Like Button on Your Site. These KPI Powerpoint graphics are all data driven, and the shape automatically adjusts according to your data. Just right click on the KPI graphic, enter the right value and the shape will adjust automatically. Make a visual impact with our KPI slides.
-
 Kpi for number of unlikes people comments on page presentation slide
Presenting kpi for number of unlikes people comments on page presentation slide. This presentation slide shows three Key Performance Indicators or KPIs in a Dashboard style design. The first KPI that can be shown is Number of Unlikes of Your Page. The second KPI is Number of People Who Are Friends of The Fans of Your Page and the third is Number of Comments Created on Your Pages Content. These KPI Powerpoint graphics are all data driven, and the shape automatically adjusts according to your data. Just right click on the KPI graphic, enter the right value and the shape will adjust automatically. Make a visual impact with our KPI slides.
-
 Kpi for online video games played users added item to favorites powerpoint slide
Presenting kpi for online video games played users added item to favorites powerpoint slide. This presentation slide shows two Key Performance Indicators or KPIs in a Dashboard style design. The first KPI that can be shown is Number of Times That Online Video Games Sponsored By Brand Are Played. The second KPI is Number of Users That Added Item to Favorites. These KPI Powerpoint graphics are all data driven, and the shape automatically adjusts according to your data. Just right click on the KPI graphic, enter the right value and the shape will adjust automatically. Make a visual impact with our KPI slides.
-
 Project Dashboard Snapshot With Kpi Status Risks Project Area Issues
Presenting this set of slides with name - Project Dashboard Snapshot With Kpi Status Risks Project Area Issues. This is a four stage process. The stages in this process are Project Review, Project Analysis, Project Performance management.
-
 Business kpi showing employee analysing the graph of companys performance indicator
Presenting this set of slides with name - Business Kpi Showing Employee Analysing The Graph Of Companys Performance Indicator. This is a four stage process. The stages in this process are Business Kpi, Business Dashboard, Business Metrics.
-
 Analytic data chart of business kpi image showing employee working on desktop
Presenting this set of slides with name - Analytic Data Chart Of Business Kpi Image Showing Employee Working On Desktop. This is a three stage process. The stages in this process are Business Kpi, Business Dashboard, Business Metrics.
-
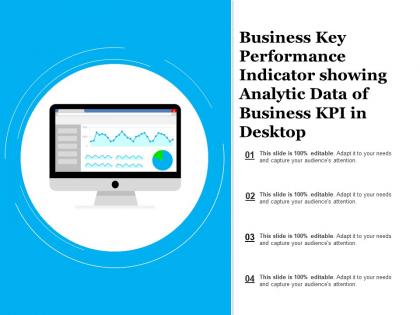 Business key performance indicator showing analytic data of business kpi in desktop
Presenting this set of slides with name - Business Key Performance Indicator Showing Analytic Data Of Business Kpi In Desktop. This is a four stage process. The stages in this process are Business Kpi, Business Dashboard, Business Metrics.
-
 Business kpi contain visualization aid of analytic data in form of bar chart
Presenting this set of slides with name - Business Kpi Contain Visualization Aid Of Analytic Data In Form Of Bar Chart. This is a four stage process. The stages in this process are Business Kpi, Business Dashboard, Business Metrics.
-
 Business kpi showing graphs key performance indicator in tablets and documents
Presenting this set of slides with name - Business Kpi Showing Graphs Key Performance Indicator In Tablets And Documents. This is a four stage process. The stages in this process are Business Kpi, Business Dashboard, Business Metrics.
-
 Business kpi showing key performance indicator of company through target point and line graph
Presenting this set of slides with name - Business Kpi Showing Key Performance Indicator Of Company Through Target Point And Line Graph. This is a three stage process. The stages in this process are Business Kpi, Business Dashboard, Business Metrics.
-
 Business kpi showing summary of key performance indicator data representation in line graph and pie chart
Presenting this set of slides with name - Business Kpi Showing Summary Of Key Performance Indicator Data Representation In Line Graph And Pie Chart. This is a three stage process. The stages in this process are Business Kpi, Business Dashboard, Business Metrics.
-
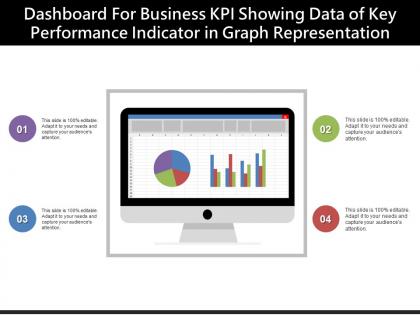 Dashboard for business kpi showing data of key performance indicator in graph representation
Presenting this set of slides with name - Dashboard For Business Kpi Showing Data Of Key Performance Indicator In Graph Representation. This is a four stage process. The stages in this process are Business Kpi, Business Dashboard, Business Metrics.
-
 Employee looking at the graph of business kpi in tablet covering bar graphs and pie charts
Presenting this set of slides with name - Employee Looking At The Graph Of Business Kpi In Tablet Covering Bar Graphs And Pie Charts. This is a four stage process. The stages in this process are Business Kpi, Business Dashboard, Business Metrics.
-
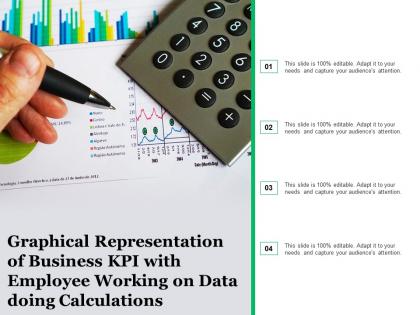 Graphical representation of business kpi with employee working on data doing calculations
Presenting this set of slides with name - Graphical Representation Of Business Kpi With Employee Working On Data Doing Calculations. This is a four stage process. The stages in this process are Business Kpi, Business Dashboard, Business Metrics.
-
 Summary of key performance showing graphical representation of business kpi in bar graphs and pie charts
Presenting this set of slides with name - Summary Of Key Performance Showing Graphical Representation Of Business Kpi In Bar Graphs And Pie Charts. This is a three stage process. The stages in this process are Business Kpi, Business Dashboard, Business Metrics.
-
 Visualization representation of business kpi data showing chart and graph of financial data
Presenting this set of slides with name - Visualization Representation Of Business Kpi Data Showing Chart And Graph Of Financial Data. This is a four stage process. The stages in this process are Business Kpi, Business Dashboard, Business Metrics.
-
 Engineering procurement and construction kpi dashboard showing cost of purchase order and cost reduction
You can use this PPT slideshow very easily as it is fully customizable. You can effortlessly insert or remove any diagrammatic representation from the given template. The font size, font color and font style can be easily edited. This graph PPT is linked to excel and changes automatically based on the data you enter. You can save the deck in either PDF or JPG format. To make any changes in the PPT slideshow, simply follow the instructions given in the sample slides. The size, color and orientation of all shapes are 100% customizable, so don’t waste any further time and download this presentation.
-
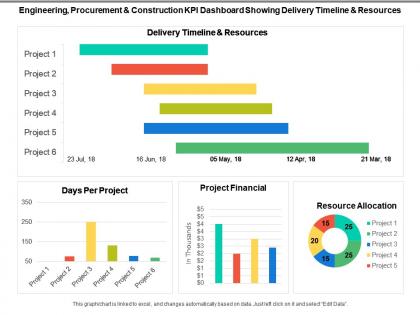 Engineering procurement and construction kpi dashboard showing delivery timeline and resources
Presenting this set of slides with name - Engineering Procurement And Construction Kpi Dashboard Showing Delivery Timeline And Resources. This is a four stage process. The stages in this process are Engineering, Procurement And Construction, Construction Management, Engineering, Purchasing And Construction .
-
 Engineering procurement and construction kpi dashboard showing net project revenue per employee
Presenting this set of slides with name - Engineering Procurement And Construction Kpi Dashboard Showing Net Project Revenue Per Employee. This is a two stage process. The stages in this process are Engineering, Procurement And Construction, Construction Management, Engineering, Purchasing And Construction .
-
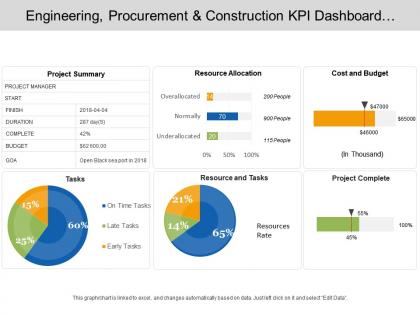 Engineering procurement and construction kpi dashboard showing project summary cost and budget
Presenting this set of slides with name - Engineering Procurement And Construction Kpi Dashboard Showing Project Summary Cost And Budget. This is a four stage process. The stages in this process are Engineering, Procurement And Construction, Construction Management, Engineering, Purchasing And Construction .
-
 Social media kpi dashboard of facebook twitter instagram clicks followers
Presenting this set of slides with name - Social Media Kpi Dashboard Of Facebook Twitter Instagram Clicks Followers. This is a four stage process. The stages in this process are Social Media, Digital Marketing, Social Marketing.
-
 Social media kpi dashboard showing conversions by social network and metrics
Presenting this set of slides with name - Social Media Kpi Dashboard Showing Conversions By Social Network And Metrics. This is a five stage process. The stages in this process are Social Media, Digital Marketing, Social Marketing.
-
 Social media kpi dashboard showing facebook impression by demographic instagram key metrics
Presenting this set of slides with name - Social Media Kpi Dashboard Showing Facebook Impression By Demographic Instagram Key Metrics. This is a four stage process. The stages in this process are Social Media, Digital Marketing, Social Marketing.
-
 Social media kpi dashboard showing facebook investment returns conversion from ads
Presenting this set of slides with name - Social Media Kpi Dashboard Showing Facebook Investment Returns Conversion From Ads. This is a five stage process. The stages in this process are Social Media, Digital Marketing, Social Marketing.
-
 Social media kpi dashboard showing facebook page stats youtube channel views
Presenting this set of slides with name - Social Media Kpi Dashboard Showing Facebook Page Stats Youtube Channel Views. This is a five stage process. The stages in this process are Social Media, Digital Marketing, Social Marketing.
-
 Social media kpi dashboard showing followers facebook daily reach
SlideTeam presents the Social media KPI dashboard showing followers Facebook daily reach This slideshow is modifiable according to your needs as you can make all the required changes to it whenever you feel like. You can edit the font size and font style. These slides are fully compatible with Google Slides. You can view the presentation on both 16:9 widescreen side as well as the 4:3 standard screen size. You can save them in either JPG or PDF format.
-
 Social media kpi dashboard showing page viewsvisits conversion per source
Presenting this set of slides with name - Social Media Kpi Dashboard Showing Page Viewsvisits Conversion Per Source. This is a four stage process. The stages in this process are Social Media, Digital Marketing, Social Marketing.
-
 Social media kpi dashboard showing traffic social events referral traffic
Presenting this set of slides with name - Social Media Kpi Dashboard Showing Traffic Social Events Referral Traffic. This is a four stage process. The stages in this process are Social Media, Digital Marketing, Social Marketing.
-
 Social media kpi dashboard showing youtube amplification rate conversion
We introduces to you its new Social media KPI dashboard showing YouTube amplification rate conversion PowerPoint template. You can download the business template, edit the data in the excel sheet and the graph changes dynamically. You can add backgrounds to all of the slides. This presentation is available for free download in JPG and PDF format. All the slides in this presentation are fully compatible with Google slides. You can view this document in widescreen size and standard screen size.
-
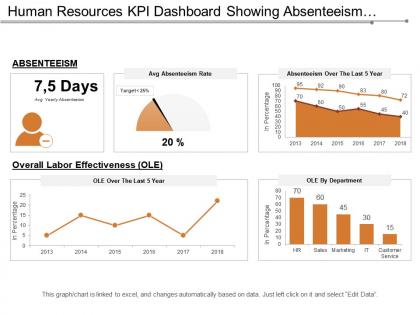 Human resources kpi dashboard showing absenteeism overall labor effectiveness
Presenting this set of slides with name - Human Resources Kpi Dashboard Showing Absenteeism Overall Labor Effectiveness. This is a five stage process. The stages in this process are Human Resource, Hrm, Human Capital.
-
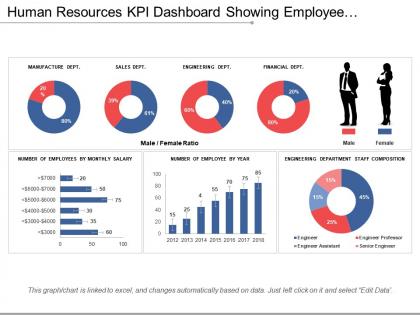 Human resources kpi dashboard showing employee number by salary staff composition
Presenting this set of slides with name - Human Resources Kpi Dashboard Showing Employee Number By Salary Staff Composition. This is a four stage process. The stages in this process are Human Resource, Hrm, Human Capital.
-
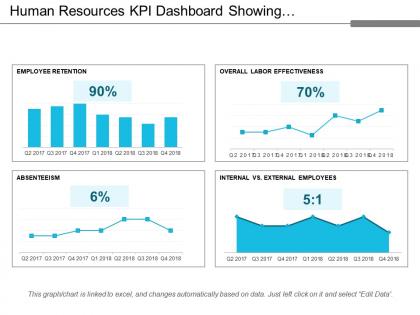 Human resources kpi dashboard showing employee retention absenteeism
Presenting this set of slides with name - Human Resources Kpi Dashboard Showing Employee Retention Absenteeism. This is a four stage process. The stages in this process are Human Resource, Hrm, Human Capital.
-
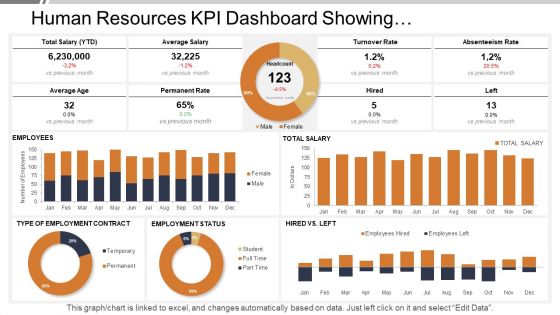 Human resources kpi dashboard showing employment status turnover rate
SlideTeam presents the Human Resources Kpi Dashboard Showing Employment Status Turnover Rate PPT which will help you keep a track of the human capital working under you. All the slides in the slideshow are 100 percent editable and you can make all the desired changes in the presentation. You can also add or delete the slides All the slides are fully compatible with Google slides as well. Your audience will be amazed by Google slides. You can even view the document in 16:9 widescreen size.
-
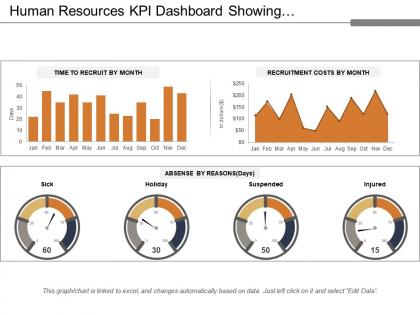 Human resources kpi dashboard showing recruitment costs and absence by reason
Presenting this set of slides with name - Human Resources Kpi Dashboard Showing Recruitment Costs And Absence By Reason. This is a three stage process. The stages in this process are Human Resource, Hrm, Human Capital.
-
 Human resources kpi dashboard showing recruitment funnel application sources
Presenting this set of slides with name - Human Resources Kpi Dashboard Showing Recruitment Funnel Application Sources. This is a six stage process. The stages in this process are Human Resource, Hrm, Human Capital.
-
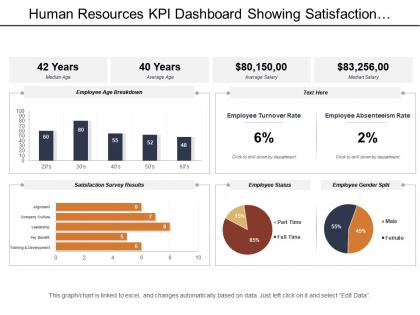 Human resources kpi dashboard showing satisfaction survey result age breakdown
Presenting human resources KPI dashboard showing satisfaction survey result age breakdown data driven PowerPoint slide. Fit to be used with the Google slides. Replace the visuals, text and the content in the slide design. Change the size, style and orientation of the slides. Use your company’s name or brand name to make it your own presentation template. Beneficial for managers, professors, marketers, etc. Flexible option for conversion in PDF or JPG formats. Available in Widescreen format also. Useful for making business plan and strategies.
-
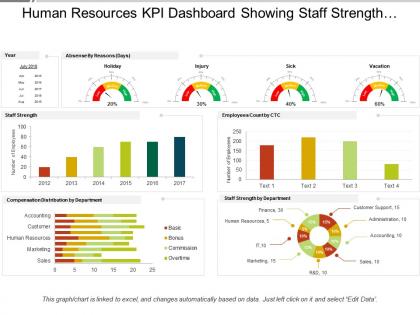 Human resources kpi dashboard showing staff strength compensation distribution
SlideTeam presenting Human Resources Kpi Dashboard Showing Staff Strength Compensation Distribution PPT. It will not only help you in knowing the exact strength of the staff but also about actual staff required in the organization. This slideshow is entirely editable and you can edit it whenever you want. All the slides in this presentation are compatible with Google slides. You can enter thousands of relatable icons of your own choice. You can also change from 4:3 standard screen size to 16:9 widescreen size.
-
 Kpi dashboard showing employee churn key metrics and open positions
Presenting this set of slides with name - Kpi Dashboard Showing Employee Churn Key Metrics And Open Positions. This is a four stage process. The stages in this process are Human Resource, Hrm, Human Capital.
-
 Kpi dashboard showing overtime cost gender diversity ratio
Presenting this set of slides with name - Kpi Dashboard Showing Overtime Cost Gender Diversity Ratio. This is a six stage process. The stages in this process are Human Resource, Hrm, Human Capital.
-
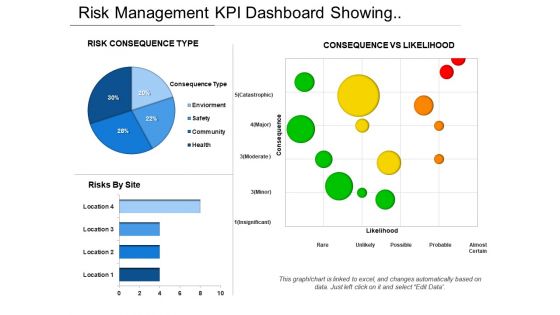 Risk Management Kpi Dashboard Showing Consequence Vs Likelihood
Presenting this set of slides with name - Risk Management Kpi Dashboard Showing Consequence Vs Likelihood. This is a three stage process. The stages in this process are Risk Management, Risk Assessment, Project Risk.
-
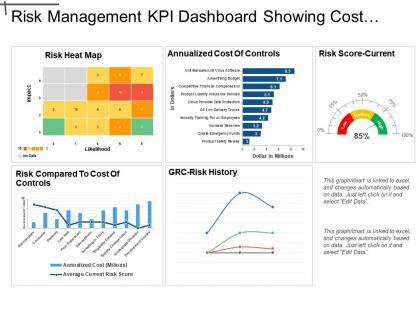 Risk Management Kpi Dashboard Showing Cost Of Control And Risk Score
Presenting this set of slides with name - Risk Management Kpi Dashboard Showing Cost Of Control And Risk Score. This is a five stage process. The stages in this process are Risk Management, Risk Assessment, Project Risk.


