Powerpoint Templates and Google slides for KPI
Save Your Time and attract your audience with our fully editable PPT Templates and Slides.
-
 Traditional Marketing Kpi Dashboard With Total Visitors Startup Marketing Strategies To Increase Strategy SS V
The following slide showcases the impact of offline marketing strategies on store performance. The key performance indicators KPIs mentioned in slide are sales, customers, average transaction price, average units per customer, top collections, sales by different segments, etc. Present the topic in a bit more detail with this Traditional Marketing Kpi Dashboard With Total Visitors Startup Marketing Strategies To Increase Strategy SS V. Use it as a tool for discussion and navigation on Customer And Visitors, Collections By Revenue. This template is free to edit as deemed fit for your organization. Therefore download it now.
-
 Viral Campaigns Kpi Dashboard With Engagement Implementing Strategies To Make Videos
This slide showcases KPI dashboard which can help marketers in assessing engagement metrics. It provides details about user metrics, direct signups, seed contacts, community members, social KPIs, engagement rate, etc. Present the topic in a bit more detail with this Viral Campaigns Kpi Dashboard With Engagement Implementing Strategies To Make Videos. Use it as a tool for discussion and navigation on Campaign Metrics, Seed Contacts. This template is free to edit as deemed fit for your organization. Therefore download it now.
-
 KPI Dashboard Highlighting Result Of Digital Marketing Strategies To Increase MKT SS V
The following slide showcases a comprehensive key performance indicator KPI dashboard which can be used to showcase the outcome of marketing campaign. The major metrics covered in the slide are brand mentions, customer lifetime value CLV, customer acquisition cost CAC, net promoter score NPS, etc.Deliver an outstanding presentation on the topic using this KPI Dashboard Highlighting Result Of Digital Marketing Strategies To Increase MKT SS V. Dispense information and present a thorough explanation of Demographic Breakdown, Campaigns Current, Customer Value using the slides given. This template can be altered and personalized to fit your needs. It is also available for immediate download. So grab it now.
-
 KPI Dashboard For Software Product Marketing Plan With Various Tools
Following slide depicts the KPI dashboard with numerous tools for software product marketing plan In order to locate prospects and close sales, agile lead generation and marketing techniques are needed. Deliver an outstanding presentation on the topic using this KPI Dashboard For Software Product Marketing Plan With Various Tools. Dispense information and present a thorough explanation of My Projects, Outstanding Invoices, Revenue This Month using the slides given. This template can be altered and personalized to fit your needs. It is also available for immediate download. So grab it now.
-
 Product Sales Performance Kpis Dashboard
This slide depicts the KPIs dashboard of product performance which assist manager to improve strategies and analyze return on investment, it include the metrics such as sales performance break down, product production break down and unique purchases. Introducing our Product Sales Performance Kpis Dashboard set of slides. The topics discussed in these slides are Percentage Change, Absolute Change This is an immediately available PowerPoint presentation that can be conveniently customized. Download it and convince your audience.
-
 Kpi Dashboard To Analyze Paid Marketing Boosting Campaign Reach Through Paid MKT SS V
This slide showcases the parameters that would help the business organization to evaluate paid media marketing performance. It includes metrics such as cost per acquisition CPA, monthly conversion by channel, ad impressions, daily paid social clicks, etc Present the topic in a bit more detail with this Kpi Dashboard To Analyze Paid Marketing Boosting Campaign Reach Through Paid MKT SS V Use it as a tool for discussion and navigation on Daily Paid Social, Monthly Conversions By Channel This template is free to edit as deemed fit for your organization. Therefore download it now.
-
 KPI Dashboard For Tracking Shareholder Value Maximization Complete Guide Of Holistic MKT SS V
This slide showcases the KPI dashboard that would help the business organization to track shareholder and companys valuation. It includes parameters such as total dividend growth rate, total capital return, share count. Present the topic in a bit more detail with this KPI Dashboard For Tracking Shareholder Value Maximization Complete Guide Of Holistic MKT SS V. Use it as a tool for discussion and navigation on Shareholder Valuation, Dashboard, Tracking Shareholder. This template is free to edit as deemed fit for your organization. Therefore download it now.
-
 Kpi Dashboard For Monitoring Cultivating Supply Chain Agility To Succeed Environment Strategy SS V
This slide showcases the ideal flow diagram of end-to-end supply chain process following digital transformation. Stages covered are e-sourcing, digital factory design, real-time scheduling, digital manufacturing procedures etc. Deliver an outstanding presentation on the topic using this Kpi Dashboard For Monitoring Cultivating Supply Chain Agility To Succeed Environment Strategy SS V. Dispense information and present a thorough explanation of Process, Manufacturing, Management using the slides given. This template can be altered and personalized to fit your needs. It is also available for immediate download. So grab it now.
-
 Kpi Dashboard For Supply Chain Cultivating Supply Chain Agility To Succeed Environment Strategy SS V
Mentioned slide illustrates warehouse operations dashboard with key performance indicators KPIs. KPIs included are operating cost, order rate, total shipment by country and on-time shipment. Present the topic in a bit more detail with this Kpi Dashboard For Supply Chain Cultivating Supply Chain Agility To Succeed Environment Strategy SS V. Use it as a tool for discussion and navigation on Dashboard, Operations, Monitoring. This template is free to edit as deemed fit for your organization. Therefore download it now.
-
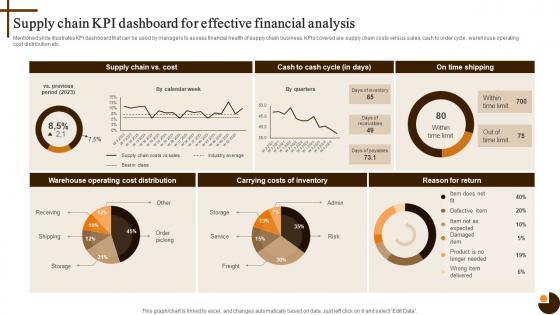 Supply Chain Kpi Dashboard For Effective Cultivating Supply Chain Agility To Succeed Environment Strategy SS V
Mentioned slide illustrates KPI dashboard that can be used by managers to assess financial health of supply chain business. KPIs covered are supply chain costs versus sales, cash to order cycle, warehouse operating cost distribution etc. Deliver an outstanding presentation on the topic using this Supply Chain Kpi Dashboard For Effective Cultivating Supply Chain Agility To Succeed Environment Strategy SS V. Dispense information and present a thorough explanation of Dashboard, Financial, Analysis using the slides given. This template can be altered and personalized to fit your needs. It is also available for immediate download. So grab it now.
-
 Sports Event Marketing Kpi Dashboard Comprehensive Guide On Sports Strategy SS
This slide represents KPI dashboard to measure and monitor the performance of sports event marketing. It includes details related to KPIs such as revenue, attendance etc. in last 5 games. Present the topic in a bit more detail with this Sports Event Marketing Kpi Dashboard Comprehensive Guide On Sports Strategy SS Use it as a tool for discussion and navigation on Attendance, Merchandise This template is free to edit as deemed fit for your organization. Therefore download it now.
-
 KPI Dashboard To Track Offline Marketing Offline Marketing Guide To Increase Strategy SS
This slide shows dashboard which can be used by organizations to measure performance of traditional marketing. It includes metrics such as customer conversion rate, new customers, sales, and brand awareness. Present the topic in a bit more detail with this KPI Dashboard To Track Offline Marketing Offline Marketing Guide To Increase Strategy SS Use it as a tool for discussion and navigation on Product Ads, Service Ads, Corporate Ads This template is free to edit as deemed fit for your organization. Therefore download it now.
-
 KPI Dashboard For Measuring Digital Marketing Program For Customer Retention Management
This slide represents ecommerce dashboard showcasing marketing performance. It includes sales breakdown, net revenue through channels, sales forecast, sales funnel etc. Deliver an outstanding presentation on the topic using this KPI Dashboard For Measuring Digital Marketing Program For Customer Retention Management. Dispense information and present a thorough explanation of KPI Dashboard, Digital Marketing Program, Customer Retention Management using the slides given. This template can be altered and personalized to fit your needs. It is also available for immediate download. So grab it now.
-
 ICT Business Security KPI Dashboard ICT Strategic Framework Strategy SS V
This slide represents ICT Information and Communication Technology business security dashboard to track threats and incidents. It covers details regarding issues by control type, risk categories, etc. Present the topic in a bit more detail with this ICT Business Security KPI Dashboard ICT Strategic Framework Strategy SS V. Use it as a tool for discussion and navigation on Standard Control Issues, Control Issues By Regulation, Risk Categories. This template is free to edit as deemed fit for your organization. Therefore download it now.
-
 Effective Marketing Strategies KPI Dashboard To Measure Online Website Performance
Following slide exhibits dashboard to track and measure performance of online shopping website of company. It include indicators such as sales, gross profit, conversion rates, site traffic, number of shares and transactions etc. Present the topic in a bit more detail with this Effective Marketing Strategies KPI Dashboard To Measure Online Website Performance. Use it as a tool for discussion and navigation on KPI Dashboard, Online Website Performance, Conversion Rate. This template is free to edit as deemed fit for your organization. Therefore download it now.
-
 Employee Training Status KPI Dashboard With Budget
This slide consists of a dashboard to track employee annual training status in order to update the plan for next year. It includes elements such as training number, total hours, budget, trainee numbers, training types, etc. Presenting our well structured Employee Training Status KPI Dashboard With Budget. The topics discussed in this slide are Training Status, Budget, Employee Training. This is an instantly available PowerPoint presentation that can be edited conveniently. Download it right away and captivate your audience.
-
 KPI Dashboard To Assess Training Key Initiatives To Enhance Staff Productivity
This slide covers KPI dashboard to assess training program effectiveness. It involves details such as overall responses on monthly basis, employee satisfaction rate, net promoter score and major training courses. Present the topic in a bit more detail with this KPI Dashboard To Assess Training Key Initiatives To Enhance Staff Productivity. Use it as a tool for discussion and navigation on Major Training Course, Employee Satisfaction, Promoter Score. This template is free to edit as deemed fit for your organization. Therefore download it now.
-
 KPI Dashboard To Track Employee Key Initiatives To Enhance Staff Productivity
This slide covers KPI dashboard to track employee performance at workplace. It involves details such as productivity rate, labour effectiveness rate, absentee rate and turnover ratio.Deliver an outstanding presentation on the topic using this KPI Dashboard To Track Employee Key Initiatives To Enhance Staff Productivity. Dispense information and present a thorough explanation of Productivity Rate, Labor Effectiveness, Employees Gender using the slides given. This template can be altered and personalized to fit your needs. It is also available for immediate download. So grab it now.
-
 Developing Winning Brand Strategy KPI Dashboard To Evaluate Effectiveness Of Digital Advertisement
The following slide outlines the key performance indicator dashboard used by the marketing manager to find out the success rate of the advertising campaign. The major KPIs are total cost, clicks, impressions, conversions, AD impressions etc. Present the topic in a bit more detail with this Developing Winning Brand Strategy KPI Dashboard To Evaluate Effectiveness Of Digital Advertisement. Use it as a tool for discussion and navigation on KPI Dashboard, Digital Advertisement Campaign, Indicator Dashboard. This template is free to edit as deemed fit for your organization. Therefore download it now.
-
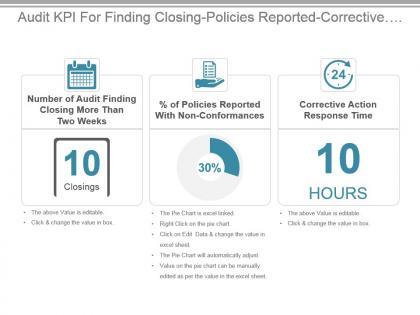 Audit kpi for finding closing policies reported corrective action time ppt slide
Presenting audit kpi for finding closing policies reported corrective action time ppt slide. This presentation slide shows three Key Performance Indicators or KPIs in a Dashboard style design. The first KPI that can be shown is Number of Audit Finding Closing More Than Two Weeks. The second KPI is percentage of Policies Reported With Non Conformances and the third is Corrective Action Response Time. These KPI Powerpoint graphics are all data driven,and the shape automatically adjusts according to your data. Just right click on the KPI graphic,enter the right value and the shape will adjust automatically. Make a visual impact with our KPI slides.
-
 Governance kpi for percentage of strategic objectives achieved powerpoint slide
Presenting governance kpi for percentage of strategic objectives achieved powerpoint slide. This presentation slide shows one Key Performance Indicators or KPIs in a Dashboard style design. The first KPI that can be shown is Percentage of Strategic Objectives Achieved. These KPI Powerpoint graphics are all data driven,and the shape automatically adjusts according to your data. Just right click on the KPI graphic,enter the right value and the shape will adjust automatically. Make a visual impact with our KPI slides.
-
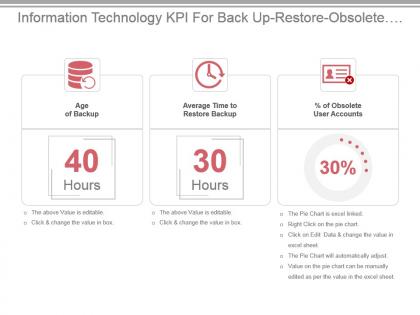 Information technology kpi for back up restore obsolete user accounts presentation slide
Presenting information technology kpi for back up restore obsolete user accounts presentation slide. This presentation slide shows three Key Performance Indicators or KPIs in a Dashboard style design. The first KPI that can be shown is Age of Backup. The second KPI is Average Time to Restore Backup and the third is percentage of Obsolete User Accounts. These KPI Powerpoint graphics are all data driven,and the shape automatically adjusts according to your data. Just right click on the KPI graphic,enter the right value and the shape will adjust automatically. Make a visual impact with our KPI slides.
-
 Kpi for agreed proposals correctly handled neglected compliance issues ppt slide
Presenting kpi for agreed proposals correctly handled neglected compliance issues ppt slide. This presentation slide shows three Key Performance Indicators or KPIs in a Dashboard style design. The first KPI that can be shown is Age of Agreed Upon Recommendations. The second KPI is percentage of Compliance Issues Handled First Time Correctly and the third is percentage of Neglected Compliance Issues. These KPI Powerpoint graphics are all data driven,and the shape automatically adjusts according to your data. Just right click on the KPI graphic,enter the right value and the shape will adjust automatically. Make a visual impact with our KPI slides.
-
 Kpi for average backup time security controls risks identified powerpoint slide
Presenting kpi for average backup time security controls risks identified powerpoint slide. This presentation slide shows three Key Performance Indicators or KPIs in a Dashboard style design. The first KPI that can be shown is Average Time Between Tests of Backup. The second KPI is Proportion of Information Security Risks for Which Satisfactory Controls Have Been Fully Implemented and the third is Relative Proportions of Risks Identified. These KPI Powerpoint graphics are all data driven,and the shape automatically adjusts according to your data. Just right click on the KPI graphic,enter the right value and the shape will adjust automatically. Make a visual impact with our KPI slides.
-
 Kpi for average time to patent claims carried prosecutions lawyer cost good ppt slide
Presenting kpi for average time to patent claims carried prosecutions lawyer cost good ppt slide. This presentation slide shows three Key Performance Indicators or KPIs in a Dashboard style design. The first KPI that can be shown is Average Time to Prepare Patent Claims. The second KPI is Number of Prosecutions Carried Out Per Fte and the third is Cost Per Hour Per Laywer in House. These KPI Powerpoint graphics are all data driven,and the shape automatically adjusts according to your data. Just right click on the KPI graphic,enter the right value and the shape will adjust automatically. Make a visual impact with our KPI slides.
-
 Kpi for change requests received qar entitlement removal requests presentation slide
Presenting kpi for change requests received qar entitlement removal requests presentation slide. This presentation slide shows two Key Performance Indicators or KPIs in a Dashboard style design. The first KPI that can be shown is of Change Requests Reviewed. The second KPI is QAR Entitlement Removal Requests. These KPI Powerpoint graphics are all data driven,and the shape automatically adjusts according to your data. Just right click on the KPI graphic,enter the right value and the shape will adjust automatically. Make a visual impact with our KPI slides.
-
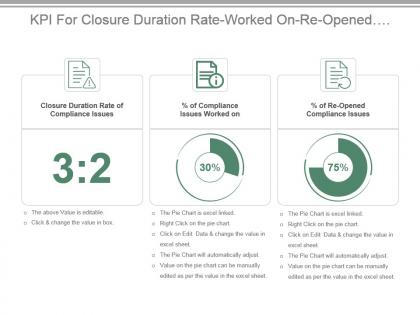 Kpi for closure duration rate worked on re opened compliance issues ppt slide
Presenting kpi for closure duration rate worked on re opened compliance issues ppt slide. This presentation slide shows three Key Performance Indicators or KPIs in a Dashboard style design. The first KPI that can be shown is Closure Duration Rate of Compliance Issues. The second KPI is percentage of Compliance Issues Worked on and the third is percentage of Re Opened Compliance Issues. These KPI Powerpoint graphics are all data driven,and the shape automatically adjusts according to your data. Just right click on the KPI graphic,enter the right value and the shape will adjust automatically. Make a visual impact with our KPI slides.
-
 Kpi for complaints reporting and action time lag secure third party connections powerpoint slide
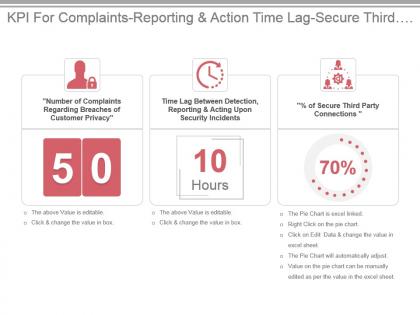
Presenting kpi for complaints reporting and action time lag secure third party connections powerpoint slide. This presentation slide shows three Key Performance Indicators or KPIs in a Dashboard style design. The first KPI that can be shown is Number of Complaints Regarding Breaches of Customer Privacy. The second KPI is Time Lag Between Detection Reporting and Acting Upon Security Incidents and the third is percentage of Secure Third Party Connections. These KPI Powerpoint graphics are all data driven,and the shape automatically adjusts according to your data. Just right click on the KPI graphic,enter the right value and the shape will adjust automatically. Make a visual impact with our KPI slides.
-
 Kpi for compliance loe reviewed accounts change request issues resolved presentation slide
Presenting kpi for compliance loe reviewed accounts change request issues resolved presentation slide. This presentation slide shows three Key Performance Indicators or KPIs in a Dashboard style design. The first KPI that can be shown is QAR IT Compliance LOE Quarterly. The second KPI is of Terminated Employee User Accounts Reviewed for Compliance and the third is of Non compliant Change Request Issues Resolved. These KPI Powerpoint graphics are all data driven,and the shape automatically adjusts according to your data. Just right click on the KPI graphic,enter the right value and the shape will adjust automatically. Make a visual impact with our KPI slides.
-
 Kpi for cost per lawsuit legal opinion response time won litigation cases ppt slide
Presenting kpi for cost per lawsuit legal opinion response time won litigation cases ppt slide. This presentation slide shows three Key Performance Indicators or KPIs in a Dashboard style design. The first KPI that can be shown is Average Cost Per Lawsuit. The second KPI is Average Legal Opinion Response Time and the third is percentage Litigation Cases Won. These KPI Powerpoint graphics are all data driven,and the shape automatically adjusts according to your data. Just right click on the KPI graphic,enter the right value and the shape will adjust automatically. Make a visual impact with our KPI slides.
-
 Kpi for cost per litigation case claim amounts paid debt recovery rate powerpoint slide
Presenting kpi for cost per litigation case claim amounts paid debt recovery rate powerpoint slide. This presentation slide shows three Key Performance Indicators or KPIs in a Dashboard style design. The first KPI that can be shown is Average Costs Incurred Per Litigation Case Dealt With. The second KPI is Average percentage of Claim Amounts Paid and the third is Debt Recovery Rate for Each Stage of Investigation. These KPI Powerpoint graphics are all data driven,and the shape automatically adjusts according to your data. Just right click on the KPI graphic,enter the right value and the shape will adjust automatically. Make a visual impact with our KPI slides.
-
 Kpi for escalated backlog staff trained compliance issues presentation slide
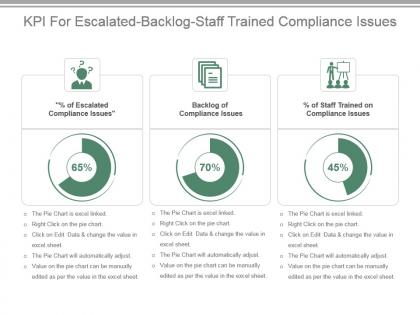
Presenting kpi for escalated backlog staff trained compliance issues presentation slide. This presentation slide shows three Key Performance Indicators or KPIs in a Dashboard style design. The first KPI that can be shown is percentage of Escalated Compliance Issues. The second KPI is Backlog of Compliance Issues and the third is percentage of Staff Trained on Compliance Issues. These KPI Powerpoint graphics are all data driven,and the shape automatically adjusts according to your data. Just right click on the KPI graphic,enter the right value and the shape will adjust automatically. Make a visual impact with our KPI slides.
-
 Kpi for flaws identified by external qualification and certification reports ppt slide
Presenting kpi for flaws identified by external qualification and certification reports ppt slide. This presentation slide shows one Key Performance Indicators or KPIs in a Dashboard style design. The first KPI that can be shown is Number of Weaknesses Identified by External Qualification and Certification Reports. These KPI Powerpoint graphics are all data driven,and the shape automatically adjusts according to your data. Just right click on the KPI graphic,enter the right value and the shape will adjust automatically. Make a visual impact with our KPI slides.
-
 Kpi for legal staff per size per billion of revenue powerpoint slide
Presenting kpi for legal staff per size per billion of revenue powerpoint slide. This presentation slide shows two Key Performance Indicators or KPIs in a Dashboard style design. The first KPI that can be shown is Legal Staff Per Size of Revenue. The second KPI is Legal Staff Per Billion of Revenue. These KPI Powerpoint graphics are all data driven,and the shape automatically adjusts according to your data. Just right click on the KPI graphic,enter the right value and the shape will adjust automatically. Make a visual impact with our KPI slides.
-
 Kpi for number of major control breaches percentage of key controls ppt slide
Presenting kpi for number of major control breaches percentage of key controls ppt slide. This presentation slide shows two Key Performance Indicators or KPIs in a Dashboard style design. The first KPI that can be shown is Number of Major Internal Control Breaches. The second KPI is percentage of Key Controls. These KPI Powerpoint graphics are all data driven,and the shape automatically adjusts according to your data. Just right click on the KPI graphic,enter the right value and the shape will adjust automatically. Make a visual impact with our KPI slides.
-
 Kpi for overdue average open days handling cost compliance issues presentation slide
Presenting kpi for overdue average open days handling cost compliance issues presentation slide. This presentation slide shows three Key Performance Indicators or KPIs in a Dashboard style design. The first KPI that can be shown is percentage of Overdue Compliance Issues. The second KPI is Average Number of Days Open of Compliance Issues and the third is Average Handling Cost Per Compliance Issue. These KPI Powerpoint graphics are all data driven,and the shape automatically adjusts according to your data. Just right click on the KPI graphic,enter the right value and the shape will adjust automatically. Make a visual impact with our KPI slides.
-
 Kpi for percentage of protected systems back up operations ppt slide
Presenting kpi for percentage of protected systems back up operations ppt slide. This presentation slide shows three Key Performance Indicators or KPIs in a Dashboard style design. The first KPI that can be shown is percentage of Systems Covered by Antivirus Antispyware Software. The second KPI is percentage of Systems With Latest Antivirus Antispyware Signatures and the third is percentage of Backup Operations That are Successful. These KPI Powerpoint graphics are all data driven,and the shape automatically adjusts according to your data. Just right click on the KPI graphic,enter the right value and the shape will adjust automatically. Make a visual impact with our KPI slides.
-
 Kpi for physical successful back up average time to restore backup powerpoint slide
Presenting kpi for physical successful back up average time to restore backup powerpoint slide. This presentation slide shows three Key Performance Indicators or KPIs in a Dashboard style design. The first KPI that can be shown is percentage of Physical Backup Archive Media That are Fully Encrypted. The second KPI is percentage of Test Backup Restores That are Successful and the third is Average Time to Restore off Site Backup. These KPI Powerpoint graphics are all data driven,and the shape automatically adjusts according to your data. Just right click on the KPI graphic,enter the right value and the shape will adjust automatically. Make a visual impact with our KPI slides.
-
 Kpi for postponed iso 9001 audit minor finding corrective actions presentation slide
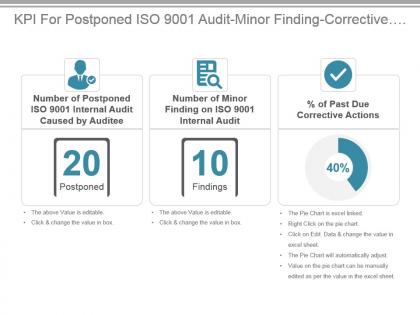
Presenting kpi for postponed iso 9001 audit minor finding corrective actions presentation slide. This presentation slide shows three Key Performance Indicators or KPIs in a Dashboard style design. The first KPI that can be shown is Number of Postponed ISO 9001 Internal Audit Caused by Auditee. The second KPI is Number of Minor Finding on ISO 9001 Internal Audit and the third is percentage of Past Due Corrective Actions. These KPI Powerpoint graphics are all data driven,and the shape automatically adjusts according to your data. Just right click on the KPI graphic,enter the right value and the shape will adjust automatically. Make a visual impact with our KPI slides.
-
 Kpi for process total coverage postponed iso 9001 internal audit ppt slide
Presenting kpi for process total coverage postponed iso 9001 internal audit ppt slide. This presentation slide shows three Key Performance Indicators or KPIs in a Dashboard style design. The first KPI that can be shown is Effectiveness of Process Audits. The second KPI is percentage Coverage of Total Audit Universe and the third is Number of Postponed ISO 9001 Internal Audit Caused by Auditor. These KPI Powerpoint graphics are all data driven,and the shape automatically adjusts according to your data. Just right click on the KPI graphic,enter the right value and the shape will adjust automatically. Make a visual impact with our KPI slides.
-
 Kpi for ratio attorneys other staff excluding including paralegals presentation slide
Presenting kpi for ratio attorneys other staff excluding including paralegals presentation slide. This presentation slide shows three Key Performance Indicators or KPIs in a Dashboard style design. The first KPI that can be shown is Ratio Attorneys to Paralegals. The second KPI is Ratio Attorneys and Other Legal Staff Excluding Paralegals and the third is Ratio Attorneys and all Other Legal Staff Including Paralegals. These KPI Powerpoint graphics are all data driven,and the shape automatically adjusts according to your data. Just right click on the KPI graphic,enter the right value and the shape will adjust automatically. Make a visual impact with our KPI slides.
-
 Kpi for regulatory compliance time regulation and initiation time user active accounts ppt slide
Presenting kpi for regulatory compliance time regulation and initiation time user active accounts ppt slide. This presentation slide shows three Key Performance Indicators or KPIs in a Dashboard style design. The first KPI that can be shown is Regulatory Compliance on Time. The second KPI is Average Time Lag Between New Regulation and Initiation of Review and the third is percentage of Terminated Employee AD User Accounts Active. These KPI Powerpoint graphics are all data driven,and the shape automatically adjusts according to your data. Just right click on the KPI graphic,enter the right value and the shape will adjust automatically. Make a visual impact with our KPI slides.
-
 Kpi for regulatory events change requests change compliance cycle powerpoint slide
Presenting kpi for regulatory events change requests change compliance cycle powerpoint slide. This presentation slide shows three Key Performance Indicators or KPIs in a Dashboard style design. The first KPI that can be shown is Number of Regulatory or Legal Non Compliance Events. The second KPI is of Non Compliant Change Requests and the third is Regulatory Change Compliance Cycle. These KPI Powerpoint graphics are all data driven,and the shape automatically adjusts according to your data. Just right click on the KPI graphic,enter the right value and the shape will adjust automatically. Make a visual impact with our KPI slides.
-
 Kpi for revenue spent budget spent legal dispute cycle time presentation slide
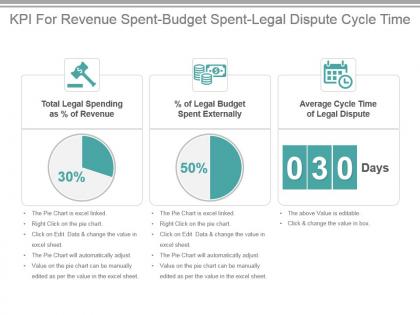
Presenting kpi for revenue spent budget spent legal dispute cycle time presentation slide. This presentation slide shows three Key Performance Indicators or KPIs in a Dashboard style design. The first KPI that can be shown is Total Legal Spending as percentage of Revenue. The second KPI is percentage of Legal Budget Spent Externally and the third is Average Cycle Time of Legal Dispute. These KPI Powerpoint graphics are all data driven,and the shape automatically adjusts according to your data. Just right click on the KPI graphic,enter the right value and the shape will adjust automatically. Make a visual impact with our KPI slides.
-
 Kpi for security risks total revenue policy deployment and adoption ppt slide
Presenting kpi for security risks total revenue policy deployment and adoption ppt slide. This presentation slide shows three Key Performance Indicators or KPIs in a Dashboard style design. The first KPI that can be shown is Number of Information Security Related Risks. The second KPI is Information Security Costs as a Proportion of Total Revenue or it Budget and the third is Information Security Policy Deployment and Adoption. These KPI Powerpoint graphics are all data driven,and the shape automatically adjusts according to your data. Just right click on the KPI graphic,enter the right value and the shape will adjust automatically. Make a visual impact with our KPI slides.
-
 Kpi for time between deficiency occurrence and reporting improvement steps powerpoint slide
Presenting kpi for time between deficiency occurrence and reporting improvement steps powerpoint slide. This presentation slide shows two Key Performance Indicators or KPIs in a Dashboard style design. The first KPI that can be shown is Time Between Internal Control Deficiency Occurrence and Reporting. The second KPI is Number of Internal Control Improvement Initiatives. These KPI Powerpoint graphics are all data driven,and the shape automatically adjusts according to your data. Just right click on the KPI graphic,enter the right value and the shape will adjust automatically. Make a visual impact with our KPI slides.
-
 Kpi for unauthorized disclosures qar completion time production access presentation slide
Presenting kpi for unauthorized disclosures qar completion time production access presentation slide. This presentation slide shows three Key Performance Indicators or KPIs in a Dashboard style design. The first KPI that can be shown is percentage of HIPAA Unauthorized Disclosures. The second KPI is QAR Completion Time and the third is Developer Access to Production. These KPI Powerpoint graphics are all data driven,and the shape automatically adjusts according to your data. Just right click on the KPI graphic,enter the right value and the shape will adjust automatically. Make a visual impact with our KPI slides.
-
 On time frequency government regulatory compliance kpi ppt slide
Presenting on time frequency government regulatory compliance kpi ppt slide. This presentation slide shows three Key Performance Indicators or KPIs in a Dashboard style design. The first KPI that can be shown is Regulatory Compliance on Time. The second KPI is Frequency of Compliance Reviews and the third is Government Regulatory Compliance,Corporate. These KPI Powerpoint graphics are all data driven,and the shape automatically adjusts according to your data. Just right click on the KPI graphic,enter the right value and the shape will adjust automatically. Make a visual impact with our KPI slides.
-
 Percentage kpi for emission quality waste discharge compliance powerpoint slide
Presenting percentage kpi for emission quality waste discharge compliance powerpoint slide. This presentation slide shows three Key Performance Indicators or KPIs in a Dashboard style design. The first KPI that can be shown is percentage of Air Emission Compliance. The second KPI is percentage of Air Quality Compliance and the third is percentage of Waste Discharge Compliance. These KPI Powerpoint graphics are all data driven,and the shape automatically adjusts according to your data. Just right click on the KPI graphic,enter the right value and the shape will adjust automatically. Make a visual impact with our KPI slides.
-
 Average cost of automated measured reported improved kpis ppt slide
Presenting average cost of automated measured reported improved kpis ppt slide. This presentation slide shows three Key Performance Indicators or KPIs in a Dashboard style design. The first KPI that can be shown is Average Cost of Automated Measurement Per KPI. The second KPI is percentage of KPIs Reported According to Approved Plan and the third is percentage of KPIs That are Improved. These KPI Powerpoint graphics are all data driven, and the shape automatically adjusts according to your data. Just right click on the KPI graphic, enter the right value and the shape will adjust automatically. Make a visual impact with our KPI slides.
-
 Kpi for achieved goals improvement strategic budget cuts vs across the board cuts powerpoint slide
Presenting kpi for achieved goals improvement strategic budget cuts vs across the board cuts powerpoint slide. This presentation slide shows three Key Performance Indicators or KPIs in a Dashboard style design. The first KPI that can be shown is percentage of Goals Accomplished From Most Recent Strategic Plan. The second KPI is percentage of Improvement Per Critical Strategic Indicators According to Recent Strategic Plan and the third is percentage of Strategic Budget Cuts VS percentage Budget Cuts Through Across the Board Cuts. These KPI Powerpoint graphics are all data driven, and the shape automatically adjusts according to your data. Just right click on the KPI graphic, enter the right value and the shape will adjust automatically. Make a visual impact with our KPI slides.
-
 Kpi for benchmarking manual automated measurement cost presentation slide
Presenting kpi for benchmarking manual automated measurement cost presentation slide. This presentation slide shows three Key Performance Indicators or KPIs in a Dashboard style design. The first KPI that can be shown is Cost of KPI Benchmarking. The second KPI is Cost of Manual KPI Measurement and the third is Cost of Automated Measurement of KPIs. These KPI Powerpoint graphics are all data driven, and the shape automatically adjusts according to your data. Just right click on the KPI graphic, enter the right value and the shape will adjust automatically. Make a visual impact with our KPI slides.
-
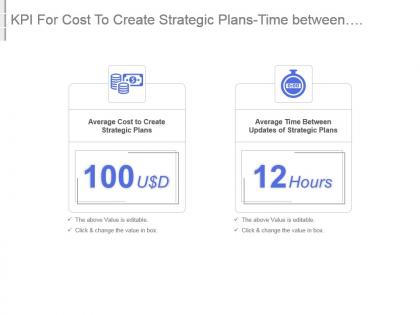 Kpi for cost to create strategic plans time between strategic plans updates ppt slide
Presenting kpi for cost to create strategic plans time between strategic plans updates ppt slide. This presentation slide shows two Key Performance Indicators or KPIs in a Dashboard style design. The first KPI that can be shown is Average Cost to Create Strategic Plans. The second KPI is Average Time Between Updates of Strategic Plans. These KPI Powerpoint graphics are all data driven, and the shape automatically adjusts according to your data. Just right click on the KPI graphic, enter the right value and the shape will adjust automatically. Make a visual impact with our KPI slides.
-
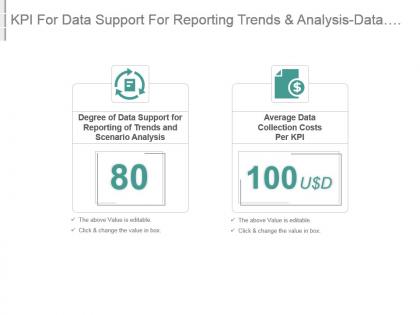 Kpi for data support for reporting trends and analysis data collection costs powerpoint slide
Presenting kpi for data support for reporting trends and analysis data collection costs powerpoint slide. This presentation slide shows two Key Performance Indicators or KPIs in a Dashboard style design. The first KPI that can be shown is Degree of Data Support for Reporting of Trends and Scenario Analysis. The second KPI is Average Data Collection Costs Per KPI. These KPI Powerpoint graphics are all data driven, and the shape automatically adjusts according to your data. Just right click on the KPI graphic, enter the right value and the shape will adjust automatically. Make a visual impact with our KPI slides.
-
 Kpi for directors liability insurance female executive directors presentation slide
Presenting kpi for directors liability insurance female executive directors presentation slide. This presentation slide shows three Key Performance Indicators or KPIs in a Dashboard style design. The first KPI that can be shown is percentage of Directors That Have Liability Insurance. The second KPI is percentage of Female Directors and the third is percentage of Female Executive Directors. These KPI Powerpoint graphics are all data driven, and the shape automatically adjusts according to your data. Just right click on the KPI graphic, enter the right value and the shape will adjust automatically. Make a visual impact with our KPI slides.
-
 Kpi for directors serving on board vacant seats on board of directors ppt slide
Presenting kpi for directors serving on board vacant seats on board of directors ppt slide. This presentation slide shows two Key Performance Indicators or KPIs in a Dashboard style design. The first KPI that can be shown is Number of Directors Serving on Board. The second KPI is Number of Vacant Seats on Board of Directors. These KPI Powerpoint graphics are all data driven, and the shape automatically adjusts according to your data. Just right click on the KPI graphic, enter the right value and the shape will adjust automatically. Make a visual impact with our KPI slides.
-
 Kpi for directors share average tenure executives corporate reputation powerpoint slide
Presenting kpi for directors share average tenure executives corporate reputation powerpoint slide. This presentation slide shows three Key Performance Indicators or KPIs in a Dashboard style design. The first KPI that can be shown is percentage of Directors That Own Shares in the Company. The second KPI is Average Director Tenure and the third is Corporate Reputation of Executives. These KPI Powerpoint graphics are all data driven, and the shape automatically adjusts according to your data. Just right click on the KPI graphic, enter the right value and the shape will adjust automatically. Make a visual impact with our KPI slides.
-
 Kpi for executive directors remuneration cost per director board of directors presentation slide
Presenting kpi for executive directors remuneration cost per director board of directors presentation slide. This presentation slide shows three Key Performance Indicators or KPIs in a Dashboard style design. The first KPI that can be shown is percentage of Executive Directors. The second KPI is Total Renumeration Costs of Board of Directors and the third is Renumeration Costs Per Director on Board of Directors. These KPI Powerpoint graphics are all data driven, and the shape automatically adjusts according to your data. Just right click on the KPI graphic, enter the right value and the shape will adjust automatically. Make a visual impact with our KPI slides.
-
 Kpi for male and female director remuneration last change on board of directors ppt slide
Presenting kpi for male and female director remuneration last change on board of directors ppt slide. This presentation slide shows two Key Performance Indicators or KPIs in a Dashboard style design. The first KPI that can be shown is Ratio Between Renumeration Cost of Female And Male Directors. The second KPI is Time Past After Last Change on Board of Directors. These KPI Powerpoint graphics are all data driven, and the shape automatically adjusts according to your data. Just right click on the KPI graphic, enter the right value and the shape will adjust automatically. Make a visual impact with our KPI slides.
-
 Kpi for new board members independent directors company board seats powerpoint slide
Presenting kpi for new board members independent directors company board seats powerpoint slide. This presentation slide shows three Key Performance Indicators or KPIs in a Dashboard style design. The first KPI that can be shown is Level of Industry Expertise of New Board Members. The second KPI is percentage of Independent Directors and the third is Average Number of Other Public Company Board Seats. These KPI Powerpoint graphics are all data driven, and the shape automatically adjusts according to your data. Just right click on the KPI graphic, enter the right value and the shape will adjust automatically. Make a visual impact with our KPI slides.


