Powerpoint Templates and Google slides for Graphs
Save Your Time and attract your audience with our fully editable PPT Templates and Slides.
-
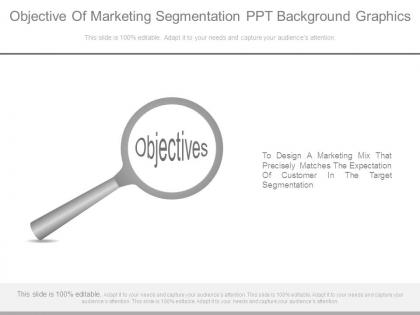 Objective of marketing segmentation ppt background graphics
Presenting objective of marketing segmentation ppt background graphics. This is a objective of marketing segmentation ppt background graphics. This is a one stage process. The stages in this process are objectives, to design a marketing mix that precisely matches the expectation of customer in the target segmentation.
-
 Marketing attribution pie chart powerpoint graphics
Presenting marketing attribution pie chart powerpoint graphics. This is a marketing attribution pie chart powerpoint graphics. This is a seven stage process. The stages in this process are retargeting, social, good pr, search, email marketing, direct mail marketing, online advertising.
-
 Company valuation diagram powerpoint slide graphics
Presenting company valuation diagram powerpoint slide graphics. This is a company valuation diagram powerpoint slide graphics. This is a four stage process. The stages in this process are risk factors, competition, valuation , public comparable.
-
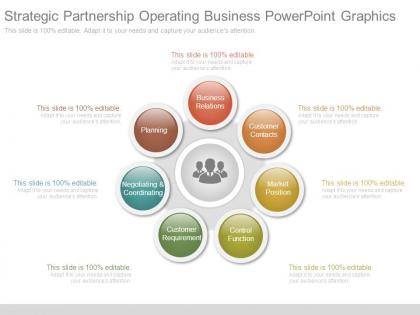 Strategic partnership operating business powerpoint graphics
Presenting strategic partnership operating business powerpoint graphics. This is a strategic partnership operating business powerpoint graphics. This is a seven stage process. The stages in this process are business relations, customer contacts, market position, control function, customer requirement, negotiating and coordinating, planning.
-
 Objectives of market research presentation graphics
Presenting objectives of market research presentation graphics. This is a objectives of market research presentation graphics. This is a four stage process. The stage in this process are aim, assess, apply, active, objectives of market research.
-
 Example of best corporate leadership development ppt background graphics
Presenting example of best corporate leadership development ppt background graphics. This is a example of best corporate leadership development ppt background graphics. This is a eight stage process. The stages in this process are leadership, motivation, teamwork, goal, challenges, strategy, vision, management.
-
 Graphic example of organizational success ppt design templates
Presenting graphic example of organizational success ppt design templates. This is a graphic example of organizational success ppt design templates. This is a three stage process. The stages in this process are satisfied employees, better services, satisfied customers.
-
 Strategy to transform business powerpoint graphics
Presenting strategy to transform business powerpoint graphics. This is a strategy to transform business powerpoint graphics. This is a three stage process. The stages in this process are strategy defined, people developed, processes streamlined, change delivered, excellent customer service, efficient service delivery, effective leadership and alignment.
-
 Marketing communication process powerpoint slide graphics
Presenting marketing communication process powerpoint slide graphics. This is a marketing communication process powerpoint slide graphics. This is a five stage process. The stages in this process are online internet based marketing, investor relations, acceptance, brand management, events and experience, communication.
-
 Methodical issue resolving model powerpoint slide graphics
Presenting methodical issue resolving model powerpoint slide graphics. This is a methodical issue resolving model powerpoint slide graphics. This is a four stage process. The stages in this process are scope and define the problem, data gathering and investigation, develop options, recommendation report.
-
 Operational crm graphics powerpoint slide images
Presenting operational crm graphics powerpoint slide images. This is a operational crm graphics powerpoint slide images. This is a five stage process. The stages in this process are data mining, data warehouse, sales systems, marketing systems, customer service systems, collaborative crm system, back office analytical crm, front office-operational crm.
-
 Policies for sustainable development template powerpoint slide graphics
Presenting policies for sustainable development template powerpoint slide graphics. This is a policies for sustainable development template powerpoint slide graphics. This is a four stage process. The stages in this process are economic vitality, operational efficiency, natural resources, social responsibility.
-
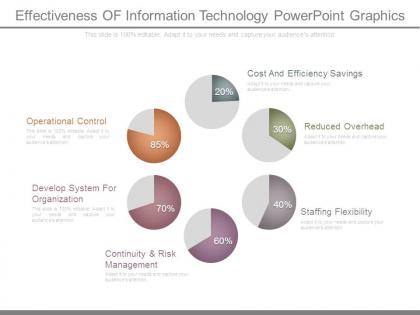 Effectiveness of information technology powerpoint graphics
Presenting effectiveness of information technology powerpoint graphics. This is a effectiveness of information technology powerpoint graphics. This is a six stage process. The stages in this process are operational control, cost and efficiency savings, reduced overhead, staffing flexibility, continuity and risk management, develop system for organization.
-
 Financial investments pie graph design powerpoint presentation examples
Presenting financial investments pie graph design powerpoint presentation examples. This is a financial investments pie graph design powerpoint presentation examples. This is a eight stage process. The stages in this process are bonds, art, collectibles, antiques, precious metal, mutual funds, real estate, stocks.
-
 Elements of business marketing communication ppt background graphics
Presenting elements of business marketing communication ppt background graphics. This is a elements of business marketing communication ppt background graphics. This is a six stage process. The stages in this process are advertising, personal selling, public relations, sales promotion, direct marketing, customer.
-
 Procedure of brainstorming ppt background graphics
Presenting procedure of brainstorming ppt background graphics. This is a procedure of brainstorming ppt background graphics. This is a four stage process. The stages in this process are personnel brainstorm, participants and training brainstorm, hardware and software brainstorm, documents and materials brainstorm.
-
 Website update plan presentation graphics
Presenting website update plan presentation graphics. This is a website update plan presentation graphics. This is a six stage process. The stages in this process are business, management, strategy, marketing, process.
-
 Situational leadership diagram powerpoint graphics
Presenting situational leadership diagram powerpoint graphics. This is a situational leadership diagram powerpoint graphics. This is a four stage process. The stages in this process are delegating, supporting, coaching, direction.
-
 Monitoring employees in the workplace powerpoint graphics
Presenting monitoring employees in the workplace powerpoint graphics. Presenting monitoring employees in the workplace powerpoint graphics. Presenting monitoring employees in the workplace powerpoint graphics. Presenting monitoring employees in the workplace powerpoint graphics. This is a monitoring employees in the workplace powerpoint graphics. This is a three stage process. The stages in this process are planning, monitoring, developing, rating, rewarding.
-
 Example of financial decision model presentation graphics
Presenting example of financial decision model presentation graphics. This is a example of financial decision model presentation graphics. This is a eight stage process. The stages in this process are costs, marketing mix, legal issues, competition, customer response, member expectations, marketing objectives, pricing objectives.
-
 Team building skills in management powerpoint slide graphics
Presenting team building skills in management powerpoint slide graphics. This is a team building skills in management powerpoint slide graphics. This is a three stage process. The stages in this process are instilling an inspiring vision, getting important things done, instilling good operational processes.
-
 Global advancement in technology presentation graphics
The PowerPoint presentation supports easy proofing and editing. Presentation slide is useful in marketing, computer programming, management and recourse disbursement. Basic theme yet it can modified with respect to font, color and layout. Attractive and professional color scheme. PPT graphic offers font size which can be read from a distance. Shapes are in vector format and can be edited.
-
 Mentoring for business performance targets powerpoint graphics
Presenting mentoring for business performance targets powerpoint graphics. This is a mentoring for business performance targets powerpoint graphics. This is a three stage process. The stages in this process are sustainable high performance, achievement result, vision and action, performance reporting, leveraging diversity, work life and wellbeing, engagement support, hpt, kpis, factors.
-
 Quality management system standards presentation graphics
Presenting quality management system standards presentation graphics. This is a quality management system standards presentation graphics. This is a five stage process. The stages in this process are investigations, root cause analysis, capa, change control, effectivity analysis, audit management, deviations and incidents, lab issues, complaint handling.
-
 Consulting diagram integrated marketing ppt background graphics
Presenting consulting diagram integrated marketing ppt background graphics. This is a consulting diagram integrated marketing ppt background graphics. This is a four stage process. The stages in this process are implementation, innovation, interaction, integration, profitable customer engagement, digital and social media marketing, brand management, business intelligence, database marketing.
-
 Fund flow analysis graphics ppt infographics
Presenting fund flow analysis graphics ppt infographics. This is a fund flow analysis graphics ppt infographics. This is a two stage process. The stages in this process are sources of funds, uses of funds, long term funds, long term uses, working capital.
-
 Change management iceberg powerpoint graphics
Presenting change management iceberg powerpoint graphics. This is a change management iceberg powerpoint graphics. This is a eight stage process. The stages in this process are react, respond, design, transform, events, trends patterns, structures behaviors, mental models worldview.
-
 Market research business plan chart powerpoint slide graphics
Presenting market research business plan chart powerpoint slide graphics. This is a market research business plan chart powerpoint slide graphics. This is a seven stage process. The stages in this process are weaknesses, marketing mix, reputation, market share, customer care, strengths, plans.
-
 Technical leadership ppt background graphics
Presenting technical leadership ppt background graphics. This is a technical leadership ppt background graphics. This is a four stage process. The stages in this process are weak business skill, weak market consciousness, financially secure, technical leadership.
-
 Currency trading options template presentation graphics
Presenting currency trading options template presentation graphics. This is a currency trading options template presentation graphics. This is a two stage process. The stages in this process are broker, bank, currency, forex, trading.
-
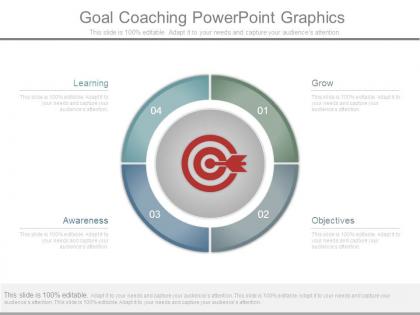 Goal coaching powerpoint graphics
Presenting goal coaching powerpoint graphics. This is a goal coaching powerpoint graphics. This is a four stage process. The stages in this process are grow, objectives, awareness, learning.
-
 Salient features of big data powerpoint slide graphics
Presenting salient features of big data powerpoint slide graphics. This is a salient features of big data powerpoint slide graphics. This is a six stage process. The stages in this process are data volumes, data sources, technologies, non traditional data types, business insight, economics.
-
 Pros cons powerpoint slide graphics
Presenting pros cons powerpoint slide graphics. This is a pros cons powerpoint slide graphics. This is a two stage process. The stages in this process are business, marketing, icons, compare, management.
-
 Market size template 1 powerpoint graphics
Presenting market size template 1 powerpoint graphics. This is a market size template 1 powerpoint graphics. This is a three stage process. The stages in this process are business, strategy, presentation, analysis.
-
 Organization profile area of focus powerpoint slide graphics
Presenting organization profile area of focus powerpoint slide graphics. This is a organization profile area of focus powerpoint slide graphics. This is five stage process. The stages in this process are process, management, strategy, marketing, business.
-
 Marketing technology ecosystem template presentation graphics
Presenting marketing technology ecosystem template presentation graphics. This is a marketing technology ecosystem template presentation graphics. This is a three stage process. The stages in this process are analytics, collection and integration, segmentation.
-
 Point of a business networking graphics ppt model
Presenting point of a business networking graphics ppt model. This is a point of a business networking graphics ppt model. This is a eight stage process. The stages in this process are Opportunities, Connections, Meet and Greet, Business Cards, Communities, Paid Positions, Work Space, Soft Skills.
-
 Process adaptability framework presentation graphics
Presenting process adaptability framework presentation graphics. This is a process adaptability framework presentation graphics. This is a five stage process. The stages in this process are analysis and design, architecture and design, requirement, development, test and feedback.
-
 Process of problem solving methodology diagram ppt graphics
Presenting process of problem solving methodology diagram ppt graphics. This is a process of problem solving methodology diagram ppt graphics. This is a seven stage process. The stages in this process are Evaluation, Design, Development, Analysis, Scope of Solution, Solution Constraints, Solution Requirements.
-
 Office management template powerpoint graphics
Presenting office management template powerpoint graphics. This is a office management template powerpoint graphics. This is a one stage process. The stages in this process are business, technology, strategy, internet, management, marketing.
-
 Styles of management ppt diagram powerpoint slide graphics
Presenting styles of management ppt diagram powerpoint slide graphics. This is a styles of management ppt diagram powerpoint slide graphics. This is a six stage process. The stages in this process are leadership, command, management, top manager, leading projects, performance management.
-
 Example of procurement and sourcing diagram presentation graphics
Presenting example of procurement and sourcing diagram presentation graphics. This is a example of procurement and sourcing diagram presentation graphics. This is a four stage process. The stages in this process are delivery, compliance, customs classification, price comparison.
-
 Internal risk management and mitigation presentation graphics
Presenting internal risk management and mitigation presentation graphics. This is a internal risk management and mitigation presentation graphics. This is a four stage process. The stages in this process are revenue collection, internal risk management and mitigation, general government, supply chain management.
-
 Operations management training program presentation graphics
Presenting operations management training program presentation graphics. This is a operations management training program presentation graphics. This is a four stage process. The stages in this process are turnaround coordination, customer inventory management system, process and technology improvement, operations management training program.
-
 Policy deployment process diagram ppt background graphics
Presenting policy deployment process diagram ppt background graphics. This is a policy deployment process diagram ppt background graphics. This is a five stage process. The stages in this process are deploy plan, design, create plan, contracts, procurement.
-
 Factors that affect investment outcome diagram powerpoint graphics
Presenting factors that affect investment outcome diagram powerpoint graphics. This is a factors that affect investment outcome diagram powerpoint graphics. This is a four stage process. The stages in this process are maximize tax efficiency, alternative strategies, sector rotation, your time horizon, your risk tolerance, your objective.
-
 Graphical representation of the pre buyout legal structure diagram
Presenting graphical representation of the pre buyout legal structure diagram. This is a graphical representation of the pre buyout legal structure diagram. This is a six stage process. The stages in this process are developer sponsor, project entity, bank, spv, investors, tax equity.
-
 Point of a business networking graphics powerpoint graphics
Presenting point of a business networking graphics powerpoint graphics. This is a point of a business networking graphics powerpoint graphics. This is a eight stage process. The stages in this process are internet, contacts, success, career, colleagues, soft skills, workspace, paid positions.
-
 Process of managerial motivation sample diagram presentation graphics
Presenting process of managerial motivation sample diagram presentation graphics. This is a process of managerial motivation sample diagram presentation graphics. This is a four stage process. The stages in this process are unfulfilled need, incentive, action, motivation.
-
 Educational institute merchandising plan template powerpoint graphics
Presenting educational institute merchandising plan template powerpoint graphics. This is a educational institute merchandising plan template powerpoint graphics. This is a seven stage process. The stages in this process are technology, measure, proprietary products, open solution, strategy, capability, industrial world.
-
 Example of business cases of big data ppt powerpoint graphics
Presenting example of business cases of big data ppt powerpoint graphics. This is a example of business cases of big data ppt powerpoint graphics. This is a five stage process. The stages in this process are data, infrastructure, consulting and strategy, services, applications.
-
 Overall sales resource diagram powerpoint graphics
Presenting overall sales resource diagram powerpoint graphics. This is a overall sales resource diagram powerpoint graphics. This is a six stage process. The stages in this process are sales operations, sales planning, growth, earning, advertisement, progress.
-
 Crm with email marketing example ppt background graphics
Presenting crm with email marketing example ppt background graphics. This is a crm with email marketing example ppt background graphics. This is a five stage process. The stages in this process are customer relationship management, enterprise resource planning, e commerce, business intelligence, content management system, email marketing.
-
 Enable individual management layout powerpoint slide graphics
Presenting enable individual management layout powerpoint slide graphics. This is a enable individual management layout powerpoint slide graphics. This is a seven stage process. The stages in this process are process, behavior, plan, implement, communicate, capability, incorporate.
-
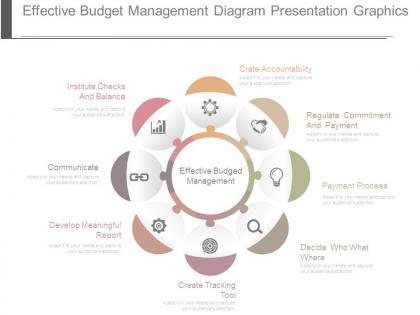 Effective budget management diagram presentation graphics
Presenting effective budget management diagram presentation graphics. This is a effective budget management diagram presentation graphics. This is a eight stage process. The stages in this process are crate accountability, regulate commitment and payment, payment process, decide who what where, create tracking tool, develop meaningful report communicate, institute checks and balance, effective budged management.
-
 Example of project control analysis diagram powerpoint graphics
Presenting example of project control analysis diagram powerpoint graphics. This is a example of project control analysis diagram powerpoint graphics. This is a six stage process. The stages in this process are estimating, budgeting, scheduling, reporting, forecast, planning, project control cycle.
-
 Seo oriented competitive analysis diagram ppt info graphics
Presenting seo oriented competitive analysis diagram ppt info graphics. This is a seo oriented competitive analysis diagram ppt info graphics. This is a seven stage process. The stages in this process are business, strength, content gap analysis, competitive comparison, opportunity, weakness, competitive dashboard.
-
 Ansoff matrix for growth strategy ppt background graphics
Presenting ansoff matrix for growth strategy ppt background graphics. This is a ansoff matrix for growth strategy ppt background graphics. This is a four stage process. The stages in this process are products, current, new, product development strategy, market penetration strategy, diversification strategy, market development strategy, growth strategy.
-
 Underlying magic powerpoint slide graphics
Presenting underlying magic powerpoint slide graphics. This is a underlying magic powerpoint slide graphics. This is a one stage process. The stages in this process are underlying magic, describe the technology, secret sauce or underlying magic behind your product or service, visualize show, do not tell.
-
 Innovation learning example powerpoint graphics
Presenting innovation learning example powerpoint graphics. This is a innovation learning example powerpoint graphics. This is a six stage process. The stages in this process are innovation, adoption, unique pedagogy, learning, quality, mission.


