Finance PowerPoint Templates, Presentation Slide Diagrams & PPT Graphics
- Sub Categories
-
- 30 60 90 Day Plan
- Advertising
- Agile Development
- Aims and Objectives
- Arrows
- Before and After
- Blockchain Bitcoin
- Boxes
- Business
- Calender
- Case Study
- Celebrations
- Certificates
- Challenges Opportunities
- Channel Distribution
- Children
- Communication
- Competitive Landscape
- Computer
- Concepts
- Construction Management
- Corporate
- Crowdfunding
- Current State Future State
- Custom PowerPoint Diagrams
- Digital Transformation
- Dos and Donts
- Economics
- Education
- Environment
- Events
- Festival
- Finance
- Financials
- Food
- Game
- Gap Analysis
- Generic
- Geographical
- Health
- Heatmaps
- Holidays
- Icons
- Input Process Output
- Internet
- Key Messages
- Key Wins
- Ladder
- Leadership
- Lists
- Lucky Draw
- Management
- Marketing
- Measuring
- Medical
- Music
- News
- Next Steps
- People Process Technology
- Pillars
- Planning
- Post-it-Notes
- Problem Statement
- Process
- Proposal Management
- Pros and Cons
- Puzzle
- Puzzles
- Recruitment Strategy
- Religion
- Research and Development
- Risk Mitigation Strategies
- Roadmap
- Selling
- Shapes
- Short Term Long Term
- Social
- Stairs
- Start Stop Continue
- Strategy
- Symbol
- Technology
- Thesis Defense Dissertation
- Timelines
- Traffic
- Transition Plan
- Transportation
- Vehicles
- Venture Capital Funding
- Warning
- Winners
- Word Cloud
-
 3d puzzle pieces put together for a unified image templates ppt presentation slides 812
The separate pieces are in linear order, editable and colourable. With designed end pieces you can declare a process as concluded.
-
 3d puzzle process adjoining shapes powerpoint templates ppt presentation slides 812
This diagram is an effective way of displaying information you can edit text, color, shade and style as per you need.
-
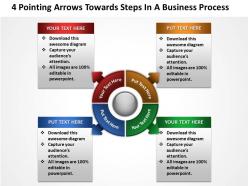
 4 pointing arrows towards steps in a business process templates ppt presentation slides 812
Use this layout to define the outcome and the multiple possibilities in a way that is used in calculation of probabilities, genetics and strategic reasoning.
-
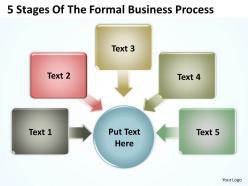
 5 stages of the formal business process powerpoint templates ppt presentation slides 812
Use these multicolored textboxes around a circle to explain a formal business process
-
 6 text boxes around one circle business process powerpoint templates ppt presentation slides 812
This Diagram makes information accessible throughout the organization with a collective, visible view of critical data from different perspectives and providing the tools to upcoming business scenarios and plan for change.
-
 7 adjoining circular business chart powerpoint templates ppt presentation slides 812
Analyze the seven success factors of your business with this circular business chart for Microsoft PowerPoint presentations
-
 8 major interconnected stage of the process circular chart templates ppt presentation slides 812
This diagram provides an overview of the interactions of different factors in a company.
-
 A systematic series of business actions chart powerpoint templates ppt presentation slides 812
It is an amazing graphic to explain the pros and cons of each Topic. You can easily use these diagrams to mention the facts and figures effectively
-
 Circular pentagons business cycle chart 5 stages powerpoint templates ppt presentation slides 812
Use this graphic to represent a continuing sequence of stages, tasks, or events in a circular flow and emphasize the connection between all components.
-
 Circular process of decision making powerpoint templates ppt presentation slides 812
This chart is an effective way of displaying information you can edit text, color, shade and style as per you need.
-
 Coloful interconnected circular business chart 6 stages templates ppt presentation slides 812
By using this diagram You can build confidence among audience by providing strong visual clues as to how things fit together and how very different projects contribute to the same outcome
-
 Colorful puzzle business process stages 3 powerpoint templates ppt presentation slides 812
This diagram shows an organized view of business services and processes.
-
 Diffrent puzzle shapes fit in process diagram powerpoint templates ppt presentation slides 812
An excellent graphics that help you convey your ideas successfully - no matter what they are
-
 Factors commonly used for business reports circular chart templates ppt presentation slides 812
Circular Chart can illustrate the flow of money in the economy
-
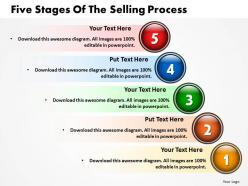
 Five stages of the selling process powerpoint templates ppt presentation slides 812
Highlight the key point in selling process with this diagram
-
 Four stages of negotiation process powerpoint templates ppt presentation slides 812
A model that best depicts how goods and services flow in exchange for money
-
 Global business concepts 6 stages powerpoint templates ppt presentation slides 812
Whether you manage people, projects or events this diagram will meet your all needs.
-
 Interconnected business factors circular chart powerpoint templates ppt presentation slides 812
This kind of charts can show the dependencies among parts of an organization or process.
-
 Interconnected circular process flow diagrams 2 stages templates ppt presentation slides 812
The circular-flow diagram is a visual model of the economy that shows how dollars flow through markets among households and firms
-
 International business deal 5 stages powerpoint templates ppt presentation slides 812
This diagram make your audience understand, essential elements of your overall strategy of business deal.
-
 International business goals 7 stages powerpoint templates ppt presentation slides 812
Business goals can be explained more effectively with this design
-
 Outer rings conected to the centre circle business process templates ppt presentation slides 812
Use this diagram to show the relationship to a central idea. Emphasizes on both information in the center circle and how information in the outer ring of circles contributes to the central idea
-
 Puzzle process adjacent angles powerpoint templates ppt presentation slides 812
This can be really helpful to make awesome PPT graphics and help to visualize data
-
 Sales puzzle process stages 2 powerpoint templates ppt presentation slides 812
Puzzle diagram is a visual tool that allows you to create and visualize a sales process.
-
 Steps to reach success with time powerpoint templates ppt presentation slides 812
Using this diagram can bring the power of clear, visual communication to your everyday work.
-
 Text circles flow around virtually business path powerpoint templates ppt presentation slides 812
This diagram can help you see whether the steps of a process are logical, define the boundaries of a process.
-
 The circular operation process chart powerpoint templates ppt presentation slides 812
This easy to use diagrams can be used for information flow, business process automation, business process re-engineering.
-
 Three factors linked to center diagram powerpoint templates ppt presentation slides 812
This diagram is an amazing tool to ensure that strategic planning sessions contribute to teambuilding.
-
 Three interconnected steps circular chart powerpoint templates ppt presentation slides 812
This Chart is a simple template that provides a graphical, time-phased overview of a continuing sequence of stages in a circular flow
-
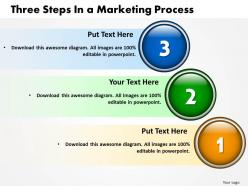
 Three steps in a marketing process powerpoint templates ppt presentation slides 812
This diagram is useful for project planning, time scheduling, cost control and budget management
-
 Whole course of the business proceedings powerpoint templates ppt presentation slides 812
This diagram can be used to interact visually and logically with your audiences.
-
 3d business circular process 2 stages powerpoint templates graphics slides 0712
Use these circle diagram to make your team understand complex processes.
-
 3d circular flow 4 stages powerpoint templates graphics slides 0712
This diagram can be used in analyzing, designing, managing a marketing process.
-
 3d circular market progress 8 stages powerpoint templates graphics slides 0712
Use to show a progression or a sequence of stages, tasks, or events in a circular flow. Emphasizes the interconnected pieces.
-
 3d colorful business concept 7 stages powerpoint templates graphics slides 0712
This circle diagram is a useful graphic which helps in divide information in 7 categories and create correlations.
-
 3d example of circular reasoning 3 stages powerpoint templates graphics slides 0712
This diagram make your audience understand, essential elements of your overall strategy
-
 3d process circle chart 5 stages powerpoint templates graphics slides 0712
circle diagram shows an organized view of business services and processes.
-
 3d round moving process 6 stages powerpoint templates graphics slides 0712
Use these graphics for most important events during the event identification and analysis stage.
-
 Balanced cycle process 6 stages powerpoint templates graphics slides 0712
You can find countless advantages in the convenient ready-to-use diagrams
-
 Business circular flow 5 stages powerpoint templates graphics slides 0712
A wonderful graphics to display time-phased overview of a continuing sequence of stages, tasks, or events in a circular flow
-
 Business conceptual process powerpoint templates graphics slides 0712
The business conceptual diagram is used to understand what the key areas of ... Business Roles perfom Business Processes
-
 Business development chart powerpoint templates graphics slides 0712
This diagram describes each business process from a conceptual perspective.
-
 Business process 8 stages powerpoint templates graphics slides 0712
Use this graphics to represent the design of the organisation, in terms of the roles that are required and how they are related.
-
 Business progress cycle 3 stages powerpoint templates graphics slides 0712
This diagram is used to understand the key areas for progress of business
-
 Circular 5 stages chart powerpoint templates graphics slides 0712
It can be use to understand of what the key areas of the business are and how they interact.
-
 Circular flowchart 4 stages powerpoint templates graphics slides 0712
• Visually stunning PowerPoint infographic. • Thoroughly editable text and colors of the graphics. • Ease of download. • Modification in the display screen aspect ratio does not deter the quality of the visuals. • Compatible with Google slides and multiple other software options. • Gels with multiple formats like PDF, JPEG or JPG, etc. • SO useful for business professionals who require to make marketing and other such presentations on regular basis. • Also used by students and teachers in education field.
-
 Consecutive factors 5 stages powerpoint templates graphics slides 0712
This chart is an effective way of displaying information you can edit text, color, shade and style as per you need.
-
 Constant process cycle 5 stages powerpoint templates graphics slides 0712
It is an excellent graphic to attract the attention of your audience.
-
 Five activity program powerpoint templates graphics slides 0712
Use this diagram to represent temporal or time dependent data in a meaningful and concise manner.
-
 Four circular mode chart powerpoint templates graphics slides 0712
Use this graphic to represent a continuing sequence of stages, tasks, or events in a circular flow and emphasize the connection between all components.
-
 Four process diagram powerpoint templates graphics slides 0712
Market changes can be defined in this diagram in more relevant way.
-
 Growth cycle process 4 stages powerpoint templates graphics slides 0712
This diagram can be used to represent the relationship and interconnectivity between diffrenet concepts for business growth
-
 Life cycle process 7 stages powerpoint templates graphics slides 0712
This diagram has the unique ability to explain route cause analysis.
-
 Linear mode process 6 stages powerpoint templates graphics slides 0712
It is suitable to visualize chronological sequences, milestones or a corporate history. The structured design of the Timeline Set helps to create a clear overview.
-
 Linear nonstop process 7 stages powerpoint templates graphics slides 0712
Linear Diagram for Microsoft PowerPoint to visualize current projects within a certain time or periodical section
-
 Process circle diagram 3 stages powerpoint templates graphics slides 0712
Use this graphic to represent a continuing sequence of stages, tasks, or events in a circular flow and emphasize the connection between all components.
-
 Six elements one goal powerpoint templates graphics slides 0712
This chart visualize the of process steps, re-occurrences and components or of your company structure or product features.
-
 Three outlined elements powerpoint templates graphics slides 0712
This diagram can be used to represent the relationship and interconnectivity between diffrenet concepts.
-
 Uniform business concepts 9 stages powerpoint templates graphics slides 0712
Striking uniform business concepts 9 stages PPT template. Easy and convenient downloading by following simple steps. No concession with the quality, once opened on wide screen. Modify and personalize the presentation by including the company name and logo. Guidance for executing the changes has been provided for assistance. Useful for sales leaders, marketers, business professionals, analysts, strategists, students, teachers, etc. Compatible with Microsoft office software and the Google slides. Available to be saved in jpg or pdf format. Access to change the content or insert information.
-
 2 contributing causes powerpoint diagrams presentation slides graphics 0912
With the assistance of this Diagram, you can can uncover chains of causal links that will lead you to contributing factors of the problem and allow them to implement effective barriers and solutions.
-
Use of different colors is good. It's simple and attractive.
-
Very well designed and informative templates.
-
The Designed Graphic are very professional and classic.
-
Content of slide is easy to understand and edit.
-
Great quality product.
-
Great quality slides in rapid time.
-
Awesomely designed templates, Easy to understand.
-
Designs have enough space to add content.
-
Great product with effective design. Helped a lot in our corporate presentations. Easy to edit and stunning visuals.
-
Qualitative and comprehensive slides.


